|
|
|
报告导航:研究报告—
制造业—能源矿产
|
|
2016-2020年全球及中国电力储能行业研究报告 |
 |
字数:5.1万 |
页数:147 |
图表数:125 |
|
中文电子版:9000元 |
中文纸版:4500元 |
中文(电子+纸)版:9500元 |
|
英文电子版:2600美元 |
英文纸版:2800美元 |
英文(电子+纸)版:2900美元 |
|
编号:HK074
|
发布日期:2016-08 |
附件:下载 |
 |
|
|
储能在电力系统中应用广泛,涉及发电、传输、分配以及终端用户的各个环节。2015年,全球累计电力储能(不含抽水蓄能、压缩空气和储热)装机规模946.8MW,近5年年均复合增长率达18%。全球电力储能装机主要位于美国和日本,二者所占比例之和约达78%。
从技术路线看,全球电力储能装机以锂离子电池和钠硫电池为主,2015年所占比例分别为38%和36%;从应用领域看,主要应用于可再生能源并网和调频辅助服务,占比分别为43%和22%。
全球电力储能装机规模较大的厂商主要位于亚洲,尤其日韩厂商表现抢眼。2015年,全球电力储能装机规模前5名厂商分别为LG chem、NEC、NGK、东芝和三星SDI。
图:2015年全球电力储能厂商TOP10(按装机规模)
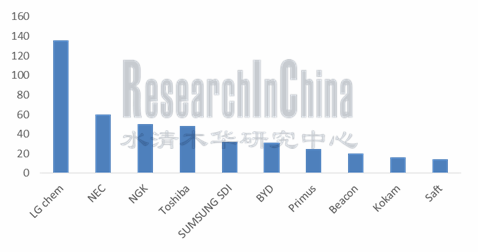
来源:水清木华研究中心
2015年,中国电力储能装机容量(不包含抽水蓄能、压缩空气储能及储热)约占全球的11%,近5年年均复合增长率高达110%。与国外不同,中国电力储能装机技术路线以锂离子电池为主(66%),应用领域主要为分布式发电及微网(56%)和可再生能源并网(35%)。
2015年,中国电力储能装机规模Top10厂商中,锂离子电池路线的厂商最多。前五名企业分别为比亚迪、大连融科、万向、南都电源和中航锂电,所占比例之和达63%。
比亚迪电力储能装机规模在2015年全球排名第6,中国排名第1,是锂离子电池路线的代表企业。公司储能电站采用磷酸铁锂电池技术,成本和运行寿命优势明显。目前公司储能领域客户包括国家电网、南方电网、中广核等。
大连融科是全球领先的全钒液流电池储能系统供应商,在中国液流电池厂商中装机规模最大;南都电源则在铅蓄电池厂商中装机规模最大,拥有行业领先的铅炭电池储能技术,已应用于可再生能源储能、分布式发电及微网、户用储能等领域。
水清木华研究中心《2016-2020年全球及中国电力储能行业研究报告》主要包括以下几个内容:
 全球电力储能装机规模及预测、技术路线、应用情况、竞争格局等; 全球电力储能装机规模及预测、技术路线、应用情况、竞争格局等;
中国电力储能装机规模及预测、技术路线、应用情况、竞争格局等;
全球及中国抽水蓄能、锂电池、飞轮储能、液流电池、超级电容等细分市场概况;
全球及中国风电、光伏、分布式发电及微网等应用市场现状及储能需求;
全球及中国21家重点企业的经营情况及电力储能业务分析等。
Energy storage finds widespread application in power system, involving power generation, transmission, distribution, and end users. Global cumulative installed capacity of electrical energy storage (EES) (excluding pumped hydro storage, compressed air energy storage and thermal storage) has grown at a CAGR of 18% over the past five years, hitting 946.8MW in 2015. The United States and Japan are leaders by installed capacity of EES, together holding 78% shares.
In 2015, lithium-ion battery and sodium-sulfur battery dominate the world’s installed capacity of EES, making up 38% and 36%, respectively; renewable energy grid integration and frequency regulation auxiliary services are two main applications, accounting for 43% and 22%, respectively.
Asia, particularly South Korea and Japan, is the home to the enterprises with larger installed capacity of EES. In 2015, the world’s top5 enterprises (by installed capacity of EES) were LG Chem, NEC, NGK, Toshiba, and Samsung SDI.
Global Top10 EES Enterprises (by Installed Capacity), 2015
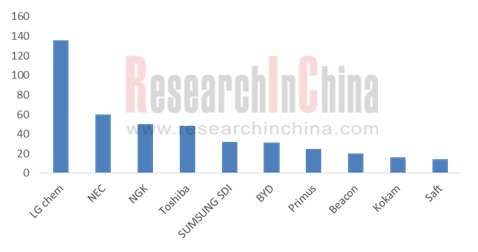
Source: ResearchInChina
In 2015, China’s installed capacity of EES (excluding pumped hydro storage, compressed air energy storage, and thermal storage) accounted for about 11% of the world’s total, at a CAGR of 110% over the past five years. Unlike foreign countries, China attaches great importance to lithium-ion battery technology which shares 66% of China’s total installed capacity of EES. Two major applications are distributed generation µgrid (56%) and renewable energy grid integration (35%).
In 2015, most of top10 Chinese enterprises with the largest installed capacity of EES employed lithium-ion battery technology. The first five enterprises were BYD, Dalian Rongke Power, Wanxiang, Zhejiang Narada Power Source, and China Aviation Lithium Battery, seizing a combined 63% share.
BYD: No.1 in China and No. 6 in the world by installed capacity of EES and a representative of lithium-ion battery roadmap. LiFePo4 battery technology for energy storage stations presents clear cost and service life advantages. Customers in energy storage field include State Grid Corporation of China, China Southern Power Grid Co., Ltd, China General Nuclear Power Group, etc.
Dalian Rongke Power: a world-leading supplier of vanadium redox batty (VRB) energy storage system and has the largest installed capacity among Chinese flow battery companies.
Zhejiang Narada Power Source: the largest installed capacity among lead storage battery companies; industry-leading lead-carbon battery storage technology already applied to renewable energy storage, distributed generation µgrid, residential energy storage, etc.
Global and China Electrical Energy Storage(EES) Industry Report, 2016-2020 highlights the followings:
 Global installed capacity of EES (scale and forecast, technology roadmap, application, competitive landscape, etc.); Global installed capacity of EES (scale and forecast, technology roadmap, application, competitive landscape, etc.);
China’s installed capacity of EES (scale and forecast, technology roadmap, application, competitive landscape, etc.);
Global and Chinese market segments (pumped storage, lithium battery, flywheel energy storage, flow battery, supercapacitor, etc.);
Global and Chinese application markets (wind power, PV, distributed generation, microgrid, etc.) and demand for energy storage;
21 major global and Chinese companies (operation, EES business, etc.)
第一章 电力储能概述
1.1 概述
1.2 应用
1.3 技术
1.4 产业链
第二章 全球电力储能行业发展现状
2.1 政策
2.2 储能规模
2.3 应用情况
2.4 融资情况
2.5 竞争格局
第三章 中国电力储能行业发展现状
3.1 政策环境
3.2 技术环境
3.3 储能规模
3.4 应用情况
3.5 竞争格局
3.6 发展趋势
第四章 电力储能细分市场概述
4.1 抽水蓄能
4.1.1 全球市场
4.1.2 中国市场
4.2 锂电池
4.2.1 全球
4.2.2 中国
4.3 飞轮储能
4.4 液流电池储能
4.4.1 全球市场
4.4.2 中国市场
4.5 压缩空气储能
4.6 钠硫电池
4.7 超级电容
4.7.1 全球市场
4.7.2 中国市场
第五章 电力储能上游原料概况
5.1 储能变流器
5.2 电池管理系统
第六章 电力储能下游应用概况
6.1 风力发电
6.1.1 全球市场
6.1.2 中国市场
6.2 光伏发电
6.2.1 全球市场
6.2.2 中国市场
6.3 分布式发电及微网
6.4 电网调峰
第七章 全球主要储能企业
7.1 LG Chem
7.1.1 经营情况
7.1.2 储能业务
7.2 Axion Power
7.2.1 公司简介
7.2.2 储能业务
7.3 Beacon power
7.3.1 公司简介
7.3.2 储能业务
7.4 GE
7.4.1 公司简介
7.4.2 经营情况
7.4.3 储能业务
7.5 Maxwell Technologies
7.5.1 公司简介
7.5.2 经营情况
7.5.3 储能业务
7.6 Altairnano Technologies
7.6.1 公司简介
7.6.2 储能业务
7.7 小结
第八章 中国主要储能企业
8.1圣阳股份
8.1.1 公司简介
8.1.2 经营情况
8.1.3 营收构成
8.1.4 毛利率
8.1.5 储能业务
8.1.6 前景及预测
8.2 南都电源
8.2.1 公司简介
8.2.2 经营情况
8.2.3 营收构成
8.2.4 毛利率
8.2.5 储能业务
8.2.6 前景及预测
8.3 汇川技术
8.3.1 公司简介
8.3.2 经营情况
8.3.3 储能业务
8.4 中天科技
8.4.1 公司简介
8.4.2 经营情况
8.4.3 储能业务
8.5 风帆股份
8.5.1 公司简介
8.5.2 经营情况
8.5.3 营收构成
8.5.4 毛利率
8.5.5 储能业务
8.5.6 前景及预测
8.6 比亚迪
8.6.1 公司简介
8.6.2 经营情况
8.6.3 营收构成
8.6.4 毛利率
8.6.5 储能业务
8.6.6 前景及预测
8.7 阳光电源
8.7.1 公司简介
8.7.2 经营情况
8.7.3 营收构成
8.7.4 毛利率
8.7.5 储能业务
8.7.6 前景及预测
8.8 上海电气
8.8.1 公司简介
8.8.2 营收情况
8.8.3 储能业务
8.9 欣旺达
8.9.1 公司简介
8.9.2 营收情况
8.9.3 营收构成
8.9.4 毛利率
8.9.5 储能业务
8.9.6 前景及预测
8.10 科陆电子
8.10.1 公司简介
8.10.2 经营情况
8.10.3 营收构成
8.10.4 毛利率
8.10.5 储能业务
8.10.6 前景及预测
8.11 普能科技
8.11.1 公司简介
8.11.2 储能业务
8.12 睿能科技
8.12.1 公司简介
8.12.2 储能业务
8.13 融科储能
8.13.1 公司简介
8.13.2 储能业务
8.14 润峰新能源
8.14.1 公司简介
8.14.2 储能业务
8.15 中航锂电
8.15.1 公司简介
8.15.2 储能业务
第九章 总结与预测
9.1 总结
9.1.1 装机规模
9.1.2 技术路线
9.1.3 应用领域
9.1.4 竞争格局
9.2 预测
1 Overview of EES
1.1 Overview
1.2 Application
1.3 Technology
1.4 Industrial Chain
2 Global EES Industry
2.1 Policy
2.2 Scale of Energy Storage
2.3 Application
2.4 Financing
2.5 Competitive Landscape
3 EES Industry in China
3.1 Policy Environment
3.2 Technology Environment
3.3 Scale of Energy Storage
3.4 Application
3.5 Competitive Landscape
3.6 Development Trend
4 Market Segments of EES
4.1 Pumped Hydro Storage
4.1.1 Global
4.1.2 China
4.2 Lithium Battery
4.2.1 Global
4.2.2 China
4.3 Flywheel Energy Storage
4.4 Flow Battery Energy Storage
4.4.1 Global
4.4.2 China
4.5 Compressed Air Energy Storage
4.6 Sodium-sulfur Battery
4.7 Supercapacitor
4.7.1 Global
4.7.2 China
5 Upstream Raw Materials of EES
5.1 Energy Storage Converter
5.2 Battery Management System
6 Applications of EES
6.1 Wind Power Generation
6.1.1 Global
6.1.2 China
6.2 PV Power Generation
6.2.1 Global
6.2.2 China
6.3 Distributed Generation and Microgrid
6.4 Peak Shaving
7 Major Global Energy Storage Enterprises
7.1 LG Chem
7.1.1 Operation
7.1.2 Energy Storage Business
7.2 Axion Power
7.2.1 Profile
7.2.2 Energy Storage Business
7.3 Beacon power
7.3.1 Profile
7.3.2 Energy Storage Business
7.4 GE
7.4.1 Profile
7.4.2 Operation
7.4.3 Energy Storage Business
7.5 Maxwell Technologies
7.5.1 Profile
7.5.2 Operation
7.5.3 Energy Storage Business
7.6 Altairnano Technologies
7.6.1 Profile
7.6.2 Energy Storage Business
7.7 Brief Summary
8 Major Chinese Energy Storage Enterprises
8.1 Shandong Sacred Sun Power Source Co., Ltd.
8.1.1 Profile
8.1.2 Operation
8.1.3 Revenue Structure
8.1.4 Gross Margin
8.1.5 Energy Storage Business
8.1.6 Prospects and Forecast
8.2 Zhejiang Narada Power Source Co., Ltd.
8.2.1 Profile
8.2.2 Operation
8.2.3 Revenue Structure
8.2.4 Gross Margin
8.2.5 Energy Storage Business
8.2.6 Prospects and Forecast
8.3 Shenzhen Inovance Technology Co., Ltd.
8.3.1 Profile
8.3.2 Operation
8.3.3 Energy Storage Business
8.4 Zhongtian Technology Co., Ltd.
8.4.1 Profile
8.4.2 Operation
8.4.3 Energy Storage Business
8.5 Fengfan Co., Ltd.
8.5.1 Profile
8.5.2 Operation
8.5.3 Revenue Structure
8.5.4 Gross Margin
8.5.5 Energy Storage Business
8.5.6Prospects and Forecast
8.6 BYD
8.6.1 Profile
8.6.2 Operation
8.6.3 Revenue Structure
8.6.4 Gross Margin
8.6.5 Energy Storage Business
8.6.6 Prospects and Forecast
8.7 Sungrow Power Supply Co., Ltd.
8.7.1 Profile
8.7.2 Operation
8.7.3 Revenue Structure
8.7.4 Gross Margin
8.7.5 Energy Storage Business
8.7.6 Prospects and Forecast
8.8 Shanghai Electric Co., Ltd
8.8.1 Profile
8.8.2 Operation
8.8.3 Energy Storage Business
8.9 Sunwoda Electronic Co., Ltd.
8.9.1 Profile
8.9.2 Operation
8.9.3 Revenue Structure
8.9.4 Gross Margin
8.9.5 Energy Storage Business
8.9.6 Prospects and Forecast
8.10 Shenzhen Clou Electronics Co., Ltd.
8.10.1 Profile
8.10.2 Operation
8.10.3 Revenue Structure
8.10.4 Gross Margin
8.10.5 Energy Storage Business
8.10.6 Prospects and Forecast
8.11 Prudent Energy
8.11.1 Profile
8.11.2 Energy Storage Business
8.12 RAY Power
8.12.1 Profile
8.12.2 Energy Storage Business
8.13 Dalian Rongke Power Co., Ltd.
8.13.1 Profile
8.13.2 Energy Storage Business
8.14 Shandong Realforce Enterprises Co., Ltd.
8.14.1 Profile
8.14.2 Energy Storage Business
8.15 China Aviation Lithium Battery Co., Ltd.
8.15.1 Profile
8.15.2 Energy Storage Business
9 Summary and Forecast
9.1 Summary
9.1.1 Installed Capacity
9.1.2 Technology Roadmap
9.1.3 Application
表:储能应用领域
表:储能在智能电网中的应用
图:储能在电力系统中的应用
表:储能技术分类
表:当前主流电力储能装机的技术指标(1)
表:当前主流电力储能装机的技术指标(2)
表:主要储能技术成熟度对比
表:各种储能技术成本比较
图:各种储能技术成本变化趋势
图:储能产业链
表:主要国家储能鼓励政策
图:2010-2015年全球电力储能市场累计装机容量
表:2015年全球电力储能市场(分区域)结构
图:2015年全球电力储能技术应用占比
图:2015年全球电力储能拟/在建项目装机容量(按技术路线)分布
表:2015年全球储能项目(分类型)装机及数量占比
表:2015年全球电力储能融资总额Top5企业及金额
图:2015年全球储能技术厂商的国家分布
图:2015年全球储能厂商TOP10
表:2011-2016年中国储能行业相关政策
图:2000-2015年中国电力储能市场装机容量
图:2015年中国电力储能技术应用占比
表:中国各区域储能项目分布情况
表:2015年中国储能项目(分类型)装机及数量占比
图:2015年中国储能项目装机厂商TOP10
表:中国主要储能企业及其技术路线
图:中国先进储能技术创新路线图
表:2015年全球主要抽水蓄能电站及装机容量
图:2010-2015年中国抽水蓄能装机容量
图:2011-2015年中国动力锂电池出货量
表:2015年中国汽车动力锂电池企业出货量占比
表:2015年全球飞轮储能(按应用领域)装机容量及项目数量占比
图:2015年全球飞轮储能主要企业及装机容量
表:全钒液流电池发展历程
表:中国钒电池企业及其业务范围
表:中国储能变流器主要企业及其产品
表:中国电池管理系统厂商分类及代表企业
表:2015年全球及中国主要电池管理系统生产企业
图:2001-2016年全球风电新增装机容量
图:2001-2016年全球风电累计装机容量
表:2014-2015年全球(分区域)风电装机容量
表:2015年全球风电新增装机容量TOP10国家及占比
表:2015年全球风电累计装机TOP10国家及占比
表:2012-2016年中国风电相关政策
图:2005-2020年中国新增及累计风电装机容量
图:2015年中国(分省市)新增风电装机容量
图:2015年中国(分省市)累计风电装机容量
表:2015年中国主要企业新增风电装机容量
表:截至2015年底中国主要企业累计风电装机容量
图:2009-2016年风电储能需求
图:2009-2016年全球年新增并网光伏装机容量与增速
图:2015年全球累计光伏装机容量地区分布
表:2009-2015年全球太阳能电池(分地区)产量
图:2009-2020年中国新增及累计光伏装机容量
表:2015年中国(分省市)光伏发电装机容量
图:2009-2015年中国光伏发电储能需求
图:2011-2015年LG化学销售收入及净利润
图:2011-2015年GE营业收入及净利润
图:Maxwell产业布局
表:全球主要储能企业
图:2011-2015年圣阳股份营业收入及净利润
表:2013-2015年圣阳股份(分产品)营业收入
图:2013-2015年圣阳股份(分产品)营业收入占比
表:2013-2015年圣阳股份(分地区)营业收入
图:2013-2015年圣阳股份(分地区)营业收入占比
图:2013-2015年圣阳股份(分产品)毛利率
表:2013-2015年圣阳股份重点储能项目
图:2015-2020年圣阳股份营业收入及净利润预测
图:2011-2015年南都电源营业收入及净利润
表:2013-2015年南都电源(分行业)营业收入
图:2013-2015年南都电源(分行业)营业收入占比
表:2013-2015年南都电源(分产品)营业收入
图:2013-2015年南都电源(分产品)营业收入占比
表:2013-2015年南都电源(分地区)营业收入
图:2013-2015年南都电源(分地区)营业收入占比
图:2013-2015年南都电源(分行业)毛利率
图:2013-2015年南都电源(分产品)毛利率
表:南都电源铅炭电池技术路线中标的部分储能项目
图:2015-2020年南都电源营业收入及净利润预测
图:2011-2015年汇川技术营业收入及净利润
图:2011-2015年中天科技营业收入及净利润
图:2013-2015年中天储能营业收入及净利润
图:2011-2015年风帆股份营业收入及净利润
表:2013-2015年风帆股份(分产品)营业收入
图:2013-2015年风帆股份(分产品)营业收入占比
表:2013-2015年风帆股份(分地区)营业收入
图:2013-2015年风帆股份(分地区)营业收入占比
图:2013-2015年风帆股份(分产品)毛利率
图:2011-2015年比亚迪营业收入和净利润
表:2013-2015年比亚迪(分产品)营业收入
图:2013-2015年比亚迪(分产品)营业收入占比
表:2013-2015年比亚迪(分地区)营业收入
图:2013-2015年比亚迪(分地区)营业收入占比
图:2012-2015比亚迪主营产品毛利率
图:2015-2020年比亚迪营收和净利润预测
图:2011-2015年阳光电源营业收入及净利润
表:2013-2015年阳光电源(分产品)营业收入
图:2013-2015年阳光电源(分产品)营业收入占比
表:2013-2015年阳光电源(分地区)营业收入
图:2013-2015年阳光电源(分地区)营业收入占比
图:2013-2015年阳光电源(分产品)毛利率
图:2015-2020年阳光电源营业收入及净利润预测
图:2011-2015年上海电气营业收入及净利润
图:2011-2015年欣旺达营业收入及净利润
表:2013-2015年欣旺达(分产品)营业收入
表:2013-2015年欣旺达(分产品)营业收入占比
表:2013-2015年欣旺达(分地区)营业收入
图:2013-2015年欣旺达(分地区)营业收入占比
图:2013-2015年欣旺达(分产品)毛利率
图:2015-2020年欣旺达营业收入及净利润预测
图:2011-2015年科陆电子营业收入及净利润
表:2013-2015年科陆电子(分产品)营业收入
图:2013-2015年科陆电子(分产品)营业收入占比
表:2013-2015年科陆电子(分地区)营业收入
图:2013-2015年科陆电子(分地区)营业收入占比
图:2013-2015年科陆电子(分产品)毛利率
图:2015-2020年科陆电子营业收入及净利润预测
表:普能科技千瓦级全钒液流电池储能系统应用项目
表:普能科技兆瓦级全钒液流电池储能系统应用项目
表:融科储能主要储能项目
表:2010-2015年全球及中国电力储能装机容量
表:2015年全球及中国电力储能装机容量不同储能技术占比
表:2015年全球及中国电力储能装机容量应用领域占比
表:2015年全球及中国电力储能装机规模Top10企业及占比
图:2015-2020年全球及中国电力储能累计装机容量预测
Applications of Energy Storage
Application of Energy Storage in Smart Grid
Application of Energy Storage in Electric Power System
Classification of Energy Storage Technologies
Technical Indicators of Currently Mainstream Electrical Energy Storage (I)
Technical Indicators of Currently Mainstream Electrical Energy Storage (II)
Comparison in Maturity of Major Energy Storage Technologies
Comparison in Costs of Various Energy Storage Technologies
Trends in Costs of Various Energy Storage Technologies
Energy Storage Industry Chain
Major Incentive Policies on Energy Storage in Major Countries
Cumulative Installed Capacity of Electrical Energy Storage Worldwide, 2010-2015
Global Electrical Energy Storage Market Structure by Region, 2015
Proportion of Electrical Energy Storage Technologies Worldwide by Application, 2015
Installed Capacity of Global Proposed/Ongoing Electrical Energy Storage Projects by Technology Roadmap, 2015
Percentage of Installed Energy Storage Projects Worldwide by Type, 2015
Global Top 5 Electrical Energy Storage Enterprises by Financing and Their Financing Amount, 2015
Global Distribution of Energy Storage Technology Suppliers by Country, 2015
Global TOP 10 Energy Storage Enterprises, 2015
China’s Policies on Energy Storage Industry, 2011-2016
Installed Capacity of Electrical Energy Storage in China, 2000-2015
Proportion of Electrical Energy Storage Technologies in China by Application, 2015
Distribution of Energy Storage Projects in China by Region
Percentage of Installed Energy Storage Projects in China by Type, 2015
TOP10 Energy Storage Enterprises in China by Installed Capacity, 2015
Leading Energy Storage Enterprises and Technology Roadmaps in China
Innovative Technology Roadmap for Advanced Energy Storage Technologies in China
Installed Capacity of Major Pumped Storage Power Stations Worldwide, 2015
Installed Capacity of Pumped Storage in China, 2010-2015
Shipments of Power Lithium Batteries in China, 2011-2015
Proportion of Automotive Power Lithium Battery Manufacturers in China by Shipment, 2015
Installed Capacity (by Application) and Project Proportion of Flywheel Energy Storage Worldwide, 2015
Installed Capacity of Major Flywheel Energy Storage Enterprises Worldwide, 2015
Development History of All-vanadium Redox Flow Battery
Chinese Vanadium Battery Enterprises and Their Business Scope
Major Chinese Energy Storage Converter Manufacturers and Their Products
Classification of Battery Management System Manufacturers in China and Typical Enterprises
Major Global and Chinese Battery Management System Manufacturers, 2015
New Installed Capacity of Wind Power Worldwide, 2001-2016
Cumulative Installed Capacity of Wind Power Worldwide, 2001-2016
Global Wind Power Installed Capacity by Region, 2014-2015
TOP 10 Countries Worldwide by New Wind Power Installed Capacity and Their Proportion, 2015
TOP 10 Countries Worldwide by Cumulative Wind Power Installed Capacity and Their Proportion, 2015
Policies on Wind Power in China, 2012-2016
New and Cumulative Wind Power Installed Capacity in China, 2005-2020E
New Wind Power Installed Capacity in China by Province, 2015
Cumulative Installed Capacity of Wind Power in China by Province, 2015
New Wind Power Installed Capacity of Major Enterprises in China, 2015
Cumulative Wind Power Installed Capacity of Major Enterprises in China as of the end of 2015
Demand for Wind Power Storage, 2009-2016
Annually Added Installed Capacity and Growth Rate of Grid-Connected PV Worldwide, 2009-2016
Cumulative PV Installed Capacity Worldwide by Region, 2015
Output of Solar Cells Worldwide by Region, 2009-2015
New and Cumulative PV Installed Capacity in China, 2009-2020E
PV Installed Capacity in China by Province, 2015
Energy Storage Demand of PV Power Generation in China, 2009-2015
Revenue and Net Income of LG Chem, 2011-2015
Revenue and Net Income of GE, 2011-2015
Maxwell’s Industrial Layout
Major Energy Storage Companies Worldwide
Revenue and Net Income of Sacred Sun, 2011-2015
Revenue Breakdown of Sacred Sun (by Product), 2013-2015
Revenue Structure of Sacred Sun (by Product), 2013-2015
Revenue Breakdown of Sacred Sun (by Region), 2013-2015
Revenue Structure of Sacred Sun (by Region), 2013-2015
Gross Margin of Sacred Sun (by Product), 2013-2015
Key Energy Storage Projects of Sacred Sun, 2013-2015
Revenue and Net Income of Sacred Sun, 2015-2020E
Revenue and Net Income of Zhejiang Narada Power Source, 2011-2015
Revenue Breakdown of Zhejiang Narada Power Source (by Sector), 2013-2015
Revenue Structure of Zhejiang Narada Power Source (by Sector), 2013-2015
Revenue Breakdown of Zhejiang Narada Power Source (by Product), 2013-2015
Revenue Structure of Zhejiang Narada Power Source (by Product), 2013-2015
Revenue Breakdown of Zhejiang Narada Power Source (by Region), 2012-2015
Revenue Structure of Zhejiang Narada Power Source (by Region), 2012-2015
Gross Margin of Zhejiang Narada Power Source (by Sector), 2013-2015
Gross Margin of Zhejiang Narada Power Source (by Product), 2013-2015
Some Energy Storage Projects Won with Lead Carbon Battery Technology Roadmap of Zhejiang Narada Power Source
Revenue and Net Income of Zhejiang Narada Power Source, 2015-2020E
Revenue and Net Income of Shenzhen Inovance Technology, 2011-2015
Revenue and Net Income of Zhongtian Technology, 2011-2015
Revenue and Net Income of ZTT Energy Storage Technology, 2013-2015
Revenue and Net Income of Fengfan Co.,2011-2015
Revenue Breakdown of Fengfan Co. (by Product), 2013-2015
Revenue Structure of Fengfan Co. (by Product), 2013-2015
Revenue Breakdown of Fengfan Co. (by Region), 2013-2015
Revenue Structure of Fengfan Co. (by Region), 2013-2015
Gross Margin of Fengfan Co.(by Product), 2013-2015
Revenue and Net Income of BYD, 2011-2015
Revenue Breakdown of BYD (by Product), 2013-2015
Revenue Structure of BYD (by Product), 2013-2015
Revenue Breakdown of BYD (by Region), 2013-2015
Revenue Structure of BYD (by Region), 2013-2015
Gross Margin of BYD’s Main Products, 2012-2015
Revenue and Net Income of BYD, 2014-2020E
Revenue and Net Income of Sungrow Power Supply, 2011-2015
Revenue Breakdown of Sungrow Power Supply (by Product), 2013-2015
Revenue Structure of Sungrow Power Supply (by Product), 2013-2015
Revenue Breakdown of Sungrow Power Supply (by Region), 2013-2015
Revenue Structure of Sungrow Power Supply (by Region), 2013-2015
Gross Margin of Sungrow Power Supply (by Product), 2013-2015
Revenue and Net Income of Sungrow Power Supply, 2015-2020E
Revenue and Net Income of Shanghai Electric, 2011-2015
Revenue and Net Income of Sunwoda Electronic, 2011-2015
Revenue Breakdown of Sunwoda Electronic (by Product), 2013-2015
Revenue Structure of Sunwoda Electronic (by Product), 2013-2015
Revenue Breakdown of Sunwoda Electronic (by Region), 2013-2015
Revenue Structure of Sunwoda Electronic (by Region), 2013-2015
Gross Margin of Sunwoda Electronic (by Product), 2013-2015
Revenue and Net Income of Sunwoda Electronic, 2015-2020E
Revenue and Net Income of Shenzhen Clou Electronics, 2011-2015
Revenue Breakdown of Shenzhen Clou Electronics (by Product), 2013-2015
Revenue Structure of Shenzhen Clou Electronics (by Product), 2013-2015
Revenue Breakdown of Shenzhen Clou Electronics (by Region), 2013-2015
Revenue Structure of Shenzhen Clou Electronics (by Region), 2013-2015
Gross Margin of Shenzhen Clou Electronics (by Product), 2013-2015
Revenue and Net Income of Shenzhen Clou Electronics, 2015-2020E
KW-level VRB Energy Storage System Application Projects of Prudent Energy
MW-level VRB Energy Storage System Application Projects of Prudent Energy
Key Energy Storage Projects of Rongke Power
Global and Chinese Electrical Energy Storage Installed Capacity, 2010-2015
Installed Capacity Structure of Global and Chinese Electrical Energy Storage by Energy Storage Technology, 2015
Installed Capacity Structure of Global and Chinese Electrical Energy Storage by Application, 2015
Top10 Global and Chinese Electrical Energy Storage Enterprises by Installed Capacity and Their Percentage, 2015
Cumulative Installed Capacity of Global and Chinese Electrical Energy Storage, 2015-2020E
如果这份报告不能满足您的要求,我们还可以为您定制报告,请 留言说明您的详细需求。
|