|
|
|
报告导航:研究报告—
金融与服务业—金融业
|
|
2016-2020年中国金融POS机行业研究报告 |
 |
字数:4.9万 |
页数:185 |
图表数:180 |
|
中文电子版:9000元 |
中文纸版:4500元 |
中文(电子+纸)版:9500元 |
|
英文电子版:2400美元 |
英文纸版:2600美元 |
英文(电子+纸)版:2700美元 |
|
编号:ZJF091
|
发布日期:2016-08 |
附件:下载 |
 |
|
|
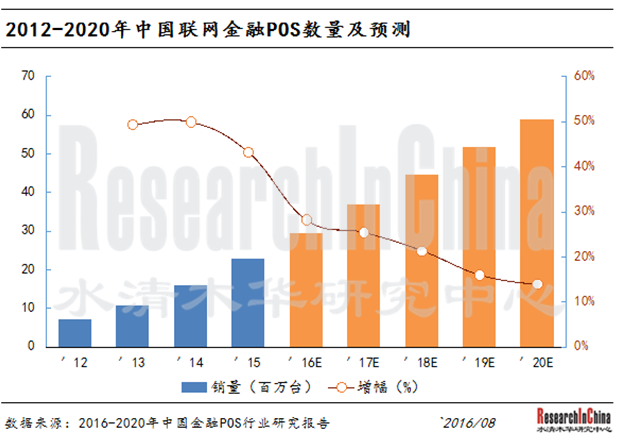
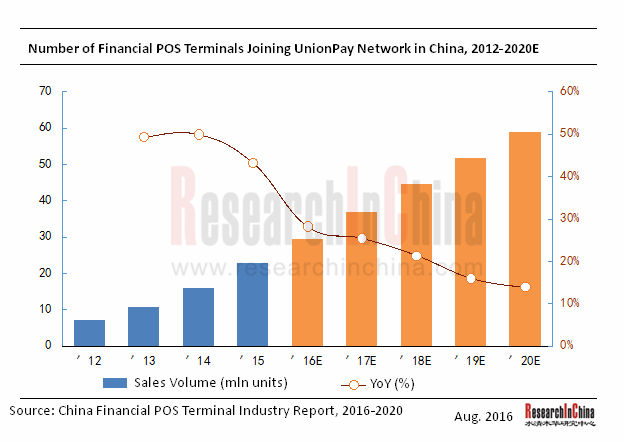
虽然随着电子信息技术和互联网技术的发展,网上支付、手机支付和固定电话支付等新兴支付方式对传统消费领域的电子支付产生一定的分流作用,对基于POS终端的电子支付方式产生一定影响。但是POS机厂商主动适应市场环境,不断推出如带有蓝牙、USB、NFC、二维码等支付功能的产品,使得该行业持续稳定发展。截至2015年底,中国加入银联网络的POS终端为2,282万台,同比增长43.2%。
经过多年的发展,中国POS受理环境进一步得到改善,2015年每台POS终端对应的银行卡数量下降到为240张,千人POS终端拥有量上升到16.66台。但与主要发达国家相比,中国每台POS终端对应的银行卡数量仍然较高。未来几年,随着新兴技术不断引入,POS支付更加简便而且安全,POS终端市场潜力将逐步得到释放。预计到2020年中国加入银联网络的POS终端累计数量将达到5,885万台,较2015年年均复合增长率达到20.9%。
在竞争格局方面,由于认证体系严格,POS终端行业进入壁垒较高,市场集中度比较高。中国市场主要POS终端品牌有联迪商用、百富环球、新国都、华智融科技、惠尔丰、新大陆、九思泰达等。2015年,联迪商用销售约320万台,继续领先其他厂商;百富环球销量约为205万台,排名第二;新国都以172.4万台排名第三。
联迪商用是法国Ingenico独资子公司,2012年完成全部控股。依靠Ingenico的技术支持,联迪商用形成较为完整的产品线,涵盖金融支付终端、移动支付终端、智能支付终端等。截至2016年3月,该公司POS机销量累计1000万台。2016年5月,该公司推出全新一代金融安全POS终端产品E8家族系列。
百富环球是港交所上市公司,主要开发及销售EFT-POS产品并提供相关服务,产品线较为丰富。公司自成立以来累计出货量超过1400万台,2015年全球出货量达到第三位。在市场开拓方面,公司坚持海内外业务并重。目前该公司在美国、EMEA、巴西、APAC等地销售业绩斐然,合计占公司总收入55%。
新国都是A股上市公司,专业从事支付终端产品研发、生产和销售,目前产品主要包括台式POS、手持无线POS、电话POS以及多媒体POS等。2015年,随着公司新生产线投产,POS机年产能约为242万台。此外,公司制定了“终端+互联网+金融+大数据”的战略,未来将运用互联网支付技术建设基于云计算、云存储技术的交易数据处理和存储能力,为客户和商户提供涵盖支付智能终端设备、线上线下支付技术运营服务等一站式综合支付服务解决方案。
《2016-2020年中国金融POS机行业研究报告》报告主要包括以下内容:
 中国金融POS机市场概况(包括定义及分类,技术类别,产业链、行业政策以及发展趋势等); 中国金融POS机市场概况(包括定义及分类,技术类别,产业链、行业政策以及发展趋势等);
全球支付行业分析(包括发卡情况、消费量、POS机出货情况、竞争格局等);
中国POS终端行业分析(包括市场规模、竞争格局、进出口);
中国支付行业分析(包括非现金支付情况、银行卡支付情况、第三方支付情况等);
中国收单行业分析(包括基本概况、行业政策、市场规模、竞争格局等);
包括Ingenico、Verifone、Cybernet、Bitel、First Data五家海外厂商以及联迪商用、百富环球、新国都、新大陆、华智融、证通电子、虹堡科技、信雅达八家国内厂商的企业分析,包括公司简介、财务状况、主打产品、研发状况、生产基地分布以及技术特点等。
With the development of electronic information technology and Internet technology, emerging payments like online payment, mobile payment and fixed-line phone payment have produced certain shunting effect on e-payment in the traditional consumption areas as well as exerted an influence on POS terminal-based e-payments. However, POS terminal manufacturers have taken the initiative to adapt to the market environment by constantly launching the products with Bluetooth, USB, NFC, QR code and other payment functions, so as to keep the sustained and steady development of the industry. By the end of 2015, 22.82 million units of POS terminals joined the UnionPay network in China, up 43.2% YoY.
After years of development, China’s POS acquiring environment has been further improved. In 2015, each POS terminal corresponded to 240 bankcards; POS terminal ownership per 1,000 people rose to 16.66 units. But compared with major developed countries, the number of bankcards corresponding to a POS terminal in China is still high. In the next few years, as emerging technologies are introduced, POS payments will be safer and more convenient, and the POS terminal market potential will be gradually released. By 2020, there will be 58.85 million POS terminals joining the UnionPay network in China, registering a CAGR of 20.9% during 2015-2020.
In terms of competition, due to strict certification system, POS terminal industry has high barriers to entry and thus a relatively high market concentration. Leading POS terminal brands in the Chinese market include LANDI Commercial Equipment, PAX Global, Xinguodu, New POS Technology, VeriFone, Newland and Justtide. In 2015, Fujian LANDI Commercial Equipment Co., Ltd sold roughly 3.2 million units, still ahead of its counterparts, followed by PAX Global Technology Limited with 2.05 million units and Shenzhen Xinguodu Technology Co., Ltd with 1.724 million units.
Fujian LANDI Commercial Equipment Co., Ltd is a wholly-owned subsidiary of the France-based Ingenico (100% shareholding in 2012). Relying on the latter’s technical support, Fujian LANDI Commercial Equipment have shaped a complete product line covering financial payment terminals, mobile payment terminals as well as smart payment terminals. As of March 2016, the company sold a total of 10 million units of POS terminals. In May 2016, it launched a new generation of financial security POS terminal product named E8 Family.
The Hong Kong Stock Exchange-listed PAX Global Technology Limited mainly develops and sells EFT-POS products as well as provides related services, with a rich product line. The company has shipped more than 14 million units since its inception, ranking third worldwide in 2015. With respect to market development, it has been adhering to the business at home and abroad, boasting remarkable achievements in the United States, EMEA, Brazil, APAC, etc., which accounts for 55% of total revenue.
As a listed company in China's A share market, Shenzhen Xinguodu Technology Co., Ltd specializes in the R&D, production and sales of payment terminal products; featured products include desktop POS, wireless handheld POS, telephone POS, multimedia POS, etc. In 2015, as its new production line went into production, about 2.42 million units of POS terminals were produced each year. In addition, the company has developed the “terminal + Internet + finance + big data” strategy, according to which, Internet payment technology will be used in the cloud computing and cloud storage technology based transaction data processing and storage capacity building, so as to provide customers and merchants with the one-stop integrated payment service solutions containing smart payment terminals, online and offline payment technology operation services.
The report provides the following:
 Overview of Chinese financial POS terminal market, embracing definition & classification, category of technology, industrial chain, policies and trends; Overview of Chinese financial POS terminal market, embracing definition & classification, category of technology, industrial chain, policies and trends;
Analysis on global payment industry, including card issuance, consumption, POS terminal shipments, competition pattern, etc.;
Analysis on Chinese POS terminal industry, including market size, competition, import & export;
Analysis on Chinese payment industry, involving non-cash payment, bank card payment, third-party payment, etc.;
Analysis on Chinese acquiring industry, such as general situation, policies, market size, competition pattern, etc.;
Analysis on five overseas companies (Ingenico, Verifone, Cybernet, Bitel, First Data) and eight Chinese peers (Fujian LANDI Commercial Equipment, PAX Global Technology, Shenzhen Xinguodu Technology, Fujian Newland Computer, SZZT Electronics Shenzhen, New POS Technology, Castles Technology, and Sunyard System Engineering), including their profile, financial conditions, featured products, R&D status, distribution of production bases, technical features, etc.
第一章 金融POS终端行业概况
1.1 定义和分类
1.1.1 定义
1.1.2 分类
1.2 主要POS终端技术
1.2.1 概况
1.2.2 固定POS终端
1.2.3 移动POS终端
1.2.4 手机刷卡器
1.2.5 支持NFC的POS终端
1.2.6 支持二维码扫描的POS终端
1.2.7 商业管理POS(CMPOS)
1.2.8 未来发展趋势
1.3 产业链及价值链
1.3.1 产业链
1.3.2 价值链
1.4 相关业务及手续费
1.4.1 支付流程
1.4.2 相关业务
1.4.3 相关手续费
第二章 全球金融POS终端市场
2.1银行卡消费
2.1.1 全球市场
2.1.2 区域市场
2.2 POS终端出货量
2.2.1 全球市场
2.2.2 竞争格局
2.2.3 POS终端保有量
2.3 发展趋势
第三章 中国金融POS终端市场
3.1市场概况
3.2 市场规模
3.2.1 加入银联网络的商户
3.2.2 加入银联网络的POS终端
3.2.3 出货量
3.3 竞争格局
3.4 进出口
3.4.1 进口
3.4.2 出口
第四章 中国支付行业
4.1 非现金支付
4.1.1 概况
4.1.2 市场规模
4.2 银行卡支付
4.2.1 银行卡发行量
4.2.2 金融IC卡
4.2.3 银行卡支付
4.3 网络支付
4.3.1 概况
4.3.2 银行机构网络支付
4.3.3 第三方支付机构网络支付
第五章 中国金融POS终端收单市场
5.1 市场概况及相关政策
5.1.1 市场概况
5.1.2 相关政策
5.2 市场现状
5.3 市场规模及竞争格局
5.3.1 市场规模
5.3.2 竞争格局
5.4 主要收单机构
5.4.1 中国银联
5.4.2 第三方收单机构
第六章 全球主要金融POS终端生产企业
6.1 Ingenico
6.1.1 公司简介
6.1.2 经营业绩
6.1.3 营收构成
6.1.4 毛利率
6.1.5 研发支出
6.1.6 金融POS终端业务
6.1.7 在华业务
6.1.8 战略实施
6.2 VeriFone
6.2.1 公司简介
6.2.2 经营业绩
6.2.3 营收构成
6.2.4 毛利率
6.2.5 研发支出
6.2.6 金融POS终端业务
6.2.7 发展战略
6.3 Cybernet
6.3.1 公司简介
6.3.2 POS业务
6.3.3 主要市场
6.4 Bitel
6.4.1 公司简介
6.4.2 主要产品
6.5 First Data
6.5.1 公司简介
6.5.2 经营业绩
6.5.3 营收构成
第七章 中国主要金融POS终端生产企业
7.1 联迪商用
7.1.1 公司简介
7.1.2 经营业绩
7.1.3 主要产品
7.1.4 最新动态
7.2百富环球科技有限公司
7.2.1 公司简介
7.2.2 经营业绩
7.2.3 营收构成
7.2.4 毛利率
7.2.5 研发支出
7.2.6 金融POS终端业务
7.2.7 战略规划
7.3深圳市新国都技术股份有限公司
7.3.1 公司简介
7.3.2 经营业绩
7.3.3 营收构成
7.3.4 毛利率
7.3.5 研发支出
7.3.6 金融POS终端业务
7.4.7 POS产销分析
7.3.8 战略规划
7.4 福建新大陆电脑股份有限公司
7.4.1 公司简介
7.4.2 经营业绩
7.4.3 营收构成
7.4.4 毛利率
7.4.5 研发支出
7.4.6 金融POS终端业务
7.4.7收购国通星驿、国通世纪、新大陆支付
7.4.8商户服务系统与网络建设项目
7.5深圳市证通电子股份有限公司
7.5.1 公司简介
7.5.2 经营业绩
7.5.3 营收构成
7.5.4 毛利率
7.5.5 研发支出
7.5.6 金融POS终端业务
7.5.7 战略规划
7.6 深圳华智融科技有限公司
7.6.1 公司简介
7.6.2 经营业绩
7.7 虹堡科技
7.7.1 公司简介
7.7.2 经营业绩
7.7.3 营收构成
7.7.4 毛利率
7.7.5 研发支出
7.7.6 金融POS终端业务
7.7.7 发展战略
7.8 信雅达系统工程股份有限公司
7.8.1 公司简介
7.8.2 经营业绩
7.8.3 营收构成
7.8.4 毛利率
7.8.5 研发支出
7.8.6 金融POS终端业务
第八章 总结和预测
8.1 全球及中国
8.1.1 出货量对比
8.1.2 市场份额对比
8.2 企业经营情况
8.2.1 营业收入
8.2.2 净利润
8.2.3 毛利率
8.2.4 研发支出
1 Overview of Financial POS Terminal Industry
1.1 Definition & Classification
1.1.1 Definition
1.1.2 Classification
1.2 Primary POS Terminal Technologies
1.2.1 Profile
1.2.2 Fixed POS Terminal
1.2.3 Mobile POS Terminal
1.2.4 Imagpay
1.2.5 NFC POS Terminal
1.2.6 QR Code POS Terminal
1.2.7 CMPOS (Commercial Management Point of Sale)
1.2.8 Trends
1.3 Industrial Chain & Value Chain
1.3.1 Industrial Chain
1.3.2 Value Chain
1.4 Related Services & Fees
1.4.1 Payment Process
1.4.2 Related Services
1.4.3 Related Fees
2 Global Financial POS Terminal Market
2.1 Consumption via Bankcards
2.1.1 Global Market
2.1.2 Regional Market
2.2 POS Terminal Shipments
2.2.1 Global Market
2.2.2 Competition Pattern
2.2.3 POS Terminal Ownership
2.3 Trends
3 China Financial POS Terminal Market
3.1 Market Overview
3.2 Market Size
3.2.1 UnionPay Merchants
3.2.2 UnionPay POS Terminals
3.2.3 Shipments
3.3 Competition Pattern
3.4 Import & Export
3.4.1 Import
3.4.2 Export
4 China Payment Industry
4.1 Non-Cash Payment
4.1.1 Profile
4.1.2 Market Size
4.2 Bank Card Payment
4.2.1 Bank Card Issuance
4.2.2 Financial IC Card
4.2.3 Bank Card Payment
4.3 Internet Payment
4.3.1 Profile
4.3.2 Internet Payment via Banking Institutions
4.3.3 Internet Payment via Third-Party Institutions
5 China Financial POS Terminal Acquiring Market
5.1 Market Overview & Related Policies
5.1.1 Market Overview
5.1.2 Related Policies
5.2 Market Situation
5.3 Market Size & Competition Pattern
5.3.1 Market Size
5.3.2 Competition Pattern
5.4 Main Acquirers
5.4.1 China UnionPay
5.4.2 Third-Party Acquirers
6 Key Players in the World
6.1 Ingenico
6.1.1 Profile
6.1.2 Business Performance
6.1.3 Revenue Structure
6.1.4 Gross Margin
6.1.5 R&D Costs
6.1.6 Financial POS Terminal Business
6.1.7 Business in China
6.1.8 Strategic Implementation
6.2 VeriFone
6.2.1 Profile
6.2.2 Business Performance
6.2.3 Revenue Structure
6.2.4 Gross Margin
6.2.5 R&D Costs
6.2.6 Financial POS Terminal Business
6.2.7 Development Strategy
6.3 Cybernet
6.3.1 Profile
6.3.2 POS Business
6.3.3 Principal Markets
6.4 Bitel
6.4.1 Profile
6.4.2 Main Products
6.5 First Data
6.5.1 Profile
6.5.2 Business Performance
6.5.3 Revenue Structure
7 Key Players in China
7.1 Fujian LANDI Commercial Equipment Co., Ltd
7.1.1 Profile
7.1.2 Business Performance
7.1.3 Main Products
7.1.4 Recent News
7.2 PAX Global Technology Limited
7.2.1 Profile
7.2.2 Business Performance
7.2.3 Revenue Structure
7.2.4 Gross Margin
7.2.5 R&D Costs
7.2.6 Financial POS Terminal Business
7.2.7 Strategic Planning
7.3 Shenzhen Xinguodu Technology Co., Ltd
7.3.1 Profile
7.3.2 Business Performance
7.3.3 Revenue Structure
7.3.4 Gross Margin
7.3.5 R&D Costs
7.3.6 Financial POS Terminal Business
7.3.7 POS Production & Marketing
7.3.8 Strategic Planning
7.4 Fujian Newland Computer Co., Ltd.
7.4.1 Profile
7.4.2 Business Performance
7.4.3 Revenue Structure
7.4.4 Gross Margin
7.4.5 R&D Costs
7.4.6 Financial POS Terminal Business
7.4.7 Acquisition of POSTAR, Gomtel and Newland Payment Technology
7.4.8 Merchant Service System & Network Construction Projects
7.5 SZZT Electronics Shenzhen Co., Ltd.
7.5.1 Profile
7.5.2 Business Performance
7.5.3 Revenue Structure
7.5.4 Gross Margin
7.5.5 R&D Costs
7.5.6 Financial POS Terminal Business
7.5.7 Strategic Planning
7.6 New POS Technology Limited
7.6.1 Profile
7.6.2 Business Performance
7.7 Castles Technology Co., Ltd.
7.7.1 Profile
7.7.2 Business Performance
7.7.3 Revenue Structure
7.7.4 Gross Margin
7.7.5 R&D Costs
7.7.6 Financial POS Terminal Business
7.7.7 Development Strategy
7.8 Sunyard System Engineering Co. Ltd
7.8.1 Profile
7.8.2 Business Performance
7.8.3 Revenue Structure
7.8.4 Gross Margin
7.8.5 R&D Costs
7.8.6 Financial POS Terminal Business
8 Summary & Forecasts
8.1 Global and China
8.1.1 Shipments Comparison
8.1.2 Market Share Comparison
8.2 Corporate Operation
8.2.1 Revenue
8.2.2 Net Income
8.2.3 Gross Margin
8.2.4 R&D Costs
表:金融POS终端分类及其优缺点
表:线下移动支付方式比较
表:手机刷卡器主要细分产品及特点
表:中国手机刷卡器主要生产企业及其产品特点
图:银行卡在POS终端上消费价值链
图:一般银行卡电子支付交易的流程
表:全球及中国POS机刷卡相关业务及涉及机构
表:现中国银行卡刷卡各商户需支付的手续费(分发卡行、收单机构、清算机构)
表:2016年新政实施后银行卡刷卡手续费收费主体及执行费率的变化
图:2012-2015年全球银行卡发行量(分银行卡品牌)
图:2012-2015年全球银行卡消费交易量
图:2015年全球主要银行卡品牌消费交易量
表:2010-2014年CPSS国家银行卡发卡量(支付功能)
表:2010-2014年CPSS国家银行卡发卡量(支付功能)增速
表:2010-2014年CPSS国家银行卡消费交易量
表:2010-2014年CPSS国家银行卡消费交易量增速
表:2010-2014年CPSS国家银行卡消费交易额
表:2010-2014年CPSS国家银行卡消费交易额增速
图:2007-2020年全球POS终端出货量及同比增长
图:2010-2020年全球支持NFC的POS终端出货量及同比增长
表:2014-2015年全球POS终端出货量Top10生产商及其市场份额
表:2010-2014年CPSS国家POS终端数量
表:2010-2014年CPSS国家POS终端数量同比增速
表:2010-2014年CPSS国家每百万人POS终端数量
图:中国POS机发展历程及特点
图:2007-2020年中国加入银联网络的商户数量及同比增长
图:2007-2020年中国加入银联网络的净增商户数量及同比增长
图:2007-2020年中国加入银联网络的POS终端数量及同比增长
图:2007-2020年中国加入银联网络的新增POS机数量及同比增长
图:2007-2020年中国每台POS终端对应的银行卡数量
图:2007-2020年中国每千人POS终端拥有量
图:2009-2020年中国POS终端出货量及同比增长
表:2014-2015年中国POS终端销量Top10的企业
图:2010-2016年中国POS终端进口量及同比增长
图:2010-2016年中国POS终端进口额及同比增长
图:2010-2016年中国POS终端出口量及同比增长
图:2010-2016年中国POS终端出口额及同比增长
图:非现金支付工具
图:2007-2020年中国非现金支付交易量及同比增长
图:2007-2020年中国非现金支付构成(按交易量)
图:2007-2020年中国非现金支付交易额及同比增长
图:2007-2020年中国非现金支付构成(按交易额)
图:2007-2020年中国每笔非现金支付平均交易额
图:2007-2020年中国银行卡累计发行量及同比增长
图:2007-2020年中国借记卡及信用卡发行量
表:2011-2015年中国金融IC卡受理环境改造和发行时间表
表:2010-2020年中国银行卡及金融IC卡发行量
图:2007-2020年中国银行卡支付交易量及同比增长
图:2007-2020年中国银行卡支付构成(按交易量)
图:2007-2020年中国银行卡支付交易额及同比增长
图:2007-2020年中国银行卡支付构成(按交易额)
图:2007-2020年中国每笔银行卡平均交易额
图:截至2016年8月获得第三方支付牌照的机构数量(分类别)
图:2012-2020年中国银行机构互联网支付及移动支付交易量
图:2012-2020年中国银行机构互联网支付及移动支付交易额
图:2012-2020年中国银行机构每笔互联网支付及移动支付平均交易额
图:2012-2020年中国第三方支付机构互联网支付及移动支付交易量
图:2012-2020年中国第三方支付机构互联网支付及移动支付交易额
图:2012-2020年中国第三方支付机构每笔互联网支付及移动支付平均交易额
图:POS收单模式
图:2007-2020年中国POS终端交易笔数及同比增长
图:2007-2020年中国POS终端交易额及同比增长
图:2007-2020年中国POS终端平均每笔交易额
图:2007-2020年中国POS收单手续费收入
表:2013-2015年中国POS收单市场主要机构及市场份额
图:2007-2016年中国银联商务服务商户数、同比增长及市场份额
图:2007-2016年中国银联商务维护的POS终端数量、同比增长及市场份额
表:2013-2014年Ingenico员工人数(分国家)
图:2009-2016年Ingenico营业收入及同比增长
图:2009-2015年Ingenico净利润及同比增长
图:2010-2016年Ingenico营收构成(分业务)
图:2015-2016年Ingenico营收构成(分区域)
图:2009-2015年Ingenico毛利、同比增长及毛利率
图:2009-2015年Ingenico研发支出、同比增长及其占营业收入比例
表:Ingenico主要POS终端产品及特点
图:2009-2015年Ingenico POS终端全球销量
表:Ingenico在华子公司
图:2015年Ingenico战略实施进展
图:2015-2020年Ingenico营业收入及同比增长
表:VeriFone子公司
图:2009-2016财年VeriFone营业收入及同比增长
图:2009-2016财年VeriFone净利润及同比增长
图:2009-2016财年VeriFone营收构成(分产品)
表:2009-2016财年VeriFone营收构成(分区域)
图:2009-2016财年VeriFone毛利、同比增长及毛利率
图:2009-2016财年VeriFone毛利率(分业务)
图:2009-2016财年VeriFone研发支出及同比增长
图:2009-2015年VeriFone POS终端全球销量
图:2015-2020财年VeriFone营业收入及同比增长
图:2009-2015年Cybernet POS终端全球销量及同比增长
表:Bitel的主要产品及参数
图:2009-2015年Bitel POS终端全球销量及同比增长
图:2009-2016年First Data营业收入及同比增长
图:2009-2016年First Data净利润
表:2012-2015年First Data营收构成(分业务)
图:2009-2018年联迪商用POS终端销量及同比增长
表:联迪商用主要POS终端及特征
图:2009-2015年百富环球营业收入及同比增长
图:2009-2015年百富环球净利润及同比增长
图:2008-2015年百富环球营收构成(分产品)
图:2009-2015年百富环球营收构成(分区域)
表:近年百富环球主要区域POS机业务扩展情况
图:2009-2015年百富环球毛利、同比增长及毛利率
图:2008-2015年百富环球研发支出、同比增长及其占营业收入比例
表:百富环球主要POS终端机特征
图:2009-2015年百富环球POS终端销量、销售额及平均单价
图:2015-2020年百富环球营业收入及同比增长
表:2013-2015年新国都主要子公司营业收入及净利润
图:2009-2016年新国都营业收入及同比增长
图:2009-2016年新国都净利润及同比增长
图:2009-2015年新国都营收构成(分业务)
图:2014-2015年新国都营收构成(分区域)
图:2009-2015年新国都毛利率(分业务)
图:2014-2015年新国都毛利率(分区域)
图:2009-2015年新国都研发支出及同比增长
表:新国都主要金融POS终端
表:2014-2016年新国都POS机产品产能、产量、产能利用率、销量和库存量
表:2014-2016年新大陆POS机分产品类型产销情况
图:新国都战略规划
图:2015-2020年新国都营业收入及同比增长
图:新大陆三大主营业务
表:新大陆主要子公司
图:2009-2016年新大陆营业收入及同比增长
图:2009-2016年新大陆净利润及同比增长
表:2009-2015年新大陆营收构成(分业务)
图:2009-2015年新大陆营收构成(分区域)
图:2009-2015新大陆毛利率(分业务)
图:2010-2015新大陆毛利率(分区域)
图:2010-2015新大陆研发支出,同比增长及其占营业收入的比例
表:2009-2016年新大陆POS终端业务发展历程
表:新大陆主要POS终端
图:新大陆对国通星驿、国通世纪、新大陆支付股权结构
表:新大陆商户服务系统与网络建设项目投资计划
表:新大陆POS 终端推广计划
图:2015-2020年新大陆营业收入及同比增长
图:2009-2016年证通电子营业收入及同比增长
图:2009-2016年证通电子净利润及同比增长
图:2009-2015年证通电子营收构成(分业务)
图:2009-2015年证通电子营收构成(分区域)
图:2009-2015年证通电子毛利率(分业务)
图:2009-2015年证通电子毛利率(分区域)
图:2009-2015年证通电子研发支出、同比增长及其占营业收入比例
表:证通电子主要POS终端
表:证通电子POS业务募投项目
图:2009-2015年证通电子POS终端销量
图:2015-2020年证通电子营业收入及同比增长
图:华智融销售网点分布
图:华智融主要客户
表:华智融主要POS产品
图:2011-2015年华智融POS终端销量
图:2009-2015年虹堡科技营业收入及同比增长
图:2009-2015年虹堡科技净利润及同比增长
图:2010-2015年虹堡科技营收构成(分产品)
图:2010-2015年虹堡科技营收构成(分区域)
图:2009-2015年虹堡科技毛利、同比增长及毛利率
表:虹堡科技POS终端研发历程
图:2009-2015年虹堡科技研发支出、同比增长及其占营业收入比例
图:2010-2015年虹堡科技POS终端销量、销售收入及平均单价
图:2015-2020年虹堡科技营业收入及同比增长
图:2009-2016年信雅达营业收入及同比增长
图:2009-2016年信雅达净利润及同比增长
图:2009-2015年信雅达营收构成(分业务)
图:2009-2015年信雅达营收构成(分区域)
图:2009-2015年信雅达毛利率(分业务)
图:2009-2015年信雅达研发支出及其占营业收入比例
表:信雅达主要POS终端
图:2009-2020年全球和中国POS终端出货量对比
图:2010-2020年全球和中国POS终端出货量增速对比
图:2010-2020年中国POS终端出货量在全球中占比
表:2009-2015年全球及中国主要公司POS终端销量对比
表:2010-2015年全球及中国主要公司POS终端销量增速对比
表:2009-2015年全球及中国主要公司POS终端市场份额
表:2009-2015年全球及中国POS终端行业上市公司营业收入对比
图:2010-2015年全球及中国POS终端行业上市公司营业收入增速对比
表:2009-2015年全球及中国POS终端行业上市公司净利润对比
表:2010-2015年全球及中国POS终端行业上市公司净利润增速对比
表:2009-2015年全球及中国POS终端行业上市公司毛利对比
表:2009-2015年全球及中国POS终端行业上市公司毛利率对比
图:2009-2015年全球及中国POS终端行业上市公司研发支出对比
图:2009-2015年全球及中国POS终端行业上市公司研发支出占营业收入比例对比
Classification, Advantages & Disadvantages of Financial POS Terminal
Comparison of Offline Mobile Payments
Imagpay Breakdown Products and Characteristics
Product Characteristics of Major Imagpay Manufacturers in China
Bankcard Consumer Value Chain on POS Terminal
Process of General Bankcard E-Payment Transaction
Global and China POS Transaction-related Business and Institutions Involved
Bankcard Swipe Fees in China Paid by Merchants (by Card Issuing Banks, Acquirers, Clearing Organizations)
Changes in Charging Body and Execution Rate for Bankcard Charges under the New Deal, 2016
Global Bankcard Issuance by Bankcard Brand, 2012-2015
Global Bankcard Consumption Transaction Volume, 2012-2015
Global Bankcard Consumption Transaction Volume by Major Brand, 2015
Bankcard Issuance Volume (Payment Function) in CPSS Countries, 2010-2014
Bankcard Issuance Volume (Payment Function) Growth in CPSS Countries, 2010-2014
Bankcard Consumption Transaction Volume in CPSS Countries, 2010-2014
Bankcard Consumption Transaction Value in CPSS Countries, 2010-2014
Growth in Bankcard Consumption Transaction Volume in CPSS Countries, 2010-2014
Growth in Bankcard Consumption Transaction Value in CPSS Countries, 2010-2014
Global POS Terminal Shipments and YoY Growth, 2007-2020E
Global NFC-enabled POS Terminal Shipments and YoY Growth, 2010-2020E
Global Top10 Manufacturers by POS Terminal Shipments and Their Market Share, 2014-2015
Number of POS Terminals in CPSS Countries, 2010-2014
YoY Growth in Number of POS Terminals in CPSS Countries, 2010-2014
Number of POS Terminals per Million People in CPSS Countries, 2010-2014
Development History and Characteristics of POS Terminal in China
Number of Merchants Joining the UnionPay Network in China and YoY Growth, 2007-2020E
Number of New Merchants Joining the UnionPay Network in China and YoY Growth, 2007-2020E
Number of POS Terminals Joined the UnionPay Network in China and YoY Growth, 2007-2020E
Number of New POS Terminals Joined the UnionPay Network in China and YoY Growth, 2007-2020E
Number of Bankcards for Every POS Terminal in China, 2007-2020E
POS Terminal Ownership per Thousand People in China, 2007-2020E
China's POS Terminal Shipments and YoY Growth, 2009-2020E
China's Top10 Manufacturers by POS Terminal Shipments, 2014-2015
China's POS Terminal Import Volume and YoY Growth, 2010-2016
China's POS Terminal Import Value and YoY Growth, 2010-2016
China's POS Terminal Export Volume and YoY Growth, 2010-2016
China's POS Terminal Export Value and YoY Growth, 2010-2016
Non-Cash Payment Instruments
China's Non-cash Payment Transaction Volume and YoY Growth, 2007-2020E
China's Non-cash Payment Structure by Transaction Volume, 2007-2020E
China's Non-cash Payment Transaction Value and YoY Growth, 2007-2020E
China's Non-cash Payment Structure by Transaction Value, 2007-2020E
Average Transaction Value of Each Non-cash Payment in China, 2007-2020E
China's Cumulative Bankcard Issuance and YoY Growth, 2007-2020E
China's Debit Card and Credit Card Issuance, 2007-2020E
Acceptance Environment Improvement and Issuance Schedule of Financial IC Card in China, 2011-2015
China's Bankcard and Financial IC Card Issuance, 2010-2020E
China's Bankcard Payment Transaction Volume and YoY Growth, 2007-2020E
China's Bankcard Payment Structure by Transaction Volume, 2007-2020E
China's Bankcard Payment Transaction Value and YoY Growth, 2007-2020E
China's Bankcard Payment Structure by Transaction Value, 2007-2020E
Average Transaction Value of Each Bankcard Payment, 2007-2020E
Number of Institutions Getting Third-party Payment License by Category as of Aug. 2016
Internet Payment and Mobile Payment Transaction Volume Provided by China's Banking Institutions, 2012-2020E
Internet Payment and Mobile Payment Transaction Value Provided by China's Banking Institutions, 2012-2020E
Average Transaction Value of Each Internet Payment and Mobile Payment Provided by China's Banking Institutions, 2012-2020E
Internet Payment and Mobile Payment Transaction Volume Provided by Third-party Payment Institutions in China, 2012-2020E
Internet Payment and Mobile Payment Transaction Value Provided by Third-party Payment Institutions in China, 2012-2020E
Average Transaction Value of Each Internet Payment and Mobile Payment Provided by Third-party Payment Institutions in China, 2012-2020E
Models of POS Acquiring
POS Terminal Transaction Volume and YoY Growth in China, 2007-2020E
POS Terminal Transaction Value and YoY Growth in China, 2007-2020E
Average Value of Each Transaction via POS Terminal in China, 2007-2020E
POS Acquiring Charges in China, 2007-2020E
Major Institutions and Their Share in Chinese POS Acquiring Market, 2013-2015
Number of Merchants Served by, YoY Growth and Market Share of China UMS, 2007-2016
Number of POS Terminals Maintained by, YoY Growth and Market Share of China UMS, 2007-2016
Ingenico’s Employees (by Country), 2013-2014
Ingenico’s Revenue and YoY Growth, 2009-2016
Ingenico’s Net Income and YoY Growth, 2009-2015
Ingenico’s Revenue Structure (by Business), 2010-2016
Ingenico’s Revenue Structure (by Region), 2015-2016
Ingenico’s Gross Profit, YoY Growth and Gross Margin, 2009-2015
Ingenico’s R&D Costs, YoY Growth and % of Total Revenue, 2009-2015
Ingenico’s Main POS Terminals and Characteristics
Ingenico’s POS Terminal Sales Volume Worldwide, 2009-2015
Ingenico’s Subsidiaries in China
Ingenico’s Strategy Implementation Progress, 2015
Ingenico’s Revenue and YoY Growth, 2015-2020E
VeriFone’s Subsidiaries
VeriFone’s Revenue and YoY Growth, FY2009-FY2016
VeriFone’s Net Income and YoY Growth, FY2009-FY2016
VeriFone’s Revenue Structure (by Product), FY2009-FY2016
VeriFone’s Revenue Structure (by Region), FY2009-FY2016
VeriFone’s Gross Profit, YoY Growth and Gross Margin, FY2009-FY2016
VeriFone’s Gross Margin (by Business), FY2009-FY2016
VeriFone’s R&D Costs and YoY Growth, FY2009-FY2016
VeriFone’s POS Terminal Sales Volume Worldwide, 2009-2015
VeriFone’s Revenue and YoY Growth, FY2015-FY2020E
Cybernet’s POS Terminal Sales Volume Worldwide and YoY Growth, 2009-2015
Bitel’s Main Products and Parameters
Bitel’s POS Terminal Sales Volume Worldwide and YoY Growth, 2009-2015
First Data’s Revenue and YoY Growth, 2009-2016
First Data’s Net Income, 2009-2016
First Data’s Revenue Structure (by Business), 2012-2015
LANDI Commercial Equipment’s POS Terminal Sales Volume and YoY Growth, 2009-2018E
LANDI Commercial Equipment’s Main POS Terminals and Characteristics
PAX Global’s Revenue and YoY Growth, 2009-2015
PAX Global’s Net Income and YoY Growth, 2009-2015
PAX Global’s Revenue Structure (by Product), 2008-2015
PAX Global’s Revenue Structure (by Region), 2009-2015
PAX Global’s Recent POS Terminal Business Expansion in Primary Regions
PAX Global’s Gross Profit, YoY Growth and Gross Margin, 2009-2015
PAX Global’s R&D Costs, YoY Growth and % of Total Revenue, 2008-2015
PAX Global’s Main POS Terminals and Characteristics
PAX Global’s POS Terminal Sales Volume, Sales and AUP, 2009-2015
PAX Global’s Revenue and YoY Growth, 2015-2020E
Revenue and Net Income of Xinguodu’s Major Subsidiaries, 2013-2015
Xinguodu’s Revenue and YoY Growth, 2009-2016
Xinguodu’s Net Income and YoY Growth, 2009-2016
Xinguodu’s Revenue Structure (by Business), 2009-2015
Xinguodu’s Revenue Structure (by Region), 2014-2015
Xinguodu’s Gross Margin (by Business), 2009-2015
Xinguodu’s Gross Margin (by Region), 2014-2015
Xinguodu’s R&D Costs and YoY Growth, 2009-2015
Xinguodu’s Main Financial POS Terminals
Capacity, Output, Capacity Utilization, Sales Volume and Inventory of Xinguodu’s POS Terminals, 2014-2016
Production and Marketing of Xinguodu’s POS Terminals by Product Type, 2014-2016
Xinguodu’s Strategic Planning
Xinguodu’s Revenue and YoY Growth, 2015-2020E
Newland’s Three Main Businesses
Newland’s Major Subsidiaries
Newland’s Revenue and YoY Growth, 2009-2016
Newland’s Net Income and YoY Growth, 2009-2016
Newland’s Revenue Structure (by Business), 2009-2015
Newland’s Revenue Structure (by Region), 2009-2015
Newland’s Gross Margin (by Business), 2009-2015
Newland’s Gross Margin (by Region), 2010-2015
Newland’s R&D Costs, YoY Growth and % of Total Revenue, 2010-2015
Development History of Newland’s POS Terminal Business, 2009-2016
Newland’s Main POS Terminals
Newland’s Ownership Structure in POSTAR, Gomtel and Newland Payment Technology
Newland’s Merchant Service System and Network Construction Project Investment Plan
Newland’s POS Terminal Promotion Plan
Newland’s Revenue and YoY Growth, 2015-2020E
SZZT Electronics’ Revenue and YoY Growth, 2009-2016
SZZT Electronics’ Net Income and YoY Growth, 2009-2016
SZZT Electronics’ Revenue Structure (by Business), 2009-2015
SZZT Electronics’ Revenue Structure (by Region), 2009-2015
SZZT Electronics’ Gross Margin (by Business), 2009-2015
SZZT Electronics’ Gross Margin (by Region), 2009-2015
SZZT Electronics’ R&D Costs, YoY Growth and % of Total Revenue, 2009-2015
SZZT Electronics’ Main POS Terminals
SZZT Electronics’ POS Fund-raising Projects
SZZT Electronics’ POS Terminal Sales Volume, 2009-2015
SZZT Electronics’ Revenue and YoY Growth, 2015-2020E
Distribution of New POS Technology’s Sales Outlets
New POS Technology’s Major Customers
New POS Technology’s Main POS Products
New POS Technology’s POS Terminal Sales Volume, 2011-2015
Castles Technology’s Revenue and YoY Growth, 2009-2015
Castles Technology’s Net Income and YoY Growth, 2009-2015
Castles Technology’s Revenue Structure (by Product), 2010-2015
Castles Technology’s Revenue Structure (by Region), 2010-2015
Castles Technology’s Gross Profit, YoY Growth and Gross Margin, 2009-2015
Development Process of Castles Technology’s POS Terminals
Castles Technology’s R&D Costs, YoY Growth and % of Total Revenue, 2009-2015
Castles Technology’s POS Terminal Sales Volume, Sales and AUP, 2010-2015
Castles Technology’s Revenue and YoY Growth, 2015-2020E
Sunyard’s Revenue and YoY Growth, 2009-2016
Sunyard’s Net Income and YoY Growth, 2009-2016
Sunyard’s Revenue Structure (by Business), 2009-2015
Sunyard’s Revenue Structure (by Region), 2009-2015
Sunyard’s Gross Margin (by Business), 2009-2015
Sunyard’s R&D Costs and % of Total Revenue, 2009-2015
Sunyard’s Main POS Terminals
Comparison of Global and China’s POS Terminal Shipments, 2009-2020
Comparison of Global and China’s POS Terminal Shipment Growth, 2010-2020
China’s POS Terminal Shipments as a Percentage in the World, 2010-2020
Comparison of Global and Chinese Companies in POS Terminal Sales Volume, 2009-2015
Comparison of Global and Chinese Companies in POS Terminal Sales Volume Growth, 2010-2015
Comparison of Global and Chinese Companies in POS Terminal Market Share, 2009-2015
Comparison of Global and Chinese Listed POS Terminal Companies in Revenue, 2009-2015
Comparison of Global and Chinese Listed POS Terminal Companies in Revenue Growth, 2010-2015
Comparison of Global and Chinese Listed POS Terminal Companies in Net Income, 2009-2015
Comparison of Global and Chinese Listed POS Terminal Companies in Net Income Growth, 2010-2015
Comparison of Global and Chinese Listed POS Terminal Companies in Gross Profit, 2009-2015
Comparison of Global and Chinese Listed POS Terminal Companies in Gross Margin, 2009-2015
Comparison of Global and Chinese Listed POS Terminal Companies in R&D Costs, 2009-2015
Comparison of Global and Chinese Listed POS Terminal Companies in R&D Costs as a Percentage of Revenue, 2009-2015
如果这份报告不能满足您的要求,我们还可以为您定制报告,请 留言说明您的详细需求。
|