|
|
|
报告导航:研究报告—
制造业—汽车
|
|
2016-2018年全球和中国铅酸电池(起动电池、动力电池、储能电池、通信后备电源)行业研究报告 |
 |
字数:10.5万 |
页数:286 |
图表数:181 |
|
中文电子版:9000元 |
中文纸版:4500元 |
中文(电子+纸)版:9500元 |
|
英文电子版:2400美元 |
英文纸版:2600美元 |
英文(电子+纸)版:2700美元 |
|
编号:LT031
|
发布日期:2016-08 |
附件:下载 |
 |
|
|
铅酸蓄电池行业是典型的高耗能、高污染行业,生产过程中,电能消耗很高,也会带来铅尘、铅烟、酸性含铅废水、酸雾、废渣等排放。全球铅酸蓄电池生产重心由发达国家不断转移至发展中国家。中国占全球铅酸电池产量比重,已从2010年的35%上升至2015年42%,中国铅酸电池产业发展情况对全球具有重大影响。
2015年全球铅酸蓄电池需求为49482万KVA,同比增长3.5%,中国需求增速放缓,全球除中国以外地区保持2-3%左右的平均增幅。随着2015年以来,中国加强了对铅酸电池的环保整顿,以及锂电池对铅酸电池的替代效应,预计未来全球铅酸电池增速将随同中国一起走低,预计未来全球铅酸电池需求增速将稳定在2-3%之间。
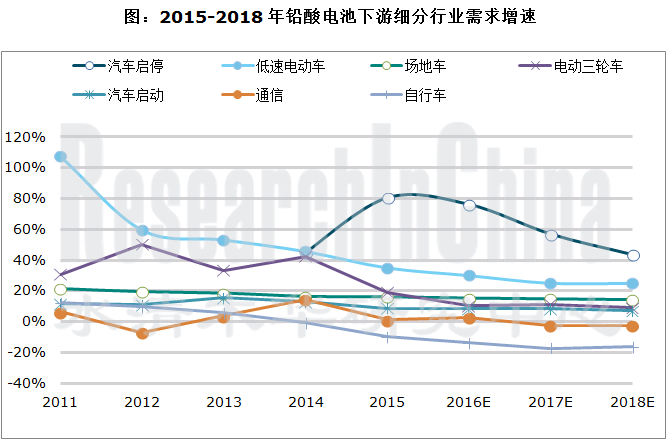
2015年中国铅酸蓄电池需求量下滑7.3%,达到19621.4万KVAh,销售收入下滑4.9%,达到1470亿元。从2015年各主要业务模块需求量增速来看,电动自行车用铅酸电池的增长速度为-11.8%,汽车用起动铅酸电池的增速为8.3%,电动三轮车和低速电动车用电池增速分别为21.6%和35%,通信用电池的增长速度为1%左右。
2015年以来,受锂电替代效应的影响,电动自行车用铅酸电池下滑迅速;受上有需求不振影响,汽车起动用、电动三轮车用铅酸电池增速也明显放缓。此外,由于2015年是清理过剩产能和污染严重产能的大限年,大量小规模铅酸电池生产企业拿不到国家的准入资格,纷纷停产整顿,或转入地下生产,使得行业表观增速进一步放缓。
从生产企业来看,江森自控是全球最大的铅酸电池企业,2015年市场份额为15.7%。尽管如此,江森自控的市场份额正在不断下降,2010年其市场份额高达26%。随着各大企业产能的不断增加,市场龙头优势正在减弱。与此同时,随着中国落后产能淘汰,小规模企业的市场空间不断缩小;受锂电、光伏等新兴市场吸引,一部分企业(如松下)正在减弱铅酸电池的投入。
从应用领域来看,铅酸蓄电池广泛应用于交通运输、通讯、电力、铁路等行业,其中起动电池(汽车、摩托车等)、动力电池(电动自行车、电动三轮车、低速电动车、场地/特种电动车等)、通信后备电源三类约占消费总量的90%。
从细分领域需求来看,行业未来几年,汽车启停电池、铅炭储能电池有望保持30-40%的复合增速,低速电动车电池有望保持25-30%的复合增速,电动三轮车、场地/特殊用途电动车电池有望保持10-15%左右的增速,汽车起动电池需求增速则会下滑至9%以内。
目前来看,通信后备电源、储能、电动自行车用铅酸电池短期内受锂电池冲击最大,预计未来几年,通信后备电源铅酸电池应用将出现小幅萎缩趋势,电动自行车铅酸电池将会出现年均15%以上的负增长。
水清木华研究中心《2016-2018年全球和中国铅酸电池行业研究报告》着重研究了以下内容:
 全球和中国铅酸电池发展现状,行业政策,未来技术发展方向; 全球和中国铅酸电池发展现状,行业政策,未来技术发展方向;
全球和中国铅酸电池产业规模、需求量、进出口、竞争格局,以及未来几年需求预测;
铅酸电池所面临的几种竞争产品分析,主要包括锂电池、镍氢电池、铅炭电池的技术对比、应用领域对比、成本对比、出货量及趋势对比、以及市场主要参与者对比;
铅酸电池下游应用行业分析,涵盖汽车、后备电源与储能、电动自行车、电动三轮车、低速电动车、场地/特殊用途电动车等多个应用领域,详尽分析了各细分领域发展现状。对铅酸电池的需求量,以及该细分领域铅酸电池的主要参与厂商市场份额;
全球5家铅酸电池厂商经营、技术、客户、发展规划及产销动态;
中国10家铅酸电池厂商经营、技术、客户、发展规划及产销动态。
Lead-acid battery industry is a typical one of high energy consumption and heavy pollution. A large amount of electricity is consumed and pollutants such as lead dust/fume, acidic leaded wastewater, acid fog, and waste residues are discharged during the process of production. The center of global lead-acid battery production continues to transfer from developed countries to developing nations. As China’s share of global lead-acid battery output has risen from 35% in 2010 to 42% in 2015, the country’s development of lead-acid battery industry is of great significance to the world.
Global lead-acid battery demand amounted to 494.82 million KVAh in 2015, up 3.5% from a year ago, with China seeing a slowdown in demand growth rate and the rest of the world maintaining average growth rate of around 2%-3%. With enhanced efforts by the Chinese government to regulate lead-acid battery industry in the aspect of environmental protection since 2015 and the effect of lithium battery replacing lead-acid battery, global lead-acid battery demand growth is expected to fall along with that in China in the future, stabilizing at 2%-3%.
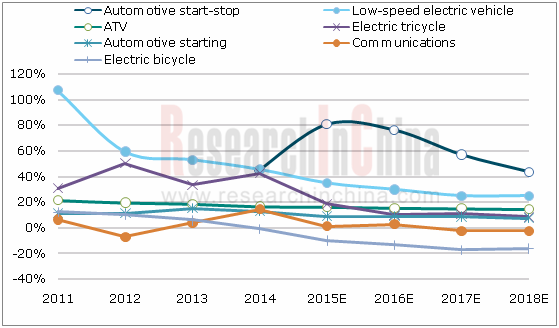
China’s demand for lead-acid battery dropped by 7.3% to 196.214 million KVAh and lead-acid battery revenue fell 4.9% to RMB147 billion in 2015. The demand for the lead-acid battery for electric bicycle increased by -11.8%, the lead-acid battery for automotive starting 8.3%, the lead-acid battery for electric tricycle 21.6% and low-speed electric vehicle 35%, and the lead-acid battery for communications around 1%.
Since 2015, affected by the effect of lithium battery substitution, the demand for the lead-acid battery for electric bicycle has dropped quickly; sluggish demand from upstream sectors resulted in significantly slower growth in demand for the lead-acid battery for automotive starting and electric tricycle. In addition, as the year 2015 is the deadline for cleaning up excess capacity and the capacity causing severe pollution, a large number of small lead-acid battery producers can’t get access permits, and have to stop production for rectification or produce secretively, leading to further slower apparent growth rate.
Johnson Controls is the world’s largest lead-acid battery producer with a 15.7% market share in 2015. In spite of this, the company is suffering a sustained decline in market share from as high as 26% in 2010. As companies continue to expand capacity, the advantage of market leader is waning. Meanwhile, as China pursues the elimination of outdated capacity, the market space for small companies keeps narrowing. Attracted by emerging markets (lithium battery and PV), some companies (like Panasonic) reduces investment in lead-acid battery.
Lead-acid battery finds wide applications in transportation, communications, power, and railway industries. Starting battery (automobile, motorcycle), power battery (electric bicycle, electric tricycle, low-speed electric vehicle, ATV/special-purpose electric vehicle), and communications back-up power hold a combined 90% share of total lead-acid battery consumption.
Over the next couple years, the demand for the automotive start-stop battery and Pb-C energy storage battery is expected to grow at a compound annual rate of 30%-40%, the battery for low-speed electric vehicle 25%-30%, the battery for electric tricycle and ATV/special-purpose electric vehicle around 10%-15%, and automotive starting battery within 9%.
For now, the lead-acid battery for communications back-up power, energy storage, and electric bicycle will be hardest hit by lithium battery in the short term. It is expected the application of lead-acid battery in communications back-up power will shrink slightly and the demand for the lead-acid battery for electric bicycle will see a negative annual growth of above 15% over the next few years.
Growth Rates of Demand for Lead-acid Battery from Downstream Industry Segments, 2011-2018E
The report focuses on the followings:
 Global and China’s lead-acid battery industry (status quo of development, industrial policies, orientation of technological development); Global and China’s lead-acid battery industry (status quo of development, industrial policies, orientation of technological development);
Global and China’s lead-acid battery industry (industry size, demand, import & export, competition pattern, demand forecast for the next few years);
Competitive products (lithium battery, NI-MH battery, Pb-C battery) faced by lead-acid battery (comparison of technologies, applications, costs, shipments & trends, and major market participants);
Application industries of lead-acid battery, covering automobile, back-up power & energy storage, electric bicycle, electric tricycle, low-speed electric vehicle, and ATV/special-purpose electric vehicle (status quo of development, demand for lead-acid battery, and market share of major lead-acid battery participants in the segments);
5 global lead-acid battery players (operation, technologies, customers, development planning, and output & sales);
10 Chinese lead-acid battery companies (operation, technologies, customers, development planning, and output & sales).
第一章 铅酸电池行业概述
1.1 定义及分类
1.1.1定义
1.1.2分类
1.1.3用途
1.2 产业链分析
1.3 行业特点
第二章 全球铅酸电池行业发展概况
2.1 全球铅酸电池政策环境和趋势分析
2.2全球铅酸电池需求和市场规模分析
2.3全球铅酸电池区域竞争格局分析
2.4全球铅酸电池企业竞争格局分析
第三章 中国铅酸电池行业发展现状
3.1 中国铅酸电池政策环境分析
3.2中国铅酸电池需求和市场规模分析
3.3中国铅酸电池区域竞争格局分析
3.4中国铅酸电池企业竞争格局分析
3.5中国铅酸电池市场需求预测
第四章 替代产品市场对比分析
4.1 锂离子电池
4.1.1锂离子电池技术对比
4.1.2锂离子电池价格对比
4.1.3锂离子电池应用领域对比
4.1.4全球及中国锂电池出货量及需求
4.1.5全球及中国锂离子电池主要参与者
4.2 镍氢电池
4.2.1 镍氢电池技术对比
4.2.2 镍氢应用领域对比
4.2.3全球及中国镍氢电池市场市场规模
4.2.4全球镍氢电池主要参与者
4.3 镍镉电池
4.3.1 技术对比
4.3.2 应用领域对比
4.3.3 价格对比
4.4 铅炭电池
4.4.1 技术对比
4.4.2 应用领域对比
4.4.3 价格对比
4.5 燃料电池
4.5.1 技术对比
4.5.2 应用领域对比
4.5.3 价格对比
4.6 综合对比
第五章 上下游应用行业发展概述
5.1 上游应用材料
5.1.1 铅冶炼行业
5.1.2 硫酸制造行业
5.2 汽车行业
5.2.1汽车产销及铅酸电池需求
5.2.2汽车起动/启停用铅酸电池主要企业竞争格局分析
5.3 后备与储能(固定式)
5.3.1电力储能技术及应用
5.3.2电力化学储能行业规模及铅酸电池需求
5.3.3通信后备电源行业及铅酸电池需求
5.3.4后备与储能用铅酸电池竞争格局分析
5.3.5后备与储能用铅酸电池未来发展趋势分析
5.4 电动自行车/三轮车行业
5.4.1中国电动自行车产量及市场规模
5.4.2中国电动自行车铅酸电池需求
5.4.3电动自行车铅酸电池竞争格局分析
5.4.4中国电动三轮车产量及市场规模
5.4.5中国电动三轮车铅酸电池需求
5.4.6电动三轮车铅酸电池竞争格局分析
5.5低速电动车行业
5.5.1中国低速电动车产量及市场规模
5.5.2中国低速电动车铅酸电池需求
5.5.3低速电动车铅酸电池竞争格局分析
5.6场地/特殊用途车
5.6.1中国场地/特殊用途车产量
5.6.2中国场地/特殊用途车铅酸电池需求
第六章 中国铅酸电池主要企业分析
6.1 Johnson Controls
6.1.1 公司简介
6.1.2 基本经营情况
6.1.3 项目及产能情况
6.1.4 企业主要产品及客户
6.1.5 企业核心竞争力分析
6.1.6 技术发展方向
6.2 Exide Technologies
6.2.1 公司简介
6.2.2 基本经营情况
6.2.3 生产基地布局
6.2.4 企业主要产品及客户
6.2.5 德国阳光
6.2.6 企业核心竞争力分析
6.2.7 技术发展方向
6.3 GS Yuasa
6.3.1 公司简介
6.3.2 基本经营情况
6.3.3 项目及产能情况
6.3.4 企业主要产品及客户
6.3.5 企业核心竞争力分析
6.3.6 技术发展方向
6.4 C&D
6.4.1 公司简介
6.4.2 项目及产能情况
6.4.3 企业主要产品及客户
6.4.4 企业核心竞争力分析
6.4.5 技术发展方向
6.5 HOPPECK
6.5.1 公司简介
6.5.2 基本经营情况
6.5.3 主要项目
6.5.4 企业主要产品及客户
6.5.5 企业核心竞争力分析
6.6 PANASONIC
6.6.1 公司简介
6.6.2 基本经营情况
6.6.3 业务布局
6.6.4 企业主要产品及客户
6.6.5 企业核心竞争力分析
6.6.6 技术发展方向
6.7 天能动力
6.7.1 公司简介
6.7.2 基本经营情况
6.7.3 项目及产能情况
6.7.4 企业主要产品及客户
6.7.5 企业核心竞争力分析
6.7.6 技术发展方向
6.8 超威动力
6.8.1 公司简介
6.8.2 基本经营情况
6.8.3 项目及产能情况
6.8.4 企业主要产品及客户
6.8.5 企业核心竞争力分析
6.8.6 技术发展方向
6.9骆驼股份
6.9.1 公司简介
6.9.2 基本经营情况
6.9.3 项目及产能情况
6.9.4 企业主要产品及客户
6.9.5 企业核心竞争力分析
6.9.6 技术发展方向
6.10中国动力
6.10.1 公司简介
6.10.2 基本经营情况
6.10.3 项目及产能情况
6.10.4 企业主要产品及客户
6.10.5 企业核心竞争力分析
6.10.6 技术发展方向
6.11圣阳股份
6.11.1 公司简介
6.11.2 基本经营情况
6.11.3 项目及产能情况
6.11.4 企业主要产品及客户
6.11.5 企业核心竞争力及技术发展方向
6.12南都电源
6.12.1 公司简介
6.12.2 基本经营情况
6.12.3 项目及产能情况
6.12.4 企业主要产品及客户
6.12.5 企业核心竞争力及技术发展方向
6.13 雄韬股份
6.13.1 公司简介
6.13.2 基本经营情况
6.13.3 项目及产能情况
6.13.4 企业主要产品及客户
6.13.5 企业核心竞争力分析
6.13.6 技术发展方向
6.14猛狮科技
6.14.1 公司简介
6.14.2 基本经营情况
6.14.3 项目及产能情况
6.14.4 企业主要产品及客户
6.14.5 企业核心竞争力分析
6.14.6 技术发展方向
6.15 双登集团
6.15.1 公司简介
6.15.2 基本经营情况
6.15.3 项目及产能情况
6.15.4 企业主要产品及客户
6.15.5企业核心竞争力分析
6.15.6 技术发展方向
6.16 理士国际
6.16.1 公司简介
6.16.2 基本经营情况
6.16.3 项目及产能情况
6.16.4 企业主要产品及客户
6.16.5 企业核心竞争力分析
6.16.6 技术发展方向
1. Overview of Lead-acid Battery Industry
1.1 Definition and Classification
1.1.1 Definition
1.1.2 Classification
1.1.3 Purpose
1.2 Industry Chain
1.3 Industry Characteristics
2. Development of Global Lead-acid Battery Industry
2.1 Policy Environment and Trend Analysis
2.2 Demand and Market Size
2.3 Regional Competition Pattern
2.4 Pattern of Competition among Enterprises
3. Development of Lead-acid Battery Industry in China
3.1 Policy Environment
3.2 Demand and Market Size
3.3 Regional Competition Pattern
3.4 Pattern of Competition among Enterprises
3.5 Demand Forecast
4. Substitute Products Market
4.1 Lithium-ion Battery
4.1.1 Technology
4.1.2 Price
4.1.3 Applications
4.1.4 Global and China’s Shipments and Demand
4.1.5 Major Global and Chinese Participants
4.2 Ni-MH Battery
4.2.1 Technology
4.2.2 Applications
4.2.3 Global and Chinese Market Size
4.2.4 Major Global Participants
4.3 Ni-Cd Battery
4.3.1 Technology
4.3.2 Applications
4.3.3 Price
4.4 Pb-C Battery
4.4.1 Technology
4.4.2 Applications
4.4.3 Price
4.5 Fuel Cell
4.5.1 Technology
4.5.2 Applications
4.5.3 Price
4.6 Comprehensive Comparison
5. Development of Upstream and Downstream Applications
5.1 Upstream Applied Materials
5.1.1 Lead Smelting Industry
5.1.2 Sulfuric Acid Production Industry
5.2 Automobile Industry
5.2.1 Automotive Output & Sales and Demand for Lead-acid Battery
5.2.2 Pattern of Competition among Automotive Start-Stop Lead-acid Battery Companies
5.3 Back-up and Energy Storage (Fixed)
5.3.1 Power Energy Storage Technology and Application
5.3.2 Power Chemical Energy Storage Industry Size and Demand for Lead-acid Battery
5.3.3 Communications Back-up Battery Industry and Demand for Lead-acid Battery
5.3.4 Competition Pattern of Market for Back-up and Energy Storage Lead-acid Battery
5.3.5 Future Development Trends of Back-up and Energy Storage Lead-acid Battery
5.4 Electric Bicycle and Tricycle Industry
5.4.1 Electric Bicycle Output and Market Size
5.4.2 Demand for Lead-acid Battery from Electric Bicycle in China
5.4.3 Competition Pattern of Lead-acid Battery for Electric Bicycle
5.4.4 Electric Tricycle Output and Market Size
5.4.5 Demand for Lead-acid Battery from Electric Tricycle in China
5.4.6 Competitive Pattern of Lead-acid Battery for Electric Tricycle
5.5 Low-speed Electric Vehicle Industry
5.5.1 Low-speed Electric Vehicle Output and Market Size
5.5.2 Demand for Lead-acid Battery from Low-speed Electric Vehicle in China
5.5.3 Competition Pattern of Lead-acid Battery for Low-speed Electric Vehicle
5.6 ATV/Special-purpose Vehicle
5.6.1 ATV/Special-purpose Vehicle Output in China
5.6.2 Demand for Lead-acid Battery from ATV/Special-purpose Vehicle in China
6. Major Players in China
6.1 Johnson Controls
6.1.1 Profile
6.1.2 Operation
6.1.3 Project and Capacity
6.1.4 Main Products and Customers
6.1.5 Core Competitiveness
6.1.6 Technology Development
6.2 Exide Technologies
6.2.1 Profile
6.2.2 Operation
6.2.3 Production Bases
6.2.4 Main Products and Customers
6.2.5 Sonnenlicht
6.2.6 Core Competitiveness
6.2.7 Technology Development
6.3 GS Yuasa
6.3.1 Profile
6.3.2 Operation
6.3.3 Project and Capacity
6.3.4 Main Products and Customers
6.3.5 Core Competitiveness
6.3.6 Technology Development
6.4 C&D
6.4.1 Profile
6.4.2 Project and Capacity
6.4.3 Main Products and Customers
6.4.4 Core Competitiveness
6.4.5 Technology Development
6.5 HOPPECK
6.5.1 Profile
6.5.2 Operation
6.5.3 Main Projects
6.5.4 Main Products and Customers
6.5.5 Core Competitiveness
6.6 PANASONIC
6.6.1 Profile
6.6.2 Operation
6.6.3 Business Layout
6.6.4 Main Products and Customers
6.6.5 Core Competitiveness
6.6.6 Technology Development
6.7 Tianneng Power
6.7.1 Profile
6.7.2 Operation
6.7.3 Project and Capacity
6.7.4 Main Products and Customers
6.7.5 Core Competitiveness
6.7.6 Technology Development
6.8 Chaowei Power
6.8.1 Profile
6.8.2 Operation
6.8.3 Project and Capacity
6.8.4 Main Products and Customers
6.8.5 Core Competitiveness
6.8.6 Technology Development
6.9 Camel Group
6.9.1 Profile
6.9.2 Operation
6.9.3 Project and Capacity
6.9.4 Main Products and Customers
6.9.5 Core Competitiveness
6.9.6 Technology Development
6.10 China Shipbuilding Industry Group Power Co., Ltd.
6.10.1 Profile
6.10.2 Operation
6.10.3 Project and Capacity
6.10.4 Main Products and Customers
6.10.5 Core Competitiveness
6.10.6 Technology Development
6.11 Shandong Sacred Sun Power Sources Co., Ltd.
6.11.1 Profile
6.11.2 Operation
6.11.3 Project and Capacity
6.11.4 Main Products and Customers
6.11.5 Core Competitiveness and Technology Development
6.12 Zhejiang Narada Power Source Co., Ltd.
6.12.1 Profile
6.12.2 Operation
6.12.3 Project and Capacity
6.12.4 Main Products and Customers
6.12.5 Core Competitiveness and Technology Development
6.13 Vision Group
6.13.1 Profile
6.13.2 Operation
6.13.3 Project and Capacity
6.13.4 Main Products and Customers
6.13.5 Core Competitiveness
6.13.6 Technology Development
6.14 Dynavolt Renewable Energy Technology Co., Ltd.
6.14.1 Profile
6.14.2 Operation
6.14.3 Project and Capacity
6.14.4 Main Products and Customers
6.14.5 Core Competitiveness
6.14.6 Technology Development
6.15 Shuangdeng Group
6.15.1 Profile
6.15.2 Operation
6.15.3 Project and Capacity
6.15.4 Main Products and Customers
6.15.5 Core Competitiveness
6.15.6 Technology Development
6.16 Leoch International Technology Ltd.
6.16.1 Profile
6.16.2 Operation
6.16.3 Project and Capacity
6.16.4 Main Products and Customers
6.16.5 Core Competitiveness
6.16.6 Technology Development
图:电池分类
图:铅酸蓄电池化学原理图
表:铅酸蓄电池按用途分类
表:2014年中国铅酸电池行业不同应用领域(按按需求量)份额
图:铅酸电池内部材料成本占比
图:2010-2018年全球铅酸电池需求分析
图:2010-2018年全球铅酸电池市场规模分析
图:全球电池市场规模分析
图:2014年全球铅酸电池区域竞争格局分析
图:2014年全球铅酸电池企业TOP10
表:2010-2014年中国铅酸电池行业政策
表:2010-2015H1中国铅酸电池市场需求量分析
表:2010-2015年上半年中国铅酸电池市场规模分析
表:2012-2015H1中国主要省份铅酸电池产量
表:2014年中国淘汰铅酸电池落后产能统计
表:2014年中国主要铅酸蓄电池企业收入
表:2014年汽车起动用铅酸蓄电池前十大出口企业
表:2014年汽车起动用铅酸蓄电池前十大出口目的地
表:2014年密封铅酸蓄电池前十大出口企业
表:2014年密封铅酸蓄电池前十大出口国家和地区
表:2010-2018年中国铅酸电池行业需求量
表:2010-2018年中国铅酸电池行业(分应用领域)需求量测算表
表:2014年中国铅酸电池行业不同应用领域(按需求量)份额
表:2010-2018年中国铅酸电池行业规模
表:2010-2018年中国铅酸电池行业(分应用领域)行业规模测算表
图:锂电池成本结构
表:铅酸和锂离子电池技术指标对比
图:2011-2018年中国磷酸铁锂电池价格趋势
图:全球电动汽车动力锂电池价格趋势
表:2015年电动自行车主要电池种类价格表
表:铅酸和锂电池应用领域对比
图:2010-2018年全球锂电池(分需求)出货量
图:2014年中国锂电池分应用领域份额
图:全球小型(消费级)锂电池企业市场份额
图:2014年全球新能源乘用车配套电池厂商份额
图:2015年各车型产量及电池产量
图:2015年上半年主力电池厂商市场份额
图:2015年上半年主力电池厂商出货量(MWh)
表:镍氢电池材料体系
表:铅酸和镍氢电池技术指标对比
图:2014年全球镍氢电池主要应用领域市场份额
表:铅酸和镍氢电池应用领域对比
图:2010-2015年全球小型镍氢电池市场出货量和规模
图:2010-2015年全球大型镍氢电池市场出货量和规模
图:2011-2015年中国镍氢电池市场市场规模
图:2014年全球小型镍氢电池企业市场份额
图:2009-2015年全球新能源汽车(EV/PHEV/HEV)销量
表:铅酸和镍镉电池技术指标对比
表:铅酸和镍镉电池应用领域对比
表:铅炭和铅酸电池技术性能指标对比
表:铅酸和铅炭电池储能技术的经济性对比
表:三种技术储能系统的特性比较
表:江苏省企业峰谷分时销售电价
表:不同电压等级峰谷电价差值
表:不同技术储能成本与节电收益
表:燃料电池分类
表:通信基站备用电源,燃料电池与铅酸电池技术优势对比(一)
表:通信基站备用电源,燃料电池与铅酸电池技术优势对比(二)
图:燃料电池热电联产项目能实现90%的能量效率
图:日本远景目标是燃料电池提供42%的家庭能源
表:Bloom Energy SOFC 系统经济性
表:燃料电池备用电源应用场景
图:Ballard燃料电池应急电源供应系统
表:Ballard对铅酸和燃料电池成本测算参数
图:全球主要汽车厂商燃料电池汽车发展路线图
图:燃料电池系统的成本分析
图:燃料电池系统产量和成本的关系
图:燃料电池系统零部件成本比例
表:各种电池性能对比
图:车用电池发展方向
图:铅酸蓄电池主要成分构成
图:2010-2015H1中国精炼铅产量
图:2010-2014年中国铅酸蓄电池产量
图:国内铅产量和再生铅产量
表:近两年全国硫酸产量前10名企业
图:2010-2018汽车产销、保有量和起动铅酸电池需求
图:2010-2018汽车起动铅酸电池行业规模
图:汽车启停系统原理图
图:2013-2018年中国汽车启停电池系统出货量及渗透率
图:中国装载启停电池汽车品牌比例
图:2013-2018年中国汽车启停用铅酸电池市场规模
图:2014年中国汽车起动铅酸电池企业竞争格局
表:全球主要汽车起动蓄电池厂商列表
表:各大企业在中国启停电池市场布局
图:常见的储能方式分类
图:不能储能技术对应的储能量和放电时间
图:主要电力储能技术的比较
图:全球各类电化学储能技术装机规模
图:不同电化学储能技术在不同国家的应用比例
图:电子储能用途
图:储能在可再生能源领域的应用
图:储能在分布式能源领域的应用
图:储能在V2G/V2H系统领域的应用
表:中国市场不同储能技术成本
表:美国市场不同储能技术成本
表:中国主要储能支持政策
图:2009-2015年全球电力化学储能累计装机规模
图:2014年全球储能系统主要技术路线份额
图:2010-2015年中国电力化学储能累计装机规模
图:2011-2018年中国电力化学储能行业规模
表:2015年三种主流电化学储能技术性能、成本比较
图:2011-2018年中国电力化学储能铅酸/铅炭电池行业规模
图:2010-2015年中国电信业固定资产投资
图:2010-2015H1中国移动电话基站建设情况
图:2010-2018年中国通信后备电源行业铅酸电池需求量
图:2010-2018年中国通信后备电源行业铅酸电池需求规模
图:2014年中国通信后备铅酸电池企业竞争格局
图:2014年中国电力储能铅酸电池企业竞争格局
图:2010-2015年中国电动自行车(分铅酸和锂电)产量
图:2010-2015年中国铅酸和锂电自行车渗透率
图:2010-2015年中国电动自行车保有量
图:2014年中国电动自行车(分地区)产量
图:2010-2015年中国电动自行车行业规模
表:2015年电动自行车主要电池种类价格表
图:电动自行车铅酸电池需求
图:电动自行车铅酸电池行业规模
图:2013-2014年电动自行车铅酸电池市场企业份额
图:2010-2018年中国三轮电动车产量
图:2010-2018年中国三轮电动车保有量
图:2010-2018年电动三轮车铅酸电池需求
图:2010-2018年电动三轮车铅酸电池行业规模
图:2014年中国电动三轮车铅酸电池企业份额
表:低速电动车主要技术要求(山东省)
表:国内低速电动车主要技术指标
图:2010-2018年中国低速电动汽车产量
图:2009-2018中国低速电动汽车保有量
图:2010-2015H1山东省低速电动汽车产量
图:2014-2015年中国主要低速电动汽车厂商销量排名
图:2010-2018年中国低速电动汽车市场规模
表:部分传统车企纷纷进军微型电动车领域
表:低速电动车优势
图:2010-2018年低速电动车铅酸电池需求
图:2010-2018年低速电动车铅酸电池行业规模
图:2014年中国低速电动车铅酸电池企业份额
图:2010-2015年中国场地车产量
表:2013-2015H1中国叉车细分市场产量
表:2014年中国电动观光游览车销量厂商TOP5
表:2014年中国叉车销量厂商TOP10
图:2010-2018年场地/特殊用途车铅酸电池需求
图:2010-2018年场地/特殊用途车铅酸电池行业规模
图:2011-2015年江森自控主要财务指标
表:FY2013-2015江森自控各部门营业收入
表:江森自控电池业务在华分布及产能
图:江森自控蓄电池品牌
图:FY2010-2013 Exide Technologies主要财务指标
表:Exide电池应用领域及主要品牌
图:FY2012-2016杰士汤浅销售额及营业利润
图:FY2015杰士汤浅营收结构(分产品)
表:FY2014-2015杰士汤浅营收结构(分区域)
表:杰士汤浅在华子公司
表:C&D上海生产基地
表:C&D主要产品
图:1998-2015年HOPPECKE销售额及员工数量
图:HOPPECKE主要产品
图:2009-2015H1年天能动力主要财务指标
图:2014-2015年天能动力营收结构(分产品)
图:天能动力生产基地分布
表:天能动力各生产基地产能
图:天能动力产品布局
图:2013-2015年天能动力各项产品营业收入
表:天能动力客户群
表:2011-2015年超威动力营业收入及利润
图:2011-2015年超威动力毛利率及净利率
图:超威动力生产基地分布
图:2011-2015年超威动力铅酸电池年产能
表:2013-2015年超威动力各项产品营业收入
表:超威动力主要客户
图:2011-2015年超威独立经销商数量
图:2010-2015年骆驼股份营业收入及净利润
表:2013-2015年骆驼股份各地区营业收入
表:2013-2014年骆驼股份主要产能
表:2013-2015年骆驼股份各项产品营业收入
表:2013-2015年骆驼股份各项产品毛利率
图:骆驼股份业务规划
表:骆驼股份主要客户
表:2010-2015年风帆股份营业收入及净利润
表:2013-2015年风帆股份(分地区)营业收入
图:2013-2015年风帆股份(分地区)营业收入占比
表:2015上半年风帆股份主要在建项目
表:2013-2015年风帆股份(分产品)营业收入
图:2013-2015年风帆股份(分产品)营业收入占比
图:2013-2015年风帆股份(分产品)毛利率
表:2014年风帆股份前5大客户
图:2009-2015年圣阳股份营业收入及净利润
表:2013-2015年圣阳股份(分地区)营业收入
图:2013-2015年圣阳股份(分地区)营业收入占比
表:2013-2014年圣阳股份蓄电池产销量
表:2013-2015年圣阳股份(分产品)营业收入
图:2013-2015年圣阳股份(分产品)营业收入占比
图:2013-2015年圣阳股份(分产品)毛利率
表:圣阳股份主要客户
表:2010-2015年南都电源营业收入及净利润
表:2012-2014年南都电源(分地区)营业收入
图:2012-2014年南都电源(分地区)营业收入占比
表:南都电源产能
表:南都电源铅炭电池技术路线中标的部分储能项目
表:2013-2015年南都电源(分行业)营业收入
图:2013-2015年南都电源(分行业)营业收入占比
表:2013-2014年南都电源(分产品)营业收入
图:2013-2014年南都电源(分产品)营业收入占比
图:2013-2015年南都电源(分行业)毛利率
图:2013-2014年南都电源(分产品)毛利率
表:2009-2015年雄韬股份营业收入及净利润
表:2014-2015年雄韬股份分地区业务收入和毛利率
表:2011-2014年雄韬股份产能
表:2013-2014年雄韬股份产销量
表:2014-2015年雄韬股份主要产品收入及毛利率
表:雄韬股份主要客户
表:2011-2014年雄韬股份前5大客户(外销)
表:2009-2015年猛狮科技营业收入及净利润
表:2013-2015年猛狮科技分地区主营收入
表:2013-2015年猛狮科技分地区毛利率
表:2013-2014年猛狮科技产销量
表:2013-2015年猛狮科技各项产品主营收入
表:2013-2015年猛狮科技各项产品毛利率
表:猛狮科技主要客户
图:2012-2014年双登集团营业收入
图:2009-2015年理士国际主要财务指标
表:2013-2015年理士国际各地区营业收入
图:2011-2015年理士国际产能
表:2013-2015年理士国际各项产品营业收入
表:理士国际主要客户
表:2010-2018年中国铅酸电池行业产量
表:2010-2018年中国铅酸电池行业(分应用领域)产量测算表
表:2014年中国铅酸电池行业不同应用领域(按按需求量)份额
表:2010-2018年中国铅酸电池行业规模
表:2010-2018年中国铅酸电池行业(分应用领域)行业规模测算表
表:全球及中国主要企业电池发展方向
Classification of Batteries
Chemical Principles of Lead-acid Battery
Classification of Lead-acid Battery by Usage
Market Shares of Different Applications of Lead-acid Battery in China by Demand, 2014
Cost Structure of Internal Materials of Lead-acid Battery
Global Lead-acid Battery Demand, 2010-2018E
Global Lead-acid Battery Market Size, 2010-2018E
Global Battery Market Size
Competitive Landscape of Global Lead-acid Battery Regions, 2014
Global Top 10 Lead-acid Battery Manufacturers, 2014
Policies on China’s Lead-acid Battery Industry, 2010-2014
Lead-acid Battery Market Demand in China, 2010-2015H1
Lead-acid Battery Market Size in China, 2010-2015H1
Lead-acid Battery Output in China by Province, 2012-2015H1
Statistics of Eliminated Backward Lead-acid Battery Capacity in China, 2014
Revenue of Major Lead-acid Battery Manufacturers in China, 2014
Top 10 Vehicle Starter Lead-acid Battery Export Enterprises, 2014
Top 10 Vehicle Starter Lead-acid Battery Export Destinations, 2014
Top 10 Sealed Lead Acid Battery Export Enterprises, 2014
Top 10 Sealed Lead Acid Battery Export Countries and Regions, 2014
Demand of Lead-acid Battery Industry in China, 2010-2018E
Demand Estimation of Lead-acid Battery Industry in China by Application, 2010-2018E
Market Shares of Different Applications of Lead-acid Battery in China by Demand, 2014
Lead-acid Battery Industry Scale in China, 2010-2018E
Lead-acid Battery Industry Scale by Application in China, 2010-2018E
Cost Structure of Lithium Battery
Specifications of Lead-acid and Lithium-ion Batteries
Price Trend of Lithium Iron Phosphate Batteries in China, 2011-2018E
Price Trend of Global Power Lithium Batteries for Electric Vehicles
Price Table of Major Batteries for Electric Bicycles, 2015
Applications of Lead-acid and Lithium Batteries
Shipments of Global Lithium Batteries by Demand, 2010-2018E
Market Share of Lithium Batteries in China by Application, 2014
Market Share of Global Small (Consumer Grade) Lithium Battery Companies, 2014
Market Share of Global Battery Manufacturers Supporting New Energy Passenger Vehicles, 2014
Output of Various Vehicle Models and Batteries, 2015
Market Share of Major Battery Manufacturers, 2015H1
Shipments of Major Battery Manufacturers, 2015H1 (MWh)
NiMH Battery Material System
Specifications of Lead-acid and NiMH Batteries
Market Share of Global NiMH Batteries by Application, 2014
Applications of Lead-acid and NiMH Batteries
Shipments and Market Size of Global Compact NiMH Battery, 2010-2015
Shipments and Market Size of Global Large-sized NiMH Battery, 2010-2015
NiMH Battery Market Size in China, 2011-2015
Market Share of Global Compact NiMH Battery Manufacturers, 2014
Sales Volume of Global New Energy Vehicles (EV/PHEV/HEV), 2009-2015
Specifications of Lead-acid and Ni-Cd Batteries
Applications of Lead-acid and Ni-Cd Batteries
Technical Performance Comparison between Lead-carbon Battery and Lead-Acid Battery
Economical Comparison between Lead-carbon and Lead-Acid Battery Energy Storage Technology
Characteristic Comparison of Energy Storage Systems of Three Technologies
Peak-valley Time-of-Use (TOU) Electricity Price of Enterprises in Jiangsu Province
Peak-valley Electricity Price Difference of Different Levels of Voltage
Energy Storage Costs and Power Saving Benefits
Classification of Fuel Cells
Technical Advantages (I) of Communication Base Backup Power, Fuel Cell and Lead-acid Battery
Technical Advantages (II) of Communication Base Backup Power, Fuel Cell and Lead-acid Battery
Energy Efficiency up to 90% of Fuel Cell Cogeneration Project
Outlook of 42% Household Energy Provided by Fuel Cells in Japan
Economical Efficiency of Bloom Energy SOFC System
Applied Scenarios of Fuel Cell Backup Power Supply
Emergent Power Supply System of Ballard Fuel Cell
Ballard’s Calculation Parameters for Lead-acid Battery and Fuel Cell Costs
Fuel Cell Vehicle Development Roadmap of World’s Major Automakers
Cost Analysis of Fuel Cell System
Relation between Output and Cost of Fuel Cell System
Percentage of Cost of Parts for Fuel Cell System
Performance Comparison between Various Batteries
Development Orientation of Vehicle-use Battery
Key Components of Lead-acid Battery
Output of Refined Lead in China, 2010-2015H1
Output of Lead-acid Battery in China, 2010-2014
China’s Output of Lead and Secondary Lead
Top 10 Players by Sulfuric Acid Output in China in Recent Two Years
Output & Sales Volume and Ownership of Automobiles and Demand for Starter Lead-acid Batteries, 2010-2018E
Vehicle Starter Lead-acid Battery Industry Scale, 2010-2018E
Schematic Diagram of Vehicle Start-stop System
Shipments and Penetration of Vehicle Start-stop Battery System in China, 2013-2018E
Proportion of Vehicle Brands Loading Start-stop Batteries in China
Vehicle Start-stop Lead-acid Battery Market Size in China, 2013-2018E
Competitive Landscape of Vehicle Starter Lead-acid Battery Manufacturers in China, 2014
List of World’s Major Manufacturers of Vehicle Starter Battery
Market Layout of Major Start-stop Battery Manufacturers in China
Classification of Common Energy Storage Methods
Corresponding Energy Storage Capacity and Discharging Time of Different Energy Storage Technologies
Comparison of Main Electric Power Energy Saving Technologies
Installed Capacity of Various Electrochemical Energy Storage Technologies Worldwide
Application Proportion of Different Electrochemical Energy Storage Technologies in Different Countries
Usages of Electronic Energy Storage
Application of Energy Storage in Renewable Energy Field
Application of Energy Storage in Distributed Energy Field
Application of Energy Storage in V2G/V2H System Field
Cost of Different Energy Storage Technologies in Chinese Market
Cost of Different Energy Storage Technologies in U.S. Market
Policies on Energy Storage in China
Accumulative Installed Capacity of Global Electrochemical Energy Storage, 2009-2015
Market Share of Main Technical Routes of Global Energy Storage Systems, 2014
Accumulative Installed Capacity of Electrochemical Energy Storage in China, 2010-2015
Electrochemical Energy Storage Industry Scale in China, 2011-2018E
Performance and Cost Comparison of Three Mainstream Electrochemical Energy Storage Technologies, 2015
Electrochemical Energy Storage Lead-acid/Lead-carbon Battery Industry Scale in China, 2011-2018E
Fixed Asset Investments of Telecommunication Industry in China, 2010-2015
Construction of Mobile Phone Base Stations in China, 2010-2015H1
Lead-acid Battery Demand from Communication Backup Power Industry in China, 2010-2018E
Lead-acid Battery Demand Scale of Communication Backup Power Industry in China, 2010-2018E
Competitive Landscape of Communication Backup Lead-acid Battery Manufacturers in China, 2014
Competitive Landscape of Power Energy Storage Lead-acid Battery Manufacturers in China, 2014
Output of Electric Bicycles in China by Lead-acid Battery and Lithium Battery, 2010-2015
Permeability of Lead-acid and Lithium Battery Bicycles in China, 2010-2015
Ownership of Electric Bicycles in China, 2010-2015
Output of Electric Bicycles (by Region) in China, 2014
Electric Bicycle Industry Scale in China, 2010-2015
Price Table of Major Batteries for Electric Bicycles, 2015
Electric Bicycle Lead-acid Battery Demand
Electric Bicycle Lead-acid Battery Industry Scale
Market Share of Electric Bicycle Lead-acid Battery Manufacturers, 2013-2014
Output of Electric Tricycles in China, 2010-2018E
Ownership of Electric Tricycles in China, 2010-2018E
Electric Tricycle Lead-acid Battery Demand, 2010-2018E
Electric Tricycle Lead-acid Battery Industry Scale, 2010-2018E
Market Share of Electric Tricycle Lead-acid Battery Manufacturers in China, 2014
Main Technical Requirements of Low-speed Electric Vehicles (Shandong Province)
Main Specifications of Low-speed Electric Vehicles in China
Output of Low-speed Electric Vehicles in China, 2010-2018E
Ownership of Low-speed Electric Vehicles in China, 2009-2018E
Output of Low-speed Electric Vehicles in Shandong Province, 2010-2015H1
Rankings of Major Low-speed Electric Vehicle Manufacturers in China by Sales Volume, 2014-2015
Low-speed Electric Vehicle Market Size in China, 2010-2018E
Successive Accession of Some Traditional Automakers into the Mini Electric Vehicle Field
Advantages of Low-speed Electric Vehicles
Low-speed Electric Vehicle Lead-acid Battery Demand, 2010-2018E
Low-speed Electric Vehicle Lead-acid Battery Industry Scale, 2010-2018E
Market Share of Low-speed Electric Vehicle Lead-acid Battery Manufacturers in China, 2014
Output of ATV in China, 2010-2015
Output of Forklift Market Segments in China, 2013-2015H1
Top 5 Electric Sightseeing Vehicle Manufacturers in China by Sales Volume, 2014
Top 10 Forklift Manufacturers in China by Sales Volume, 2014
ATV/Special Vehicle Lead-acid Battery Demand, 2010-2018E
ATV/Special Vehicle Lead-acid Battery Industry Scale, 2010-2018E
Key Financial Indicators of Johnson Controls, 2011-2015
Revenue of Johnson Controls by Segment, FY2013-FY2015
Distribution and Capacity of Johnson Controls’ Business in China
Battery Brands of Johnson Controls
Key Financial Indicators of Exide Technologies, FY2010-FY2013
Applications and Main Brands of Exide Technologies’ Batteries
Revenue and Operating Income of GS Yuasa, FY2012-FY2016
Revenue Structure of GS Yuasa by Product, FY2015
Revenue Structure of GS Yuasa by Region, FY2014-FY2015
Subsidiaries of GS Yuasa in China
Shanghai Production Base of C&D
Main Products of C&D
Revenue and Employees of HOPPECKE, 1998-2015
Main Products of HOPPECKE
Key Financial Indicators of Tianneng Power, 2009-2015H1
Revenue Structure of Tianneng Power by Product, 2014-2015
Distribution of Tianneng Power’s Production Bases
Capacity of Tianneng Power’s Production Bases
Product Layout of Tianneng Power
Revenue of Tianneng Power by Product, 2013-2015
Customer Group of Tianneng Power
Revenue and Profit of Chaowei Power, 2011-2015
Gross Margin and Net Profit Margin of Chaowei Power, 2011-2015
Distribution of Chaowei Power’s Production Bases
Lead-acid Battery Capacity of Chaowei Power, 2011-2015
Revenue of Chaowei Power by Product, 2013-2015
Major Customers of Chaowei Power
Number of Changwell Power’s Independent Dealers, 2011-2015
Revenue and Net Income of Camel Group, 2010-2015
Revenue of Camel Group by Region, 2013-2015
Capacity of Camel Group, 2013-2014
Revenue of Camel Group by Product, 2013-2015
Gross Margin of Camel Group by Product, 2013-2015
Business Planning of Camel Group
Major Customers of Camel Group
Revenue and Net Income of China Shipbuilding Industry Group Power, 2010-2015
Revenue of China Shipbuilding Industry Group Power by Region, 2013-2015
Revenue Structure of China Shipbuilding Industry Group Power by Region, 2013-2015
Main Projects under Construction of China Shipbuilding Industry Group Power, 2015H1
Revenue of China Shipbuilding Industry Group Power by Product, 2013-2015
Revenue Structure of China Shipbuilding Industry Group Power by Product, 2013-2015
Gross Margin of China Shipbuilding Industry Group Power by Product, 2013-2015
Top 5 Customers of China Shipbuilding Industry Group Power, 2014
Revenue and Net Income of Shandong Sacred Sun Power Sources, 2009-2015
Revenue of Shandong Sacred Sun Power Sources by Region, 2013-2015
Revenue Structure of Shandong Sacred Sun Power Sources by Region, 2013-2015
Battery Sales Volume of Shandong Sacred Sun Power Sources, 2013-2014
Revenue of Shandong Sacred Sun Power Sources by Product, 2013-2015
Revenue Structure of Shandong Sacred Sun Power Sources by Product, 2013-2015
Gross Margin of Shandong Sacred Sun Power Sources by Product, 2013-2015
Major Customers of Shandong Sacred Sun Power Sources
Revenue and Net Income of Narada Power Source, 2010-2015
Revenue of Narada Power Source by Region, 2012-2014
Revenue Structure of Narada Power Source by Region, 2012-2014
Capacity of Narada Power Source
Part of Bid-winning Energy Storage Projects on Lead-carbon Battery Technical Route of Narada Power Source
Revenue of Narada Power Source by Sector, 2013-2015
Revenue Structure of Narada Power Source by Sector, 2013-2015
Revenue of Narada Power Source by Product, 2013-2014
Revenue Structure of Narada Power Source by Product, 2013-2014
Gross Margin of Narada Power Source by Industry, 2013-2015
Gross Margin of Narada Power Source by Product, 2013-2014
Revenue and Net Income of Vision Group, 2009-2015
Revenue and Gross Margin of Vision Group by Region, 2014-2015
Capacity of Vision Group, 2011-2014
Output and Sales Volume of Vision Group, 2013-2014
Revenue and Gross Margin of Vision Group by Product, 2014-2015
Major Customers of Vision Group
Top 5 Customers of Vision Group (Export Sales), 2011-2014
Revenue and Net Income of Dynavolt Tech, 2009-2015
Operating Revenue of Dynavolt Tech by Region, 2013-2015
Gross Margin of Dynavolt Tech by Region, 2013-2015
Output and Sales Volume of Dynavolt Tech, 2013-2014
Operating Revenue of Dynavolt Tech by Product, 2013-2015
Gross Margin of Dynavolt Tech by Product, 2013-2015
Major Customers of Dynavolt Tech
Revenue of Shuangdeng Group, 2012-2014
Key Financial Indicators of Leoch International, 2009-2015
Revenue of Leoch International by Region, 2013-2015
Capacity of Leoch International, 2011-2015
Revenue of Leoch International by Product, 2013-2015
Major Customers of Leoch International
Output of China Lead-acid Battery Industry, 2010-2018E
Output Estimation of China Lead-acid Battery Industry (by Application), 2010-2018EPercentages of Different Applications (by Demand) of China Lead-acid Battery Industry, 2014
China Lead-acid Battery Industry Scale in China, 2010-2018E
Scale Estimation of China Lead-acid Battery Industry (by Application), 2010-2018E
Battery Development Direction of Key Global and Chinese Enterprises
如果这份报告不能满足您的要求,我们还可以为您定制报告,请 留言说明您的详细需求。
|