|
|
|
报告导航:研究报告—
制造业—化工
|
|
2016-2020年全球及中国天然橡胶行业研究报告 |
 |
字数:3.0万 |
页数:121 |
图表数:141 |
|
中文电子版:9000元 |
中文纸版:4500元 |
中文(电子+纸)版:9500元 |
|
英文电子版:2250美元 |
英文纸版:2400美元 |
英文(电子+纸)版:2550美元 |
|
编号:CYH051
|
发布日期:2016-08 |
附件:下载 |
 |
|
|
自2011年以来,全球天然橡胶市场一直处于供过于求的状态,2011年供给过剩22万吨,2015年约为14万吨。在天胶主产区可割面积持续增长、天胶下游轮胎产业增速变缓等影响下,预计2016-2020年全球过剩现状仍将持续,至2020年过剩约11万吨。
受全球经济增速变缓、天胶供应过剩等影响,天胶价格持续低迷,截至2015年底,中国天然橡胶价格跌至1140美元元/吨左右,基本处于天胶成本线位。预计2016年,全球天胶均价在1200~1500 美元/吨左右浮动。
2015年,中国天胶产量同比减少5.5%至79.42万吨。受天胶种植气候限制,中国天胶种植区域有限,再加之胶价徘徊于成本线位,胶农因亏损弃胶现象增多,预计2016年中国天胶产量进一步下滑5.3%至75.21万吨。
而中国是全球最大的天然橡胶消费国,2015年消费量为468.2万吨,占到全球总量的38.5%。中国天胶市场供需严重失衡,大部分需要进口满足额外需求,2015年其进口量同比增长4.8%至273.6万吨,进口单价同比下滑24.5%至1431.6美元/吨。
在胶价下滑、胶园规模缩减背景下,中国汽车工业规模不断扩大,汽车保有量和新增量持续增加,致使轮胎行业刚性需求持续增长,从而拉动天胶需求量,预计2016-2020年,中国天胶供需矛盾将进一步加剧,至2020年供需缺口约达514.2万吨,较2015年增长32.3%。
受天然橡胶资源约束影响,天然橡胶产业高度集中,全球核心企业主要分布在泰国、马来西亚等东南亚地区,代表企业有泰国诗董、宏曼历、泰国联益、泰橡公司、中化国际等。
在天胶市场低迷背景下,未来几年,企业可利用行业低谷期加快资源和战略拓展,加大企业主产国种植面积以及天胶加工厂布局,提高公司生产能力,另一方面,注重天胶定制化及天胶高端市场应用的拓展,如军用轮胎级天胶等研发,以提高公司产品毛利率及产品竞争实力。
水清木华研究中心《2016-2020年全球及中国天然橡胶行业研究报告》着重研究了以下内容:
 全球天然橡胶市场供需、地区分布、市场价格、竞争格局、发展趋势等; 全球天然橡胶市场供需、地区分布、市场价格、竞争格局、发展趋势等;
中国天然橡胶市场供需、进出口、地区结构、竞争格局、发展趋势等;
全球及中国天然橡胶割胶面积、种植面积等;
轮胎、胶带胶管等中国天然橡胶下游应用发展情况等;
全球5家天然橡胶企业经营情况及在华发展等;
中国5家天然橡胶重点企业经营情况及发展战略等。
Since 2011, the global natural rubber market has been in a state of oversupply which reached 220,000 tons in 2011 and about 140,000 tons in 2015. Affected by the growing tapping area of natural rubber in main producing regions, the slowdown in the growth rate of the tire industry and other factors, there will still be a glut of natural rubber worldwide during 2016-2020 and the global glut will be 110,000 tons or so in 2020.
Due to the sluggish global economic growth and the excess supply of natural rubber, the price of natural rubber has been hovering at a low level. As of the end of 2015, China's natural rubber price had fallen to around USD1,140 / ton which was also the cost price. In 2016, the global average price of natural rubber fluctuates at USD1,200-1,500 / ton.
In 2015, China's natural rubber output dropped 5.5% year on year to 794,200 tons. Weather factors confine China’s natural rubber planting areas to a limited scope; plus the rubber price lingering on the cost line, more and more farmers have abandoned rubber production. In 2016, China's output of natural rubber is expected to further decline by 5.3% to 752,100 tons.
As the world's largest consumer, China consumed 4.682 million tons of natural rubber in 2015, accounting for 38.5% of the global total. Amid the serious imbalance between supply and demand, China mostly imports natural rubber to meet the additional demand. The import volume rose 4.8% year on year to 2.736 million tons, while the average import price fell 24.5% year on year to USD1,431.6 / ton in 2015.
In the backdrop of the descending rubber price and the downsized rubber plantations, China's automobile industry has been expanding in ownership and new increment, conducing to the ascending rigid demand of the tire industry and the growing demand for natural rubber. In 2016-2020, the contradiction between natural rubber supply and demand in China will further intensify; by 2020, the gap between supply and demand will hit about 5.142 million tons, an increase of 32.3% over 2015.
Restricted by resource distribution, the natural rubber industry is highly centralized in Thailand, Malaysia and other Southeast Asian nations, represented by the key players such as Sri Trang Agro-Industry, Von Bundit, Southland Rubber, Thai Rubber Latex and Sinochem International.
Given the downturn of the natural rubber market, companies can speed up the development of resources and strategies, increase the planting area in major producing countries as well as enhance processing factory layout to improve production capacity in the next years; on the other hand, they can keep an eye on customization and high-end market applications of natural rubber, such as military rubber tires, to heighten the gross margin and competitiveness of products.
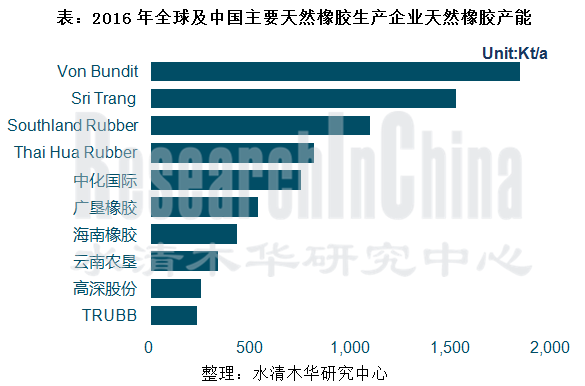
Capacity of Major Global and Chinese Natural Rubber Producers, 2016
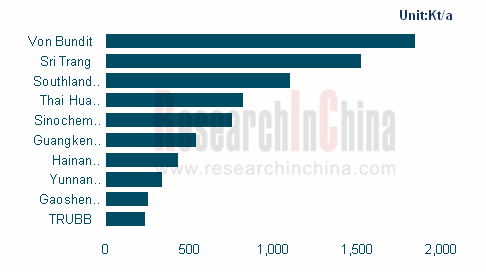
Source: ResearchInChina
Global and China Natural Rubber Industry Report, 2016-2020 by ResearchInChina highlights:
 Supply & demand, regional distribution, prices, competitive landscape and development trends of global natural rubber market; Supply & demand, regional distribution, prices, competitive landscape and development trends of global natural rubber market;
Supply & demand, import & export, regional structure, competitive landscape, development trends of Chinese natural rubber market;
Tapping area and planting area of natural rubber in China and around the world;
Development of applications of natural rubber in China, such astyre, rubber belt & hose;
Operation and development in China of 5 global natural rubber companies;
Operation and development strategies of 5 key Chinese natural rubber companies.
第一章 天然橡胶基础概念
1.1 定义
1.2 分类
1.3 产业链
第二章 全球天然橡胶市场发展概况
2.1 发展现状
2.2 市场供给
2.3 市场需求
2.3.1 消费量
2.3.2 消费结构
2.4 主要天胶产区
2.4.1 泰国
2.4.2 印度尼西亚
2.4.3 马来西亚
2.4.4 越南
2.5 价格
2.6 竞争格局
2.6.1 分收入
2.6.2 分产能
2.7 发展趋势
第三章 中国天然橡胶市场发展概况
3.1 发展现状
3.2 市场供需
3.2.1 供给及地区结构
3.2.2 需求及消费结构
3.3 进出口
3.3.1 进口
3.3.2 出口
3.4 价格
3.5 竞争格局
3.5.1 分企业
3.5.2 替代产品
3.6 发展趋势
第四章 全球及中国天然橡胶相关产业发展
4.1 上游
4.2 下游
4.2.1 轮胎行业
4.2.2 其他
第五章 全球重点生产企业
5.1 泰国诗董橡胶股份有限公司
5.1.1 企业简介
5.1.2 经营情况
5.1.3 营收构成
5.1.4 产能和产销量
5.1.5 产业链布局
5.1.6 在华发展
5.1.7 竞争优势
5.2 泰国橡胶集团有限公司(TRUBB)
5.2.1 企业简介
5.2.2 经营情况
5.2.3 营收构成
5.2.4 产能及销量
5.2.5 产业链布局
5.2.6 产品竞争策略
5.2.7 销售渠道
5.2.8 在华发展
5.3 泰华树胶(大众)有限公司
5.3.1 企业简介
5.3.2 产能
5.3.3 在华发展
5.3.4 竞争优势
5.4 宏曼历有限公司
5.4.1 企业简介
5.4.2 产能
5.4.3 竞争优势
5.5 泰国联益橡胶集团有限公司
5.5.1 企业简介
5.5.2 产能
5.5.3 在华发展
第六章 中国重点企业
6.1 海南天然橡胶产业集团股份有限公司(601118)
6.1.1 企业简介
6.1.2 经营情况
6.1.3 营收构成
6.1.4 毛利率
6.1.5 产销量
6.1.6 竞争实力
6.1.7 发展战略
6.2 中化国际(控股)股份有限公司(600500)
6.2.1 企业简介
6.2.2 经营情况
6.2.3 营收构成
6.2.4 毛利率
6.2.5 天然橡胶业务
6.2.6 竞争优势
6.3 云南农垦集团有限责任公司
6.3.1 企业简介
6.3.2 经营情况
6.3.3 营收构成
6.3.4 天然橡胶业务
6.3.5 天然橡胶海外布局
6.3.6 天然橡胶竞争实力
6.4 广东省广垦橡胶集团有限公司
6.4.1 企业简介
6.4.2 经营情况
6.4.3 橡胶种植业务
6.4.4 橡胶加工业务
6.4.5 发展战略
6.5 西双版纳新高深橡胶股份有限公司
6.5.1 企业简介
6.5.2 经营情况
6.5.3 产能与产销量
6.5.4 竞争优势
1 Basic Concept of Natural Rubber
1.1 Definition
1.2 Classification
1.3 Industry Chain
2 Development of Global Natural Rubber Market
2.1 Status Quo
2.2 Supply
2.3 Demand
2.3.1 Consumption
2.3.2 Consumption Structure
2.4 Main Natural Rubber Producing Areas
2.4.1 Thailand
2.4.2 Indonesia
2.4.3 Malaysia
2.4.4 Vietnam
2.5 Price
2.6 Competitive Landscape
2.6.1 by Revenue
2.6.2 by Capacity
2.7 Development Trend
3 Development of Chinese Natural Rubber Market
3.1 Status Quo
3.2 Supply and Demand
3.2.1 Supply and Regional Structure
3.2.2 Demand and Consumption Structure
3.3 Import and Export
3.3.1 Import
3.3.2 Export
3.4 Price
3.5 Competitive Landscape
3.5.1 by Enterprise
3.5.2 Substitute Products
3.6 Development Trend
4 Development of Global and China Natural Rubber-related Industries
4.1 Upstream
4.2 Downstream
4.2.1 Tyre Industry
4.2.2 Others
5 Key Global Players
5.1 Sri Trang Agro-Industry Plc.
5.1.1 Profile
5.1.2 Operation
5.1.3 Revenue Structure
5.1.4 Capacity, Output and Sales Volume
5.1.5 Layout of Industry Chain
5.1.6 Development in China
5.1.7 Competitive Edge
5.2 Thai Rubber Latex Corporation (Thailand) Public Co., Ltd. (TRUBB)
5.2.1 Profile
5.2.2 Operation
5.2.3 Revenue Structure
5.2.4 Capacity and Sales Volume
5.2.5 Layout of Industry Chain
5.2.6 Product Competitive Strategy
5.2.7 Sales Channels
5.2.8 Development in China
5.3 Thai Hua Rubber Public Co., Ltd.
5.3.1 Profile
5.3.2 Capacity
5.3.3 Development in China
5.3.4 Competitive Edge
5.4 Von Bundit Co., Ltd.
5.4.1 Profile
5.4.2 Capacity
5.4.3 Competitive Edge
5.5 Southland Rubber Co., Ltd.
5.5.1 Profile
5.5.2 Capacity
5.5.3 Development in China
6 Major Chinese Companies
6.1 China Hainan Rubber Industry Group Co., Ltd. (601118)
6.1.1 Profile
6.1.2 Operation
6.1.3 Revenue Structure
6.1.4 Gross Margin
6.1.6 Output and Sales Volume
6.1.7 Competitive Strength
6.1.8 Development Strategy
6.2 Sinochem International Corporation (600500)
6.2.1 Profile
6.2.2 Operation
6.2.3 Revenue Structure
6.2.4 Gross Margin
6.2.5 Natural Rubber Business
6.2.6 Competitive Edge
6.3 Yunnan State Farms Group Co., Ltd.
6.3.1 Profile
6.3.2 Operation
6.3.3 Revenue Structure
6.3.4 Natural Rubber Business
6.3.5 Overseas Layout
6.3.6Competitive Strength
6.4 Guangdong Guangken Rubber Group Co., Ltd.
6.4.1 Profile
6.4.2 Operation
6.4.3 Rubber Plantation Business
6.4.4 Rubber Processing Business
6.4.5 Development Strategy
6.5 Yunnan Gaoshen Rubber Co., Ltd.
6.5.1 Profile
6.5.2 Operation
6.5.3 Capacity, Output and Sales Volume
6.5.4 Competitive Edge
表:天然橡胶的特性
表:标准胶(分级别)种类
表:天然橡胶的分类
图:天然橡胶主要生产流程
图:天然橡胶产业链
表:全球天然橡胶发展阶段
图:2008-2016年全球天然橡胶产量及同比增长
表:2013-2015年全球天然橡胶(分国家)产量及构成
表:截至2016年6月重要厄尔尼诺现象发生时间及强度
图:2008-2016全球天然橡胶消费量及同比增长
图:2015&2020全球天然橡胶(分应用领域)消费量构成
图:2015年全球天然橡胶(分国家)出口量构成
表:2015-2020年泰国天然橡胶产量与开割面积
图:2005-2016年泰国天然橡胶出口量
图:泰国天然橡胶种植区域按月份气温特征
图:截至2020年泰国天然橡胶树龄分布情况
图:2010-2015年泰国天然橡胶(分产品)产量
图:2015年泰国天然橡胶(分产品)产量结构
表:2015-2020年印度尼西亚天然橡胶供应情况
图:2008-2016年印度尼西亚天然橡胶出口量
图:2003-2015年印度尼西亚天然橡胶总种植面积、开割面积及割胶率
表:2015-2020年马来西亚天然橡胶供应情况
图:2008-2016年马来西亚天然橡胶出口量
图:1996-2015年马来西亚天然橡胶种植面积
图:2003-2016年马来西亚天然橡胶总种植面积、开割面积及割胶率
图:2003-2016年马来西亚天然橡胶新种植面积
图:2012-2016年马来西亚标胶价格
表:2015-2020年越南天然橡胶供应情况
图:2008-2016年越南天然橡胶出口量
图:2003-2016年越南天然橡胶总种植面积、开割面积及割胶率
图:2003-2016年越南天然橡胶新种面积
图:2007-2015年越南天然橡胶出口量
图:2015年越南天然橡胶(分产品)出口结构
表:2009-2016年世界主要国家天然橡胶政策
图:2014-2016年CIF青岛主港天胶价格走势(美元/吨)
图:2015-2016年全球及中国主要橡胶生产企业营业收入
表:2016年全球及中国主要天然橡胶生产企业天然橡胶产能
表:2015-2020年全球天然橡胶产量与需求量
表:2015-2020年全球天然橡胶(分下游)消费量
表:2014年12月国储收储天然橡胶情况
图:2008-2016年中国天然橡胶产量及同比增长
图:2005-2016年中国天然橡胶自给率
图:2015年中国天然橡胶(分地区)产量结构
图:海南省天然橡胶加工区域构成
图:2008-2016年中国天然橡胶消费量及同比增长
图:2013-2020中国天然橡胶下游需求结构
表:2006-2016年中国天然橡胶进口关税政策
图:2004-2016年中国天然橡胶进口量及同比增长
表:2007-2016年中国天然橡胶(分国家)进口量及构成
图:2013&2015年中国天然橡胶进口量(分产品)构成
图:2008-2016年中国天然橡胶出口量
图:2011-2016年中国上海市场天然橡胶价格
表:2015年中国主要天然橡胶生产商天然橡胶业务发展
表:常用橡胶产品性能
表:2003-2020年中国合成橡胶产量与消费量
表:2015-2020年中国天然橡胶产量与消费量
图:2013-2015年全球九大天然橡胶主产国天然橡胶总种植面积
表:2004-2014年全球九大天然橡胶主产国天然橡胶开割面积
图:2014-2015年全球主要国家天然橡胶单产
表:2008-2015年全球天然橡胶主产国新种与翻种面积
图:全球天然橡胶主产国停割期
图:2013-2016年中国子午线轮胎(分产品)开工率
表:2013-2015年中国轮胎出口量及金额
图:2015年中国半钢轮胎企业规模统计
图:2015年中国全钢轮胎企业规模
图:2015年全钢轮胎(分原材料)成本构成
图:2015年半钢轮胎(分原材料)成本构成
表:2015-2020年中国子午线轮胎天然橡胶需求量
表:2016年中国轮胎企业在国外布局天然橡胶情况
表:2012-2015年中国胶管带产量及同比增长
图:2008-2015年中国胶管相关制造企业营业收入及同比增长
图:2008-2015年中国胶管制造企业毛利率
表:1987-2016年诗董集团重要发展事件
图:2008-2016年诗董集团营业收入与净利润
图:2014-2015年诗董集团毛利润与毛利率
图:2012-2016年诗董集团(分产品)主营业务收入
图:2013-2016年诗董集团天然橡胶业务(分国家)主营业务收入
图:2015-2016年诗董集团天然橡胶(分国家/地区)销量
图:2010-2015年诗董集团(分产品)天然橡胶销量
图:2016年诗董集团天然橡胶产业链
图:截至2016年3月底,诗董集团天然橡胶种植面积构成
图:2016-2022年诗董集团天然橡胶可割胶面积
图:2005-2016年诗董集团天然橡胶产能
图:2016年诗董集团天然橡胶主要下游产品布局
图:2011-2016年诗董集团天然橡胶在中国营业收入
图:2012-2015年诗董集团在华销量占中国总进口量的市场份额
图:诗董集团全球市场份额
图:诗董集团主要发展策略
图:2008-2016年泰橡公司营业收入与净利润
表:2016年泰橡公司(分业务)子公司
图:2013-2016泰橡公司(分业务)收入及构成
图:2013-2015年泰橡公司(分业务)产能
表:2012-2013年泰橡公司(分业务)产品销量
表:泰橡公司Latex Group产品主要竞争策略
表:2016年泰橡公司主要业务部门销售渠道
图:2012-2015年泰橡公司在中国营业收入
表:2016泰华公司工厂与产能
表:2016年泰华公司(分产品)天然橡胶产能
图:2016年宏曼历附属子公司分布
表:2013-2015年宏曼历(分产品)产能
表:2015年宏曼历天然橡胶(分工厂)产能
图:1999-2016年泰国联益橡胶集团全球发展事件
表:2015-2016年联益橡胶(分产品)产能
表:2016年联益橡胶(分工厂)产品产能
图:2008-2016年海南橡胶营业收入与净利润
表:2012-2015年海南橡胶(分产品)主营业务收入及构成
图:2009-2015年海南橡胶(分地区)主营业务收入
图:2009-2015年海南橡胶(分产品)毛利率
图:2010-2015年海南橡胶天然橡胶(分渠道)产量
图:2008-2015年海南橡胶销量及同比增长
图:2016年海南橡胶天然橡胶产业链布局
图:2016-2020年海南橡胶公司特种胶园更新种植面积
图:2016-2020年海南橡胶特种胶园配套防护林面积
图:2015-2020年海南橡胶营业收入与净利润
图:2008-2016年中化国际营业收入与净利润
图:2015年中化国际(分业务)主营业务收入构成
图:2012-2015年中化国际(分地区)营业收入
图:2009-2015年中化国际(分业务)毛利率
图:2009-2015年中化国际天然橡胶业务营业收入与营业成本
图:2010-2015年中化国际天然橡胶产能
图:2011-2016年中化国际天然橡胶产销量
图:2012-2016年云南农垦营业收入与净利润
表:2014-2015年云南农垦集团(分业务)主营业务收入及构成
表:2012-2015年云南农垦集团天然橡胶种植面积、开割面积及开割比例
表:2012-2015年云南农垦集团天然橡胶采购量、采购成本及均价
表:2016年云南农垦集团橡胶加工(分加工厂)产能
表:2012-2016年云南农垦天然橡胶(分产品)产能与产量
图:2012-2015年云南农垦天然橡胶(分产品)营业收入及构成
表:2012-2015年云南农垦天然橡胶(分销售渠道)销售量及占比
表:广垦橡胶主要海外子公司
图:2010-2016年广东广垦橡胶企业营业收入及同比增长
表:2013-2016年广垦橡胶(分地区)天然橡胶收入情况
表:2013-2016年广垦橡胶天然橡胶采购量及采购价格
表:2013-2016年广垦集团橡胶业务(分产品)产能及产量
表:2013-2015年广垦橡胶公司(分产品/分地区)销量及收入
表:截至2016年3月底广垦集团橡胶主要在建/拟建项目
图:2013-2016年高深股份营业收入与净利润
表:2013-2015年高深股份(分地区)主营业务收入及构成
表:2013-2015年高深股份(分工厂)产能与产量
表:2013-2014年高深股份(分产品)天然橡胶销量
表:2016H1年高深股份前五名客户名称及营业收入贡献
Properties of Natural Rubber
Categories of Standard Rubber (by Level)
Classification of Natural Rubber
Main Production Processes of Natural Rubber
Natural Rubber Industry Chain
Development Stages of Global Natural Rubber
Global Natural Rubber Output and YoY Growth, 2008-2016
Global Natural Rubber Output by Country, 2013-2015
Occurrence Time and Intensity of Important El Niño Phenomena, by Jun 2016
Global Natural Rubber Consumption and YoY Growth, 2008-2016
Global Natural Rubber Consumption Structure by Application, 2015&2020
Global Natural Rubber Export Volume Structure by Country, 2015
Thailand's Natural Rubber Output and Tapping Area, 2015-2020E
Thailand's Natural Rubber Export Volume, 2005-2016
Temperature Characteristics of Thailand's Natural Rubber Planting Areas by Month
Distribution of Thailand's Natural Rubber by Tree Age, by 2020E
Thailand's Natural Rubber Output by Product, 2010-2015
Thailand's Natural Rubber Output Structure by Product, 2015
Indonesia's Natural Rubber Supply, 2015-2020E
Indonesia's Natural Rubber Export Volume, 2008-2016
Indonesia's Natural Rubber Total Planting Area, Tapping Area and Tapping Rate, 2003-2015
Malaysia's Natural Rubber Supply, 2015-2020E
Malaysia's Natural Rubber Export Volume, 2008-2016
Malaysia's Natural Rubber Planting Area, 1996-2015
Malaysia's Natural Rubber Total Planting Area, Tapping Area and Tapping Rate, 2003-2016
Malaysia's Additional Natural Rubber Planting Area, 2003-2016
Malaysia’s Standard Rubber Price, 2012-2016
Vietnam's Natural Rubber Supply, 2015-2020E
Vietnam's Natural Rubber Export Volume, 2008-2016
Vietnam's Natural Rubber Total Planting Area, Tapping Area and Tapping Rate, 2003-2016
Vietnam's Additional Natural Rubber Planting Area, 2003-2016
Vietnam's Natural Rubber Export Volume, 2007-2015
Vietnam's Natural Rubber Export Structure by Product, 2015
Policies on Natural Rubber in Major Countries, 2009-2016
CIF Prices of Natural Rubber in Main Ports of Qingdao, 2014-2016
Revenue of Major Global and Chinese Rubber Producers, 2015-2016
Capacity of Major Global and Chinese Natural Rubber Producers, 2016
Global Natural Rubber Output and Demand, 2015-2020E
Global Natural Rubber Consumption by Application, 2015-2020E
Purchase and Storage of Natural Rubber by State Bureau of Material Reserve, Dec 2014
China’s Natural Rubber Output and YoY Growth, 2008-2016
China’s Natural Rubber Self-sufficiency Rate, 2005-2016
China’s Natural Rubber Output Structure by Region, 2015
Structure of Hainan's Natural Rubber Processing Regions
China’s Natural Rubber Consumption and YoY Growth, 2008-2016
Structure of Downstream Demand for Natural Rubber in China, 2013-2020E
China’s Import Tariff Policies on Natural Rubber, 2006-2016
Import Volume and YoY Growth of Natural Rubber in China, 2004-2016
Import Volume Structure of Natural Rubber in China by Country, 2007-2016
Import Volume Structure of Natural Rubber in China by Product, 2013&2015
China’s Natural Rubber Export Volume, 2008-2016
Natural Rubber Price in Shanghai Market, 2011-2016
Natural Rubber Business Development of Major Natural Rubber Producers in China, 2015
Performance of Common Rubber Products
Synthetic Rubber Output and Consumption in China, 2003-2020E
Natural Rubber Output and Consumption in China, 2015-2020E
Total Planting Area of Global Top 9 Natural Rubber Producing Countries, 2013-2015
Tapping Area of Global Top 9 Natural Rubber Producing Countries, 2004-2014
Natural Rubber Output of Global Major Countries, 2014-2015
New Planting & Replanting Area of Global Major Natural Rubber Producing Countries, 2008-2015
Stoppage Periods of Global Major Natural Rubber Producing Countries
China’s Radial Tire Operating Rate by Product, 2013-2016
China’s Tire Export Volume and Value, 2013-2015
Size of Chinese Semisteel Tire Enterprises, 2015
Size of Chinese Steel Tire Enterprises, 2015
Steel Tire Cost Structure by Raw Materials, 2015
Semisteel Tire Cost Structure by Raw Materials, 2015
Demand of Chinese Radial Tires for Natural Rubber, 2015-2020E
Overseas Natural Rubber Layout of Chinese Tire Enterprises, 2016
China’s Rubber Hose & Belt Output and YoY Growth, 2012-2015
Revenue and YoY Growth of Rubber Hose-related Manufacturers in China, 2008-2015
Gross Margin of Rubber Hose Manufacturers in China, 2008-2015
Milestones in the Development of Sri Trang, 1987-2016
Revenue and Net Income of Sri Trang, 2008-2016
Gross Profit and Gross Margin of Sri Trang, 2014-2015
Operating Revenue of Sri Trang by Product, 2012-2016
Natural Rubber Operating Revenue of Sri Trang by Country, 2013-2016
Natural Rubber Sales Volume of Sri Trang by Country/Region, 2015-2016
Natural Rubber Sales Volume of Sri Trang by Product, 2010-2015
Natural Rubber Industry Chain of Sri Trang, 2016
Natural Rubber Planting Area Structure of Sri Trang, by the end of Mar 2016
Natural Rubber Tapping Area of Sri Trang, 2016-2022E
Natural Rubber Capacity of Sri Trang, 2005-2016
Layout of Sri Trang’s Main Downstream Natural Rubber Products, 2016
Natural Rubber Revenue of Sri Trang in China, 2011-2016
Sri Trang’s Sales Share in China’s Total Natural Rubber Import Volume, 2012-2015
Global Market Share of Sri Trang
Main Development Strategies of Sri Trang
Revenue and Net Income of TRUBB, 2008-2016
Subsidiaries of TRUBB by Business, 2016
Revenue Structure of TRUBB by Business, 20131-2016
Capacity of TRUBB by Business, 2013-2015
Sales Volume of TRUBB by Business, 2012-2013
Main Product Competitive Strategies of TRUBB
Sales Channels of TRUBB's Main Business Divisions, 2016
TRUBB’s Revenue from China, 2012-2015
Factories and Capacity of Thai Hua Rubber Public Company Ltd., 2016
Natural Rubber Capacityby Product of Thai Hua Rubber Public Company Ltd., 2016
Distribution of Von Bundit’s Affiliated Companies, 2016
Capacity of Von Bundit by Product, 2013-2015
Natural Rubber Capacity of Von Bundit by Factory, 2015
Global Development Events of Southland Rubber, 1999-2016
Capacity of Southland Rubber by Product, 2015-2016
Capacity of Southland Rubber by Factory, 2016
Revenue and Net Income of Hainan Rubber Group, 2008-2016
Operating Revenue Structure of Hainan Rubber Group by Product, 2012-2015
Operating Revenue of Hainan Rubber Group by Region, 2009-2015
Gross Margin of Hainan Rubber Group by Product, 2009-2015
Natural Rubber Output of Hainan Rubber Group by Channel, 2010-2015
Sales Volume and YoY Growth of Hainan Rubber Group, 2008-2015
Industry Chain Layout of Hainan Rubber Group, 2016
New Planting Area of Hainan Rubber Group’s Special Rubber Plantations, 2016-2020E
Supporting Shelterbelt Area of Hainan Rubber Group’s Special Rubber Plantations, 2016-2020E
Revenue and Net Income of Hainan Rubber Group, 2015-2020E
Revenue and Net Income of Sinochem International, 2008-2016
Operating Revenue Structure of Sinochem International by Business, 2015
Revenue of Sinochem International by Region, 2012-2015
Gross Margin of Sinochem International by Business, 2009-2015
Natural Rubber Revenue and Operating Cost of Sinochem International, 2009-2015
Natural Rubber Capacity of Sinochem International, 2010-2015
Natural Rubber Output and Sales Volume of Sinochem International, 2011-2016
Revenue and Net Income of Yunnan State Farms Group, 2012-2016
Operating Revenue Structure of Yunnan State Farms Group by Business, 2014-2015
Natural Rubber Planting Area, Tapping Area and Tapping Rate of Yunnan State Farms Group, 2012-2015
Natural Rubber Procurement Volume, Purchase Cost and Average Price of Yunnan State Farms Group, 2012-2015
Rubber Processing Capacity of Yunnan State Farms Group by Factory, 2016
Natural Rubber Capacity and Output of Yunnan State Farms Group by Product, 2012-2016
Natural Rubber Revenue and Structure of Yunnan State Farms Group by Product, 2012-2015
Natural Rubber Sales Volume and Structure of Yunnan State Farms Group by Sales Channel, 2012-2015
Major Overseas Subsidiaries of Guangdong Guangken Rubber Group
Revenue and YoY Growth of Rubber Companies of Guangdong Guangken Rubber Group, 2010-2016
Natural Rubber Revenue of Guangdong Guangken Rubber Group by Region, 2013-2016
Natural Rubber Procurement Volume and Price of Guangdong Guangken Rubber Group by Region, 2013-2016
Rubber Capacity and Output of Guangdong Guangken Rubber Group by Product, 2013-2016
Sales Volume and Revenue of Rubber Companies of Guangdong Guangken Rubber Group by Product/Region, 2013-2015
Major Rubber Projects Planned/under Construction of Guangdong Guangken Rubber Group, by the end of Mar 2016
Revenue and Net Income of Gaoshen Rubber, 2013-2016
Operating Revenue Structure of Gaoshen Rubber by Region, 2013-2015
Capacity and Output of Gaoshen Rubber by Factory, 2013-2015
Natural Rubber Sales Volume of Gaoshen Rubber by Product, 2013-2014
Name List and Revenue Contribution of Gaoshen Rubber’s Top 5 Clients, 2016H1
如果这份报告不能满足您的要求,我们还可以为您定制报告,请 留言说明您的详细需求。
|