|
|
|
报告导航:研究报告—
制造业—工业机械
|
|
2016-2020年全球及中国小微电机行业研究报告 |
 |
字数:2.8万 |
页数:116 |
图表数:164 |
|
中文电子版:8500元 |
中文纸版:4250元 |
中文(电子+纸)版:9000元 |
|
英文电子版:2250美元 |
英文纸版:2400美元 |
英文(电子+纸)版:2550美元 |
|
编号:ZHP045
|
发布日期:2016-09 |
附件:下载 |
 |
|
|
2015年,全球小微电机产量为175亿台,同比增长4.8%。未来在工业现代化、装备现代化的推动下,市场继续稳定增长。预计2016年产量可增长至184亿台,2020年接近230亿台。
中国是全球小微电机的第一大生产国,2015年生产小微电机124亿台,同比增长6.0%,全球占比70.9%。预计到2020年中国小微电机的产量接近170亿台,年均复合增长率(2016-2020年)在7.0%左右。
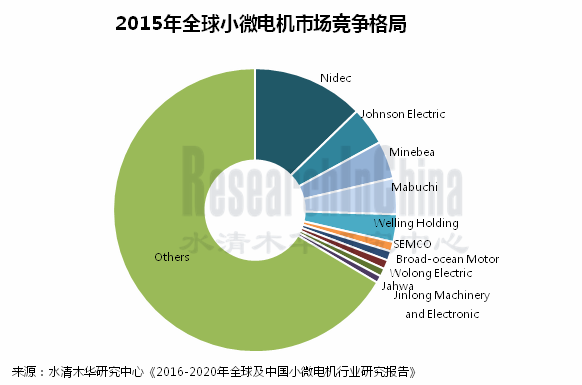
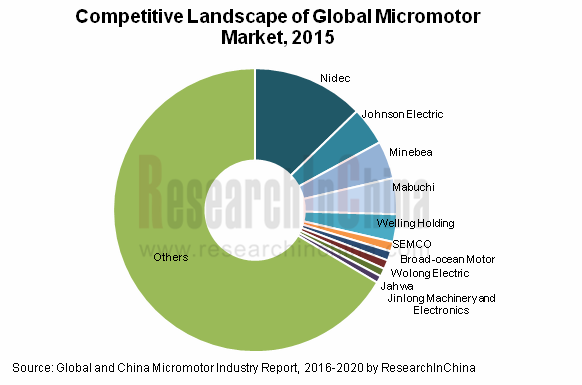
中国主要的小微电机制造商包括德昌电机、威灵控股、大洋电机、卧龙电气等。其中德昌电机作为中国最大的小微电机制造商,年销售收入在10亿美元以上,2015年全球占比为4.3%。
目前,中国小微电机主要应用在音响类产品、家用电器、汽车等传统领域(2015年需求占比合计为52.4%)。未来随着传统应用领域市场逐渐饱和,需求放缓,小微电机的主要增长动力将来自新能源汽车、可穿戴设备、机器人、无人机、智能家居等新兴领域。
信息产业:2015年中国移动终端用VCM出货量542kk,同比增长12.9%,全球占比45.9%。主要受智能手机、平板电脑等市场需求拉动。未来,随着手机、电脑等传统消费电子市场逐渐饱和,可穿戴设备将成为行业新的增长点,继续带动小微电机需求增长。预计2016-2020年中国可穿戴设备市场增速在25%以上。
汽车领域:2015年中国汽车用小微电机需求量为10.2亿台(全球占比24.9%,预计2020年可增长至16.2亿台),其中新能源汽车小微电机需求占比不足3%。2011-2015年,中国新能源汽车销量的年均复合增长为152.1%。未来几年,在政策支持下,新能源汽车市场继续保持高速增长。预计2016-2020年新能源汽车用小微电机市场增速在40%以上,2020年需求量可突破1.5亿台。
机器人:2015年全球工业机器人销量24.8万台,同比增长8.3%,服务机器人销量641.0万台,同比增长35.7%;对小微电机需求量合计约6,660万台,预计2020年可突破3.0亿台。2015年,中国工业机器人销量全球占比22.9%,而服务机器人销量全球占比仅在5.0%左右,市场增长空间较大。
消费级无人机:2015年全球消费级无人机销量超过20万台,而中国市场销量不足2万台。未来,随着低空领域逐渐开放,中国无人机市场将迎来快速增长期,市场增速在50%以上。
此外,中国的3D打印、智能家居、医疗设备、自动化实验室等政策支持的新兴市场,在未来几年也将保持较快的增速,可进一步拉动小微电机的需求增长。
水清木华研究中心《2016-2020年全球及中国小微电机行业研究报告》着重研究了以下内容:
 全球小微电机发展历程、市场规模、市场结构、竞争格局等情况; 全球小微电机发展历程、市场规模、市场结构、竞争格局等情况;
中国小微电机行业现状、市场规模、市场结构、竞争格局、进出口等情况;
主要上游产业(磁性材料、轴承等)市场规模、市场结构、发展趋势等情况;
下游信息产业、汽车、家用电器、机器人、无人机、3D打印、智能家居、医疗设备等领域的应用及市场情况;
全球11家、中国10家小微电机制造商经营情况、小微电机业务、在华发展等情况。
Global micromotor output stood at 17.5 billion units in 2015, a year-on-year increase of 4.8%. Thanks to campaigns to modernize the industry and equipment, the output is expected to rise to 18.4 billion units in 2016 and approach 23 billion units in 2020.
China, the world’s largest manufacturer of micromotors, produced 12.4 billion units in 2015, up 6.0% from a year ago, and accounting for 70.9% of the global total. The country’s micromotor output is predicted to be close to 17 billion units in 2020 at a CAGR of around 7.0% during 2016-2020.
Keymicromotor manufacturers in China includeJohnson Electric, Welling Holding Limited, Zhongshan Broad-Ocean Motor Co., Ltd., and Wolong Electric Group Co., Ltd. Johnson Electric, as the largest micromotor manufacturer in China, achieves annual revenue of over USD1 billion, with a global market share of 4.3% in 2015.
In China, micromotor finds its application primarily in traditional fields, such as audio products, household appliances, and automobile, which held a combined proportion of 52.4% in 2015. As traditional application markets gradually grow saturated, main drivers of micromotor growth will be emerging sectors like new energy vehicle, wearable device, robot, UAV, and smart home.
Information Industry: China’s shipments of VCM for mobile terminals were 542kk in 2015, up 12.9% year on year, occupying 45.9% of the world’s total, largely driven by smartphones and tablet PCs. With gradual saturation of the markets for traditional consumer electronics like smartphone and tablet PC, wearable devices will become a new growth area, further boosting demand for micromotor. The Chinese wearable device market is predicted to expand at annual growth rate of over 25%.
Automobile: In 2015, China’s demand for automotive micromotor was 1.02 billion units (24.9% of the global total, expected to rise to 1.62 billion units in 2020), less than 3% coming from new energy vehicle. New energy vehicle sales grew at a compound annual rate of 152.1% during 2011-2015 in China and, with the support of national and local policies, will maintain the strong growth momentum over the next couple of years. It is estimated that the market of micromotors for new energy vehicle will keep going up by over 40% annually during 2016-2020 with the demand exceeding 150 million units in 2020.
Robot: 248,000 industrial robots and 6.41 million service robots were sold globally in 2015, up 8.3% and 35.7% from a year earlier, respectively, together creating a demand of about 66.6 million micromotors (an estimate of more than 300 million units in 2020). In 2015, China accounted for 22.9% of the world’s industrial robot sales and only about 5.0% of service robot sales, indicating a huge space for growth.
Consumer-grade UAV: In 2015, global consumer-grade UAV sales exceeded 200,000 units, compared with only less than 20,000 units in China. As low-altitude airspace is gradually opened, the Chinese UAV market will usher in a period of rapid growth at a rate of over 50%.
In addition, the new markets for 3D printing, smart home, medical equipment, and automation laboratory supported by policies will also kick into high gear, further driving the demand for micromotors.
Global and China Micromotor Industry Report, 2016-2020 highlights the followings:
 Global micromotor industry (development history, market size, market structure, competitive landscape, etc.); Global micromotor industry (development history, market size, market structure, competitive landscape, etc.);
Micromotor industry in China (status quo, market size, market structure, competitive landscape, imports & exports, etc.);
Main upstream industries (magnetic materials, bearing, etc.), involving market size, market structure, development trends, etc.;
Downstream industries (information, automobile, household appliance, robot, UAV, 3D printing, smart home, medical equipment, etc.), involving application and market;
11 Global and 10 Chinese micromotor manufacturers (operation, micromotor business, development in China, etc.).
1 行业概述
1.1 定义
1.2 分类
1.3 产业链
1.4 行业存在的问题
1.5 技术趋势
2 全球小微电机市场
2.1 发展历程
2.2 市场规模
2.2.1 小微电机
2.2.2 VCM
2.3 市场结构
2.3.1 小微电机
2.3.2 VCM
2.4 竞争格局
2.4.1 小微电机
2.4.2 VCM
3 中国小微电机市场
3.1 行业现状
3.2 市场规模
3.2.1 小微电机
3.2.2 VCM
3.3 市场结构
3.4 进出口
3.4.1 进口
3.4.2 出口
3.5 竞争格局
3.5.1 小微电机
3.5.2 VCM
4 小微电机主要上游产业
4.1 磁性材料
4.1.1 市场规模
4.1.2 市场格局
4.1.3 发展趋势
4.2 轴承
4.2.1 全球
4.2.2 中国
5 小微电机下游应用
5.1 信息产业
5.1.1 小微电机在信息产业的应用
5.1.2 市场现状
5.2 汽车
5.2.1 小微电机在汽车领域的应用
5.2.2 市场现状
5.3 家用电器
5.3.1 小微电机在家用电器领域的应用
5.3.2 市场现状
5.4 机器人
5.4.1 小微电机在机器人上的应用
5.4.2 市场现状
5.5 无人机
5.5.1 小微电机在无人机领域的应用
5.5.2 市场现状
5.6 其他
5.6.1 3D打印
5.6.2 智能家居
5.6.3 医疗设备
5.6.4 自动化实验室
6 国外主要小微电机制造商
6.1 Nidec
6.1.1 公司简介
6.1.2 经营情况
6.1.3 小微电机业务
6.1.4 在华布局
6.2 美蓓亚
6.2.1 Profile
6.2.2 Operation
6.6.3 小微电机业务
6.2.4 Development in China
6.3 Mabuchi
6.3.1 公司简介
6.3.2 经营情况
6.3.3 小微电机业务
6.3.4 在华布局
6.4 LG Innotek
6.4.1 公司简介
6.4.2 经营情况
6.4.4 小微电机业务
6.5 其他
6.5.1 Tokyo Par
6.5.2 Mitsumi Electric
6.5.3 TDK
6.5.4 Hysonic
6.5.5 Jahwa
6.5.6 博泽
6.5.7 SEMCO
7 中国主要小微电机制造商
7.1 德昌电机
7.1.1 公司简介
7.1.2 经营情况
7.1.3 小微电机业务
7.2 威灵控股
7.2.1 公司简介
7.2.2 经营情况
7.2.3 小微电机业务
7.3 大洋电机
7.3.1 公司简介
7.3.2 经营情况
7.3.3 小微电机业务
7.4 方正电机
7.4.1 公司简介
7.4.2 经营情况
7.4.3 小微电机业务
7.5 卧龙电气
7.5.1 公司简介
7.5.2 经营情况
7.5.3 小微电机业务
7.5.4 发展战略
7.6 金龙机电
7.6.1 公司简介
7.6.2 经营情况
7.6.3 小微电机业务
7.7 其他
7.7.1 万盛智能
7.7.2 江苏富天江电子电器有限公司
7.7.3 杭州松下马达有限公司
7.7.4 三叶电机
1 Industry Overview
1.1 Definition
1.2 Classification
1.3 Industrial Chain
1.4 Problems
1.5 Technology Trends
2 Global Micromotor Market
2.1 Development History
2.2 Market Size
2.2.1 Micromotor
2.2.2 VCM
2.3 Market Structure
2.3.1 Micromotor
2.3.2 VCM
2.4 Competitive Landscape
2.4.1 Micromotor
2.4.2 VCM
3 Chinese Micromotor Market
3.1 Status Quo
3.2 Market Size
3.2.1 Micromotor
3.2.2 VCM
3.3 Market Structure
3.4 Import & Export
3.4.1 Import
3.4.2 Export
3.5 Competitive Landscape
3.5.1 Micromotor
3.5.2 VCM
4 Main Upstream Industries of Micromotor
4.1 Magnetic Materials
4.1.1 Market Size
4.1.2 Market Pattern
4.1.3 Development Trends
4.2 Bearing
4.2.1 Global
4.2.2 China
5 Applications of Micromotor
5.1 Information Industry
5.1.1 Application of Micromotor in Information Industry
5.1.2 Status Quo
5.2 Automobile
5.2.1 Application of Micromotor in Automobile
5.2.2 Status Quo
5.3 Household Appliance
5.3.1 Application of Micromotor in Household Appliance
5.3.2 Status Quo
5.4 Robot
5.4.1 Application of Micromotor in Robot
5.4.2 Status Quo
5.5 UAV
5.5.1 Application of Micromotor in UAV
5.5.2 Status Quo
5.6 Others
5.6.1 3D Printing
5.6.2 Smart Home
5.6.3 Medical Equipment
5.6.4 Automation Laboratory
6 Major Foreign Micromotor Manufacturers
6.1 Nidec
6.1.1 Profile
6.1.2 Operation
6.1.3 Micromotor Business
6.1.4 Presence in China
6.2 Minebea
6.2.1 Profile
6.2.2 Operation
6.6.3 Micromotor Business
6.2.4 Development in China
6.3 Mabuchi
6.3.1 Profile
6.3.2 Operation
6.3.3 Micromotor Business
6.3.4 Presence in China
6.4 LG Innotek
6.4.1 Profile
6.4.2 Operation
6.4.4 Micromotor Business
6.5 Others
6.5.1 Tokyo Par
6.5.2 Mitsumi Electric
6.5.3 TDK
6.5.4 Hysonic
6.5.5 Jahwa
6.5.6 Brose
6.5.7 SEMCO
7 Major Chinese Micromotor Manufacturers
7.1 Johnson Electric
7.1.1 Profile
7.1.2 Operation
7.1.3 Micromotor Business
7.2 Welling Holding Limited
7.2.1 Profile
7.2.2 Operation
7.2.3 Micromotor Business
7.3 Zhongshan Broad-Ocean Motor Co., Ltd.
7.3.1 Profile
7.3.2 Operation
7.3.3 Micromotor Business
7.4 Zhejiang Founder Motor Co., Ltd.
7.4.1 Profile
7.4.2 Operation
7.4.3 Micromotor Business
7.5 Wolong Electric Group Co., Ltd.
7.5.1 Profile
7.5.2 Operation
7.5.3 Micromotor Business
7.5.4 Development Strategy
7.6 Jinlong Machinery and Electronics Co., Ltd.
7.6.1 Profile
7.6.2 Operation
7.6.3 Micromotor Business
7.7 Others
7.7.1 Ningbo Vistart Intelligent Technology Co., Ltd.
7.7.2 F.G.L.S. Electric Co., Ltd.
7.7.3 Panasonic Appliances Motor (Hangzhou) Co., Ltd.
7.7.4 Guangzhou Mitsuba Motor Co., Ltd.
图:小微电机结构
表:小微电机(按功能)分类
表:小微电机(按结构)分类
图:小微电机产业链
表:小微电机区域特征
图:小微电机发展趋势
图:全球小微电机发展历程
图:2014-2020年全球小微电机市场规模
图:2013-2020年全球小微电机产量
图:2014-2020年全球VCM出货量
表:2015年全球主要VCM制造商销量
图:2015/2020年全球小微电机应用结构
图:2015-2016年全球VCM出货量结构
图:2015年全球小微电机市场竞争格局
图:2015年全球VCM市场竞争格局
图:2003-2015年中国小微电机制造商数量
图:2004-2015年中国小微电机行业毛利率
图:2003-2015年中国小微电机行业资产负债率
图:2014-2020年中国小微电机市场规模
图:2013-2020年中国小微电机产量
图:2014-2020年中国小微电机表观消费量
图:2015年中国小微电机家庭平均拥有量
图:2014-2020年中国VCM出货量
图:2014-2020年中国VCM市场规模
图:2014-2020年中国MEMS市场规模
图:2015年中国小微电机应用结构
图:2014-2016年中国微电机进口量及进口额
图:2015年中国(分地区)微电机进口量构成
图:2014-2016年中国微电机出口量及出口额
图:2015年中国(分地区)微电机出口量构成
表:2015年中国主要小微电机制造商产能及收入
表:2015年中国主要VCM制造商
图:2011-2016年全球铁氧体磁性材料产量
图:2011-2016年中国铁氧体磁性材料产量
图:2010-2020年中国稀土永磁性材料产量
图:中国磁性材料行业波特五力模型分析
图:中国磁性材料行业主要生产商
图:中国磁性材料市场发展趋势
图:2010-2020年全球轴承产量
图:2008-2020年全球轴承销量
图:2015年全球前十大轴承厂商
图:2011-2020年中国轴承行业营业收入及利润总额
图:2007-2020年中国轴承产量
图:2007-2020年中国滚动轴承产量及增长率
图:2015年中国前五大轴承厂商(按轴承收入)
图:2014-2020年全球电脑领域小微电机需求量
图:2014-2020年全球平板电脑出货量
图:2010-2020年全球PC出货量
表:2014-2016年全球智能手机出货量
表:2014-2016年中国智能手机出货量
图:2014-2019年全球主要可穿戴设备出货量
表:小微电机在汽车上的主要应用
图:2015-2020年全球汽车领域小微电机需求量
图:2015-2020年中国汽车领域小微电机需求量
图:采用轮毂电机的汽车构造
图:2010-2020年全球乘用车销量
图:2010-2020年全球商用车销量
图:2015年全球主要国家汽车销量
图:2011-2016年中国汽车销量
图:2014-2016年中国汽车经销商VIA (Vehicle Inventory Alert Index)
图:2015年中国乘用车销量结构(按国别)
图:2015年中国汽车市场竞争格局
图:2010-2020年中国洗衣机用小微电机市场规模
图:2010-2020年中国洗衣机用小微电机需求量
图:2015年中国洗衣机用小微电机市场竞争格局
图:2014-2020年中国家用空调领域小微电机需求量
图:2015年中国空调用小微电机市场竞争格局
图:2013-2015年中国家用空调销量
图:2011-2016年中国冰箱产量及增速
图:2011-2016年中国冰箱销量及增速
图:2012-2015年中国家电音响类产品零售额增速
表:机器人中小微电机的主要应用
图:2015-2020年全球机器人领域小微电机需求量
图:2010-2020年全球工业机器人销量
图:2013-2020年中国工业机器人销量
图:2015年中国工业机器人应用结构
图:2014-2020年全球服务机器人市场规模
图:2014-2020年全球服务机器人销量
图:2013-2018年全球服务机器人(分领域)需求量
图:2015-2020年中国服务机器人市场规模
图:2015-2020年全球消费级无人机领域小微电机需求量
表:无人机各系统主要构成及作用
图:2014-2020年中国无人机市场规模
图:2015年中国无人机(分产品)销量构成
图:2025年中国民用无人机应用结构
图:全球无人机市场竞争格局
图:无人机市场发展趋势
图:2012-2020年全球及中国3D打印市场规模
图:2015年全球3D打印应用结构
表:中国3D打印行业存在的问题
图:2015年全球主要国家智能家居市场规模及渗透率
图:2014-2020年中国智能家居渗透率
图:2011-2020年全球医疗设备市场规模
图:2006-2015财年Nidec净收入
图:2006-2015财年Nidec(分产品)净收入
表:2013-2015财年Nidec(分地区)收入及占比
图:Nidec主要小微电机生产基地
图:Nidec小微电机业务结构
表:Nidec在华贸易公司
表:Nidec在华主要小微电机生产基地
图:2009-2016财年Minebea员工人数
图:2009-2016财年Minebea收入及净利润
图:2013-2016财年Minebea收入业务结构
图:2012-2015财年Minebea收入地域结构
图:2015年Minebea中国生产基地
图:2011-2015财年Minebea中国收入及增速
图:Mabuchi全球布局
图:2006-2015年Mabuchi营业额及营业利润
表:2006-2018年Mabuchi发展规划
图:2011-2015年Mabuchi(分产品)营业额构成
图:2011-2015年Mabuchi(分地区)营业额构成
图:Mabuchi主要小微电机产品
图:2014-2015年Mabuchi汽车用小微电机营业额构成
图:2014-2015年Mabuchi消费领域小微电机营业额构成
图:2011-2015年Mabuchi在华销售额及增速
表:Mabuchi在华主要小微电机生产基地及产量
图:LG Innotek全球布局
图:2012-2016年LG Innotek销售收入及净利润
图:2013-2015年LG Innotek(分产品)销售收入构成
图:2015年LG Innotek主要汽车相关新产品
表:Tokyo Par相关信息
表:Mitsumi Electric相关信息
图:2007-2016年Mitsumi Electric销售收入
图:TDK全球营销网络
图:2006-2016财年TDK营业收入
图:2016财年TDK(分产品)营业收入构成
图:Hysonic主要产品
图:2006-2015年Hysonic营业收入及利润
图:2005-2015年Jahwa营业收入及利润
表:2011-2016年SEMCO收入与营业利润
图:2010-2015年SEMCO(分业务)营收
图:德昌电机全球生产基地分布
图:2011-2017财年德昌电机营业额及毛利
图:2011-2016财年德昌电机(分业务)营业额
图:2016财年德昌电机(分地区)营业额构成
表:德昌电机主要小微电机产品
表:德昌电机生产战略
图:威灵控股全球布局
图:2011-2015年威灵控股营业收入及净利润
图:2014-2015年威灵控股(分地区)营业收入构成
表:2014-2015年威灵控股小微电机销量及销售额
图:2009-2015年大洋电机员工数量
图:2009-2016年大洋电机营业收入及净利润
图:2013-2016年大洋电机(分产品)营业收入构成
图:2009-2016年大洋电机(分地区)营业收入构成
图:2009-2016年大洋电机(分产品)毛利率
图:2014-2016年大洋电机(分产品)小微电机销售收入
表:2014-2015年大洋电机小微电机产销量
图:2011-2016年方正电机营业收入及净利润
图:2014-2016年方正电机(分产品)营业收入构成
图:2014-2016年方正电机(分地区)营业收入构成
图:2014-2015年方正电机缝纫机电机产销量
图:2012-2016年卧龙电气营业收入及净利润
图:2012-2016年卧龙电气(分产品)营业收入
图:2012-2016年卧龙电气(分地区)营业收入
图:2015年卧龙电气(分产品)电机业务收入构成
图:2015年卧龙电气小微电机产销量
图:2011-2016年金龙机电营业收入及净利润
图:2014-2016年金龙机电(分产品)营业收入构成
图:2014-2016年金龙机电(分地区)营业收入构成
图:2011-2016年金龙机电微电机业务收入及毛利率
图:2013-2016年万盛智能营业收入及净利润
表:万盛智能小微电机产品及应用领域
图:2013-2016年万盛智能小微电机业务收入及增速
Structure of Micro Motor
Classification of Micro Motor (by Function)
Classification of Micro Motor (by Structure)
Micro Motor Industry Chain
Regional Characteristics of Micro Motors
Development Trends of Micro Motors
Development History of Global Micro Motors
Global Market Size of Micro Motors, 2014-2020E
Global Output of Micro Motors, 2013-2020E
Global VCM Shipments, 2014-2020E
Sales Volume of Major Global VCM Manufacturers, 2015
Global Demand Structure of Micro Motors by Application, 2015/2020E
Global VCM Shipment Structure, 2015-2016
Competitive Landscape of Global Micro Motor Market, 2015
Competitive Landscape of Global VCM Market, 2015
Number of Micro Motor Manufacturers in China, 2003-2015
Gross Margin of Micro Motor Industry in China, 2004-2015
Asset-liability Ratio of Micro Motor Industry in China, 2003-2015
China’s Micro Motor Market Size, 2014-2020E
China’s Micro Motor Output, 2013-2020E
Apparent Consumption of Micro Motors in China, 2014-2020E
Average Micro Motor Ownership of Chinese Households, 2015
China’s VCM Shipments, 2014-2020E
China’s VCM Market Size, 2014-2020E
China’s MEMS Market Size, 2014-2020E
Demand Structure of Micro Motors in China by Application, 2015
Import Volume and Value of Micro Motors in China, 2014-2016
Import Volume Structure of Micro Motors in China by Region, 2015
Export Volume and Value of Micro Motors in China, 2014-2016
Export Volume Structure of Micro Motors in China by Region, 2015
Capacity and Revenue of Major Micro Motor Manufacturers in China, 2015
Major VCM Manufacturers in China, 2015
Global Output of Ferrite Magnetic Material, 2011-2016
Output of Ferrite Magnetic Material in China, 2011-2016
Output of Rare-earth Permanent Magnetic Material in China, 2010-2020E
Porter's Five Forces Analysis of Magnetic Material Industry in China
Major Magnetic Material Manufacturers in China
Development Tends of Magnetic Material Market in China
Global Bearing Output, 2010-2020E
Global Bearing Sales, 2008-2020E
Global Top10 Bearing Manufacturers, (FY) 2015
Operating Revenue and Total Profit of Bearing Industry in China, 2011-2020E
China’s Bearing Output, 2007-2020E
Output and Growth Rate of Rolling Bearing in China, 2007-2020E
Top 5 Domestic Companies by Bearing Revenue in China, 2015
Global Demand for Micro Motor from Computers, 2014-2020E
Global Tablet PC Shipments, 2014-2020E
Global PC Shipments, 2010-2020E
Global Smartphone Shipments, 2014-2016
China’s Smartphone Shipments, 2014-2016
Global Shipments of Main Wearable Devices, 2014-2019E
Main Applications of Micro Motor in Automobile
Global Demand for Micro Motor in Automobiles, 2015-2020E
Demand for Micro Motor in Automobiles in China, 2015-2020E
Structure of Automobile that Adopts Wheel Hub Motors
Sales Volume of Passenger Cars Worldwide, 2010-2020
Sales Volume of Commercial Vehicles Worldwide, 2010-2020
Automobile Sales in Major Countries Worldwide, 2015
Automobile Sales in China, 2011-2016
VIA (Vehicle Inventory Alert Index) of Car Dealers in China, 2014-2016
Sales Structure of Passenger Cars (by Country) in China, 2015
Competitive Landscape of Chinese Automobile Market, 2015
Market Size of Micro Motor for Washers in China, 2010-2020
Demand for Micro Motor for Washers in China, 2010-2020E
Competitive Landscape of Micro Motor for Washers in China, 2015
Demand for Micro Motor in Household Air Conditioners in China, 2014-2020E
Competitive Landscape of Micro Motors for Household Air Conditioner in China, 2015
Sales Volume of Household Air Conditioners in China, 2013-2015
Output and Growth Rate of Refrigerators in China, 2011-2016
Sales Volume and Growth Rate of Refrigerators in China, 2011-2016
Growth Rate for Retail Sales of Household Appliances & Audio Products in China, 2012-2015
Main Applications of Micro Motor in Robots
Global Demand for Micro Motor in Robots, 2015-2020E
Global Sales Volume of Industrial Robots, 2010-2020E
Sales Volume of Industrial Robots in China, 2013-2020E
Demand Structure of Industrial Robots in China by Application, 2015
Global Service Robot Market Size, 2014-2020E
Global Service Robot Sales Volume, 2014-2020E
Global Demand for Service Robots by Field, 2013-2018E
Market Size of Service Robots in China, 2015-2020E
Global Demand for Micro Motors in Consumer-grade UAVs, 2015-2020E
Structure and Function of UAV’s Systems
China’s UAV Market Size, 2014-2020E
Sales Volume Structure of UAVs in China by Product, 2015
Demand Structure of Civilian UAVs in China by Application, 2025E
Competitive Landscape of UAVs Worldwide
Development Trends for UAVs
Global and Chinese 3D Printing Market Size, 2012-2020E
Global Demand Structure of 3D Printing by Application, 2015
Problems in 3D Printing Sector in China
Smart Home Market Size and Penetration of Major Countries Worldwide, 2015
Smart Home Penetration in China, 2014-2020E
Global Market Size of Medical Devices, 2011-2020E
Net Sales of Nidec, FY 2006- FY 2015
Net Sales of Nidec by Product, FY 2006- FY 2015
Revenue Structure of Nidec by Region, FY 2013- FY 2015
Nidec’s Major Production Bases of Micro Motors
Nidec’s Micro Motor Business Structure
Nidec’sTrade Companies in China
Nidec’s Major Micro Motor Production Bases in China
Number of Employees of Minebea, FY2009-FY2016
Net Sales and Net Income of Minebea, FY2009-FY2016
Revenue Structure of Minebea by Business, FY2013-FY2016
Revenue Structure of Minebea by Region, FY2012-FY2015
Minebea’s Production Bases in China, 2015
Minebea’s Revenue in China and Growth Rate, FY2011-FY2015
Mabuchi’s Global Presence
Revenue and Operating Income of Mabuchi, 2006-2015
Development Plan of Mabuchi, 2006-2018
Revenue Structure of Mabuchi by Product, 2011-2015
Revenue Structure of Mabuchi by Region, 2011-2015
Mabuchi’s Main Micro Motor Products
Mabuchi’s Revenue Structure of Micro Motor for Automobiles, 2014-2015
Mabuchi’s Revenue Structure of Micro Motors in Consumption, 2014-2015
Mabuchi’s Sales and Growth Rate in China, 2011-2015
Mabuchi’s Major Micro Motor Production Bases in China and Their Output
Global Presence of LG Innotek
Revenue and Net Income of LG Innotek, 2012-2016
Revenue Structure of LG Innotek by Product, 2013-2015
Main New Automobiles-related Products of LG Innotek, 2015
Profile of Tokyo Par
Profile of Mitsumi Electric
Revenue of Mitsumi Electric, 2007-2016
Global Marketing Network of TDK
Revenue of TDK, FY 2006- FY 2016
Revenue Structure of TDK by Product, FY 2016
Main Products of Hysonic
Revenue and Profits of Hysonic, 2006-2015
Revenue and Profits of Jahwa, 2005-2015
Revenue and Operating Income of SEMCO, 2011-2016
Revenue of SEMCO by Business, 2010-2015
Johnson Electric’s Global Distribution of Production Bases
Revenue and Gross Profits of Johnson Electric, FY 2011- FY 2017
Revenue of Johnson Electric by Business, FY 2011- FY 2016
Revenue Structure of Johnson Electric by Region, FY 2016
Johnson Electric’s Main Micro Motors
Johnson Electric’s Production Strategy
Welling Holding’s Global Presence
Revenue and Net Income of Welling Holding, 2011-2015
Revenue Structure of Welling Holding by Region, 2014-2015
Micro Motor Sales Volume and Value of Welling Holding, 2014-2015
Headcount of Broad-Ocean Motor, 2009-2015
Revenue and Net Income of Broad-Ocean Motor, 2009-2016
Revenue Structure of Broad-Ocean Motor by Product, 2013-2016
Revenue Structure of Broad-Ocean Motor by Region, 2009-2016
Gross Margin of Broad-Ocean Motor by Product, 2009-2016
Micro Motor Revenue of Broad-Ocean Motor by Product, 2014-2016
Micro Motor Output and Sales Volume of Broad-Ocean Motor, 2014-2015
Revenue and Net Income of Zhejiang Founder Motor, 2011-2016
Revenue Structure of Zhejiang Founder Motor by Product, 2014-2016
Revenue Structure of Zhejiang Founder Motor by Region, 2014-2016
Output and Sales Volume of Sewing Machine Motors of Zhejiang Founder Motor, 2014-2015
Revenue and Net Income of Wolong Electric, 2012-2016
Revenue of Wolong Electric by Product, 2012-2016
Revenue of Wolong Electric by Region, 2012-2016
Motor Revenue Structure of Wolong Electric by Product, 2015
Micro Motor Output and Sales Volume of Wolong Electric, 2015
Revenue and Net Income of Jinlong Machinery & Electronics, 2011-2016
Revenue Structure of Jinlong Machinery & Electronics by Product, 2014-2016
Revenue Structure of Jinlong Machinery & Electronics by Region, 2014-2016
Micro Motor Revenue and Gross Margin of Jinlong Machinery & Electronics, 2011-2016
Revenue and Net Income of Ningbo Vistart Intelligent Technology, 2013-2016
Micro Motor Products and Applications of Ningbo Vistart Intelligent Technology
Micro Motor Revenue and Growth Rate of Ningbo Vistart Intelligent Technology, 2013-2016
如果这份报告不能满足您的要求,我们还可以为您定制报告,请 留言说明您的详细需求。
|