|
|
|
报告导航:研究报告—
制造业—材料
|
|
2016-2020年全球及中国3D玻璃产业链研究报告 |
 |
字数:2.6万 |
页数:100 |
图表数:140 |
|
中文电子版:9000元 |
中文纸版:4500元 |
中文(电子+纸)版:9500元 |
|
英文电子版:2000美元 |
英文纸版:2200美元 |
英文(电子+纸)版:2300美元 |
|
编号:ZHP048
|
发布日期:2016-10 |
附件:下载 |
 |
|
|
3D玻璃主要是相对于传统的2D玻璃和2.5D玻璃来说,指无论是中间还是边缘都采用弧形设计的曲面玻璃,伴随柔性AMOLED产业发展而发展。
2016年,全球3D玻璃市场规模在1.9亿美元左右,预计同比增长60.0%以上。其中,中国市场规模约1.7亿元(约0.3亿美元),全球占比15.8%。未来几年,随着3D玻璃生产技术的成熟,以及在下游应用市场的渗透率逐渐提高,预计2016-2020年全球市场规模的年均复合增长率将达到102.1%。
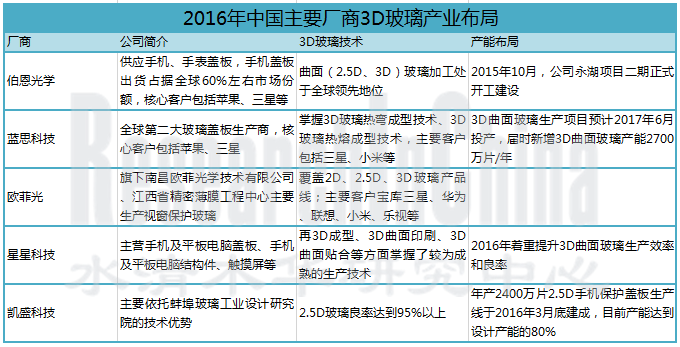
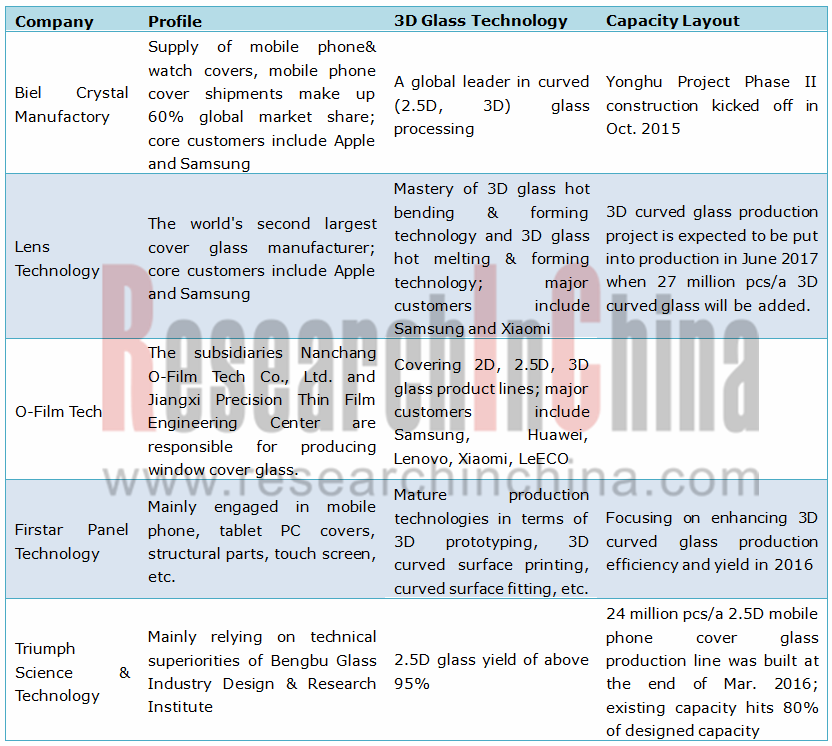
目前,中国3D玻璃市场处于寡头垄断竞争的状态,伯恩光学和蓝思科技合计占95.0%以上的市场份额。主要因为这两家企业在3D玻璃领域布局都比较早,已形成了成熟的生产工艺,且都拥有热弯机等先进的3D玻璃加工生产设备。
此外,受三星galaxy s6/s7以及小米5率先使用3D玻璃,以及苹果手机拟于2017年采用玻璃外壳等因素的拉动,国内多家企业开始布局3D玻璃领域,如欧菲光、为百科技、星星科技等。
3D玻璃主要应用在智能手机、可穿戴设备、VR、汽车等领域。其中,智能手机是目前最大的应用市场。
智能手机:2016年全球智能手机用3D玻璃需求量约700万片,中国需求量在100万片左右。目前,已有三星、LG、小米和vivo等手机厂商推出采用3D玻璃盖板或背板的智能手机。未来,随着主流手机制造商纷纷在智能手机上采用3D玻璃,其渗透率将由2015年的0.5%提升至2020年的23.1%。
可穿戴设备:3D玻璃的第二大应用领域,目前大部分应用在智能手表(相对成熟)领域。2015年,全球可穿戴设备出货量为7900万台,预计2016年可突破1亿台;2016-2020年的市场增速在20%以上;中国的可穿戴设备市场增速略高于全球平均水平。
VR:整个行业正处于起步阶段,对3D玻璃的需求相对较小,且主要集中在头戴式VR领域。2016年全球头戴式VR的出货量约300万台,约占整个VR设备出货量的30%。
水清木华研究中心《2016-2020年全球及中国3D玻璃产业链研究报告》着重研究了以下内容:
 全球3D玻璃的供给、需求、市场结构等情况; 全球3D玻璃的供给、需求、市场结构等情况;
中国3D玻璃的市场规模、市场结构、专利现状、市场价格、竞争格局、市场推动因素等情况;
3D玻璃生产材料(玻璃基板、抛光材料、贴合材料、油墨等)市场规模、竞争格局等情况
3D玻璃加工设备(热弯机、精雕机、平磨机等)市场规模、竞争现状、加工工艺等情况;
下游智能手机、可穿戴设备、VR等市场现状、对3D玻璃的需求等情况;
全球16家3D玻璃生产商的经营现状、3D玻璃业务等情况。
3D glass, mainly relative to traditional 2D glass and 2.5D glass, refers to curved glass with arc designeither in the middle or at the edge. It advances along with the development of flexible AMOLED industry.
In 2016,global 3D glass market is worth approximately USD190 million, with an estimated growth rate of over 60.0% year on year; the Chinese market contributes RMB170 million (about USD30 million) and occupies 15.8%. With the maturity of 3D glass production technology and higher penetration in the downstream application markets, the global market is expected to show a CAGR of 102.1%in 2016-2020.
The Chinese 3D glass market is now in a state of oligopolistic competition with more than 95.0% market share together seized by the early entrantsBiel Crystal Manufactory and Lens Technology that have developed mature production technologiesand advanced 3D glass processing & production equipment e.g. hot bending machine.
Besides, Samsung Galaxy S6/S7 and Xiaomi 5 pioneered in the use of 3D glass, and iPhoneintends to adopt glass shell in 2017. Driven by this, many domestic enterprises such as O-Film Tech, Weibai Technology and Firstar Panel Technology have made their presence in 3D glass field.
3D Glass Industrial Distribution of Major Chinese Companies, 2016
3D glass is primarily used in smartphone, wearable device, VR, automobile and other fields. Among them, smartphone is the biggest application market.
Smartphone: In 2016, global demand for smartphone 3D glass is approximately seven million pieces, including one million pieces from China. So far, Samsung, LG, Xiaomi and Vivo have launched smartphones with 3D cover glass or back glass. Along with the trend, the penetration of 3D glass is expected to rise from 0.5% in 2015 to 23.1% in 2020.
Wearable Device (the second largest application of 3D glass, mainly relatively mature smartwatch field): Global wearable device shipments reached 79 million units in 2015, are expected to outnumber 100 million units in 2016, and register a growth rate of more than 20% in 2016-2020. China’s wearable device market growth is slightly higher than the global average.
VR: The industry is in its infancy with relatively small demand for 3D glass and concentrated primarily in head-mounted VR. In 2016, global head-mounted VR shipments total three million units or so, accounting for roughly 30% of the total VR equipment shipments.
The report covers the following:
 Global 3D glass industry (supply, demand, market structure, etc.); Global 3D glass industry (supply, demand, market structure, etc.);
3D glass industry in China (market size/structure, patent, market price, competitive landscape, market driver, etc.);
3D glass production materials (glass substrate, polishing materials, coating materials, ink) (market size, competitive landscape, etc.);
3D glass processing equipment (hot bending machine, CNC engraving machine, flat grinding machine) (market size, competition, processing technology, etc.);
Applications (smartphone, wearable device, and VR)(market status, demand for3Dglass, etc.);
Sixteen 3D glass manufacturers worldwide (operation, 3D glass business, etc.)
第一章 3D玻璃概述
1.1 定义
1.2 优点
1.3 生产工艺
1.4 产业链
1.5 行业特性
1.5.1 周期性
1.5.2 季节性
1.5.3 区域性
1.5.4 加工壁垒高
第二章 全球3D玻璃产业
2.1 市场规模
2.1.1 供给
2.1.2 需求
2.2 市场结构
第三章 中国3D玻璃产业
3.1 市场现状
3.1.1 市场规模
3.1.2 市场结构
3.2 专利情况
3.2.1 总量
3.2.2 格局
3.3 竞争格局
3.4 市场价格
3.5 市场推动因素
第四章 3D玻璃生产材料
4.1玻璃基板
4.1.1 市场规模
4.1.2 竞争格局
4.2 抛光材料
4.2.1 市场现状
4.2.2 竞争格局
4.3 其它
4.3.1 贴合材料
4.3.2 油墨
第五章 3D玻璃加工设备
5.1 热弯机
5.1.1 市场规模
5.1.2 竞争现状
5.2 精雕机
5.2.1 市场规模
5.2.2 竞争现状
5.2.3 加工工艺
5.2.4 核心技术
5.3 平磨机
第六章 主要应用领域
6.1 智能手机
6.1.1 市场规模
6.1.2 3D玻璃手机屏幕的优势
6.1.3 手机屏幕的发展趋势
6.1.4 已采用3D玻璃的手机品牌
6.2 可穿戴设备
6.2.1 市场规模
6.2.2 3D玻璃在智能穿戴设备领域的应用
6.3 VR
6.3.1 市场规模
6.3.2 3D玻璃在VR领域的应用
第七章 3D玻璃主要生产商
7.1 蓝思科技
7.1.1 公司介绍
7.1.2 经营情况
7.1.3 3D玻璃业务
7.2 华映科技
7.2.1 公司简介
7.2.2 经营情况
7.2.3 3D玻璃业务
7.3 星星科技
7.3.1 公司简介
7.3.2 经营情况
7.3.3 3D玻璃业务
7.4 欧菲光
7.4.1 公司简介
7.4.2 经营情况
7.4.3 3D玻璃业务
7.5 凯盛科技
7.5.1 公司介绍
7.5.2 经营情况
7.5.3 3D玻璃业务
7.6 合力泰
7.6.1 公司简介
7.6.2 经营情况
7.6.3 3D玻璃业务
7.7 正达国际
7.7.1 公司简介
7.7.2 经营情况
7.7.3 3D玻璃业务
7.8 康宁
7.8.1 公司简介
7.8.2 经营情况
7.8.3 3D玻璃业务
7.9 瑞必达
7.9.1 公司介绍
7.9.2 经营情况
7.10 其他
7.10.1 伯恩光学
7.10.2 三星康宁精密玻璃
7.10.3 长信科技
7.10.4 信利国际
7.10.5 帝晶光电
7.10.6 康耀电子
7.10.7 劲胜精密
1. Overview of 3D Glass
1.1 Definition
1.2 Advantage
1.3 Production Process
1.4 Industry Chain
1.5 Industry Characteristics
1.5.1 Periodicity
1.5.2 Seasonality
1.5.3 Regionality
1.5.4 High Processing Barrier
2. Global 3D Glass Industry
2.1 Market Size
2.1.1 Supply
2.1.2 Demand
2.2 Market Structure
3. 3D Glass Industry in China
3.1 Market
3.1.1 Market Size
3.1.2 Market Structure
3.2 Patent
3.2.1 Total Quantity
3.2.2 Pattern
3.3 Competitive Landscape
3.4 Market Price
3.5 Market Driver
4. 3D Glass Production Material
4.1 Glass Substrate
4.1.1 Market Size
4.1.2 Competitive Landscape
4.2 Polishing Material
4.2.1 Market Status
4.2.2 Competitive Landscape
4.3 Other
4.3.1 Coating Materials
4.3.2 Ink
5. 3D Glass Processing Equipment
5.1 Hot Bending Machine
5.1.1 Market Size
5.1.2 Competition
5.2 CNC Engraving Machine
5.2.1 Market Size
5.2.2 Competition
5.2.3 Processing Technology
5.2.4 Core Technology
5.3 Flat Grinding Machine
6. Main Applications
6.1 Smartphone
6.1.1 Market Size
6.1.2 Advantages of 3D Glass Phone Screen
6.1.3 Trends of Phone Screen
6.1.4 Mobile Phone Brands Adopting 3D Glass
6.2 Wearable Device
6.2.1 Market Size
6.2.2 3D Glass Application
6.3 VR
6.3.1 Market Size
6.3.2 3D Glass Application
7. Key Players
7.1 Lens Technology
7.1.1 Profile
7.1.2 Operation
7.1.3 3D Glass Business
7.2 CPT Technology
7.2.1 Profile
7.2.2 Operation
7.2.3 3D Glass Business
7.3 Firstar Panel Technology
7.3.1 Profile
7.3.2 Operation
7.3.3 3D Glass Business
7.4O-Film Tech
7.4.1 Profile
7.4.2 Operation
7.4.3 3D Glass Business
7.5 Triumph Science & Technology
7.5.1 Profile
7.5.2 Operation
7.5.3 3D Glass Business
7.6 Holitech Technology
7.6.1 Profile
7.6.2 Operation
7.6.3 3D Glass Business
7.7 G-Tech Optoelectronics
7.7.1 Profile
7.7.2 Operation
7.7.3 3D Glass Business
7.8 Corning
7.8.1 Profile
7.8.2 Operation
7.8.3 3D Glass Business
7.9 RBD Technology
7.9.1 Profile
7.9.2 Operation
7.10 Other
7.10.1 Biel Crystal Manufactory
7.10.2 Samsung Corning Precision Glass
7.10.3 Wuhu Token Sciences
7.10.4 Truly International
7.10.5Shenzhen DJN Optronics
7.10.6Henan Comyoung Electronics
7.10.7 JANUS (Dongguan) Precision Components
图:2D/2.5D/3D玻璃形状差异
表:2D玻璃与3D玻璃性能比较
表:未来计划使用无线充电的移动终端
表:玻璃加工工艺
图:2.5D玻璃加工工艺
图:3D玻璃成型流程
图:3D玻璃产业链
图:3D玻璃产业链竞争格局
表:3D玻璃主要加工壁垒
图:2015-2020年全球3D玻璃市场规模
图:2015-2020年全球3D玻璃渗透率
图:2015-2020年全球AMOLED出货量
图:2015-2020年全球3D玻璃需求量
图:2015-2020年全球3D玻璃(分应用领域)市场规模构成
图:2016-2020年中国3D玻璃市场规模
图:2016-2020年中国3D玻璃渗透率
图:2016-2020年中国3D玻璃(分应用领域)市场规模构成
图:2010-2020年中国3D玻璃专利申请量
图:截止2016年6月主要3D玻璃厂商在中国的专利申请量
表:主要厂商3D玻璃技术路线
表:2016年中国主要盖板玻璃厂商出货量
图:2015年中国3D玻璃市场竞争格局
表:2016年中国主要厂商3D玻璃布局
图:2016年中国不同手机玻璃的市场价格
图:2016-2020年中国3D手机盖板玻璃市场价格走势
图:2014-2025年全球无线充电市场规模
图:AMOLED+3D玻璃实现手机外观革命
图:2015年3D玻璃成本结构
图:2014-2020年全球玻璃基板需求量
图:2013-2020年中国玻璃基板需求量
图:2013-2020年中国玻璃基板供应量
图:2015年中国玻璃基板市场竞争格局
图:稀土抛光材料中稀土元素应用比重
表:2015年中国稀土抛光粉的主要应用领域
表:2015年中国主要抛光材料企业产能
图:2010-2020年中国油墨产量
表:热弯处理工艺
图:2015-2020年全球3D玻璃用热弯机需求量
图:2015-2020年全球3D玻璃用热弯机市场规模
图:2016-2020年中国3D玻璃用热弯机需求量
图:2016-2020年中国3D玻璃用热弯机需求量占全球比重
表:中国主要厂商热弯机拥有量
图:2015-2020年全球3D玻璃用五轴精雕机需求量
图:2015-2020年全球3D玻璃用五轴精雕机市场规模
图:2016-2020年中国3D玻璃用五轴精雕机需求量
表:中国主要CNC精雕机及相关零部件厂商
图:双金属压铸加工时间
表:全球主要数控系统供应商
图:2014年中国数控系统市场竞争格局
表:主要数控系统制造商产品线
表:国内外主要数控机床电主轴生产商
图:光学玻璃平磨抛光工序
图:2D玻璃平磨抛光机
图:2.5D/3D玻璃平磨抛光机
图:2008-2020年全球智能手机出货量及增速
图:2015-2020年全球智能手机(按屏幕尺寸)出货量构成
图:2015-2020年全球智能手机显示屏出货量构成
图:2015年主要智能手机厂商采用的显示屏类型
表:2015-2016年全球智能手机面板主要厂商出货量
表:2015年全球智能手机面板厂商客户配套
图:2014-2016年全球智能手机市场竞争格局
表:2014-2015年中国主要厂商智能手机出货量
表:2016年中国主要厂商智能手机出货量
图:2015-2016年中国主要智能手机面板出货量
图:2015-2016年中国手机AMOLED的应用情况
表:主要曲面手机类型
表:智能手机前后盖组合设计方式
表:智能手机前后盖设计趋势
图:2015-2020年全球智能手机领域3D盖板玻璃渗透率
图:金属边框+玻璃机身的Galaxy S7结构
图:摩托罗拉Shatter Shield结构
表:2016年使用3D玻璃的手机品牌
图:2015-2020年全球主要智能手机厂商采用AMOLED的比例
图:2016-5-2016年全球智能手机用3D玻璃需求量
图:2016-2020年中国智能手机用3D玻璃需求量
图:2015-2020年全球可穿戴设备出货量
表:2015/2020年全球可穿戴设备(分产品)出货量
表:2015-2016年全球可穿戴设备市场竞争格局
图:2012-2020年中国可穿戴设备市场规模
表:2014-2015年中国可穿戴设备主要厂商出货量
图:2014-2024年全球可穿戴设备面板出货量及增速
图:2015-2020年全球可穿戴设备AMOLED渗透率
图:2016-2020年全球可穿戴设备3D玻璃需求量
图:VR系统结构
图:2016-2020年头戴式VR市场占比
图:2016-2020年全球VR市场规模
图:2016-2020年全球VR硬件出货量
表:VR的应用领域
图:2014-2016年国内VR行业融资情况
图:2016-2020年中国VR用户规模
图:2016-2020年中国VR硬件设备市场规模
图:2016-2020年中国VR硬件设备出货量
图:中国主要VR产品竞争格局
表:采用AMOLED屏的主流VR产品
图:2016-2020年AMOLED在头戴式VR领域的渗透率
图:2016年蓝思科技股权结构
图:2012-2016年蓝思科技营业收入及净利润
图:2012-2016年蓝思科技(分产品)营业收入构成
图:2016蓝思科技弧形玻璃盖板产量
图:2016年华映科技股权结构
图:2012-2016年华映科技营业收入及净利润
图:2014-2016年蓝思科技(分业务)营业收入构成
图:2014-2016年蓝思)(分地区)营业收入构成
表:2015年蓝思科技主要客户销售额及占比
图:2014-2016年科立视营业收入及净利润
图:2015-2017年华映科技3D玻璃产能
图:2016年星星科技股权结构
图:2013-2016年星星科技营业收入及净利润
图:2014-2016年星星科技(分产品)营业收入构成
图:2014-2015星星科技(分销售形式)营业收入构成
表:2016年星星科技拟建生产线
图:2016年欧菲光股权结构
图:2012-2016年欧菲光营业收入及净利润
图:2014-2016年欧菲光(分产品)营业收入构成
图:2014-2016年欧菲光(分地区)营业收入构成
图:2013-2016年欧菲光触控显示类产品收入及增速
图:2016年凯盛科技股权结构
图:2013-2016年凯盛科技营业收入及净利润
图:2014-2016年凯盛科技(分产品)营业收入构成
图:2014-2016年凯盛科技(分地区)营业收入构成
图:2016年合力泰股权结构
图:2013-2016年合力泰营业收入及净利润
图:2014-2016年合力泰(分产品)营业收入构成
图:2014-2016年合力泰(分地区)营业收入构成
图:2012-2016年正达国际营业收入及净利润
图:2012-2015年正达国际(分地区)营业收入构成
图:2013-2016年康宁营业收入及净利润
表:2013-2015年康宁(分业务)营业收入构成
表:2013-2015年康宁(分地区)营业收入构成
图:康宁GorillaGlass4跌落测试
图:2013-2016年瑞必达营业收入及净利润•
图:2014-2015年瑞必达(分产品)营业收入构成
图:2016年伯恩光学弧形玻璃盖板产量
图:2013-2016年长信科技营业收入及净利润
图:2014-2016年信利国际营业收入及净利润
图:2014-2015年信利国际(分产品)营业收入构成
图:2014-2015年信利国际(分地区)营业收入构成
图:劲胜精密主要产品
图:2011-2016年劲胜精密营业收入及净利润
图:2012-2016年劲胜精密消费电子精密结构件业务收入
Shape Difference between 2D/2.5D/3D Glass
Performance Comparison between 2D Glass and 3D Glass
Mobile Terminals Using Wireless Charging in Future
Glass Processing Technology
2.5D Glass Processing Technology
3D Glass Molding Process
3D Glass Industry Chain
Competitive Landscape of 3D Glass Industry Chain
Main 3D Glass Processing Barriers
Global 3D Glass Market Size, 2015-2020E
Global 3D Glass Penetration Rate, 2015-2020E
Global AMOLED Shipments, 2015-2020E
Global 3D Glass Demand, 2015-2020E
Global 3D Glass Market Size Structure (by Application), 2015-2020E
China's 3D Glass Market Size, 2016-2020E
China's 3D Glass Penetration Rate, 2016-2020E
China's 3D Glass Market Size Structure (by Application), 2016-2020E
Applications for 3D Glass Patents in China, 2010-2020E
Applications of Major Manufacturers for 3D Glass Patents in China, by Jun 2016
3D Glass Technical Roadmap of Major Manufacturers
Shipments of Major Cover Glass Manufacturers in China, 2016
Competitive Landscape of Chinese 3D Glass Market, 2015
3D Glass Layout of Major Manufacturers in China, 2016
Market Prices of Different Mobile Phone Glass in China, 2016
Market Prices of 3D Mobile Phone Cover Glass in China, 2016-2020E
Global Wireless Charging Market Size, 2014-2025E
Mobile Phone Appearance Revolution by AMOLED+3D Glass
Cost Structure of 3D Glass, 2015
Global Glass Substrate Demand, 2014-2020E
China’s Glass Substrate Demand, 2013-2020E
China’s Glass Substrate Supply, 2013-2020E
Competitive Landscape of Chinese Glass Substrate Market, 2015
Application Proportion of Rare-earth Elements in Rare-earth Polishing Materials
Major Applications of Rare-earth Polishing Powder in China, 2015
Capacity of Major Polishing Material Enterprises in China, 2015
China’s Ink Output, 2010-2020E
Hot Bending Process
Global Demand for 3D Glass-use Hot Bending Machine, 2015-2020E
Global 3D Glass-use Hot Bending Machine Market Size, 2015-2020E
China’s Demand for 3D Glass-use Hot Bending Machine, 2016-2020E
Global Share of China’s Demand for 3D Glass-use Hot Bending Machine, 2016-2020E
Hot Bending Machine Ownership of Major Manufacturers in China
Global Demand for 3D Glass-use Five-axis CNC Engraving Machine, 2015-2020E
Global 3D Glass-use Five-axis CNC Engraving Machine Market Size, 2015-2020E
China’s Demand for 3D Glass-use Five-axis CNC Engraving Machine, 2016-2020E
Major Manufacturers of CNC Engraving Machine and Related Parts in China
Processing Time of Bi-metal Die-casting
Global Major CNC System Suppliers
Competitive Landscape of Chinese CNC System Market, 2014
Product Lines of Major CNC System Manufacturers
Domestic and Foreign Major CNC Machine Tool Electric Spindle Manufacturers
Optical Glass Grinding and Polishing Process
2D Glass Grinding and Polishing Machine
2.5D/3D Glass Grinding and Polishing Machine
Global Smartphone Shipments and Growth Rate, 2008-2020E
Global Smartphone Shipments Structure (by Screen Size), 2015-2020E
Global Smartphone Display Shipment Structure, 2015-2020E
Types of Display Adopted by Major Smartphone Vendors, 2015
Shipments of Global Major Smartphone Panel Vendors, 2015-2016
Customers of Global Smartphone Panel Vendors, 2015
Competitive Landscape of Global Smartphone Market, 2014-2016
Smartphone Shipments of Major Vendors in China, 2014-2015
Smartphone Shipments of Major Vendors in China, 2016
Shipments of Main Smartphone Panels in China, 2015-2016
Applications of Mobile Phone AMOLED in China, 2015-2016
Main Types of Curved-screen Mobile Phones
Smartphone Front and Back Cover Combination Design Modes
Smartphone Front and Back Cover Design Trends
Penetration Rate of 3D Cover Glass in Global Smartphone Field, 2015-2020E
Structure of Galaxy S7 with Metal Frame + Glass Body
Motorola’s Shatter Shield Structure
Mobile Phone Brands Using 3D Glass, 2016
Proportion of Global Major Smartphone Manufacturers Using AMOLED, 2015-2020E
Global Demand for Smartphone-use 3D Glass, 2015-2016
China’s Demand for Smartphone-use 3D Glass, 2016-2020E
Global Wearable Device Shipments, 2015-2020E
Global Wearable Device Shipments (by Product), 2015/2020E
Competitive Landscape of Global Wearable Device Market, 2015-2016
China’s Wearable Device Market Size, 2012-2020E
Shipments of Major Wearable Device Vendors in China, 2014-2015
Global Wearable Device Panel Shipments and Growth Rate, 2014-2024
Penetration Rate of AMOLED in Global Wearable Devices, 2015-2020E
Global Demand of 3D Glass for Wearable Devices, 2016-2020E
Structure of VR System
Market Share of Headset VR, 2016-2020E
Global VR Market Size, 2016-2020E
Global VR Hardware Shipments, 2016-2020E
Applications of VR
Financing in Domestic VR Industry, 2014-2016
China’s VR User Scale, 2016-2020E
China’s VR Hardware Equipment Market Size, 2016-2020E
China’s VR Hardware Equipment Shipments, 2016-2020E
Competitive Landscape of Major VR Products in China
Mainstream VR Products Using AMOLED Screens
Penetration Rate of AMOLED in Headset VR Field, 2016-2020E
Equity Structure of Lens Technology, 2016
Revenue and Net Income of Lens Technology, 2012-2016
Revenue Structure of Lens Technology,(by Product), 2012-2016
Curved-glass Cover Output of Lens Technology, 2016
Equity Structure of CPT Technology, 2016
Revenue and Net Income of CPT Technology, 2012-2016
Revenue Structure of CPT Technology (by Business), 2014-2016
Revenue Structure of CPT Technology (by Region), 2014-2016
Revenue of CPT Technology from Major Clients and % of Total Revenue, 2015
KMTC’s Revenue and Net Income, 2014-2016
3D Glass Capacity of CPT Technology, 2015-2017
Equity Structure of Firstar Panel Technology, 2016
Revenue and Net Income of Firstar Panel Technology, 2013-2016
Revenue Structure of Firstar Panel Technology (by Product), 2014-2016
Revenue Structure of Firstar Panel Technology (by Sales Mode), 2014-2015
Proposed Production Lines of Firstar Panel Technology, 2016
Equity Structure of O-Film Tech, 2016
Revenue and Net Income of O-Film Tech, 2012-2016
Revenue Structure of O-Film Tech (by Product), 2014-2016
Revenue Structure of O-Film Tech (by Region), 2014-2016
Touch DisplayRevenue and Growth Rate of O-Film Tech, 2013-2016
Equity Structure of Triumph Science & Technology, 2016
Revenue and Net Income of Triumph Science & Technology, 2013-2016
Revenue Structure of Triumph Science & Technology (by Product), 2014-2016
Revenue Structure of Triumph Science & Technology (by Region), 2014-2016
Equity Structure of Holitech Technology, 2016
Revenue and Net Income of Holitech Technology, 2013-2016
Revenue Structure of Holitech Technology (by Product), 2014-2016
Revenue Structure of Holitech Technology (by Region), 2014-2016
Revenue and Net Income of G-Tech Optoelectronics, 2012-2016
Revenue Structure of G-Tech Optoelectronics (by Region), 2012-2015
Revenue and Net Income of Corning, 2013-2016
Revenue Structure of Corning (by Business), 2013-2015
Revenue Structure of Corning (by Region), 2013-2015
Corning’s GorillaGlass4 Drop Tests
Revenue and Net Income of RBD, 2013-2016
Revenue Structure of RBD (by Product), 2014-2015
Curved Glass Cover Output of Biel Crystal Manufactory, 2016
Revenue and Net Income of Wuhu Token Sciences, 2013-2016
Revenue and Net Income of Truly, 2014-2016
Revenue Structure of Truly (by Product), 2014-2015
Revenue Structure of Truly (by Region), 2014-2015
Main Products of JANUS (Dongguan) Precision Components
Revenue and Net Income of JANUS (Dongguan) Precision Components, 2011-2016
Revenue from Consumer Electronics Precision Structural Parts of JANUS (Dongguan) Precision Components, 2012-2016
如果这份报告不能满足您的要求,我们还可以为您定制报告,请 留言说明您的详细需求。
|