|
|
|
报告导航:研究报告—
制造业—汽车
|
|
2016-2020年全球及中国轮胎行业研究报告 |
 |
字数:3.4万 |
页数:232 |
图表数:317 |
|
中文电子版:9000元 |
中文纸版:4500元 |
中文(电子+纸)版:9500元 |
|
英文电子版:2500美元 |
英文纸版:2700美元 |
英文(电子+纸)版:2800美元 |
|
编号:CYH057
|
发布日期:2017-01 |
附件:下载 |
 |
|
|
2016年,在全球汽车市场稳步增长以及中国汽车快速市场增长的刺激下,轮胎市场迎来弱复苏,全球轮胎市场出货量同比增长2%至19.63亿条;中国汽车轮胎产量同比微增1.2%至5.72亿条,预计2017-2020年中国汽车轮胎市场增速在4%左右。
开工率方面,2016年中国市场回升明显,尤其是10月以后,轮胎开工率呈现出淡季不降反升的态势,12月初,全钢胎和半钢胎轮胎厂开工率分别达到72.7%、73.4%,较上年同期分别高出10.5和7.5个百分点。
价格方面,受原材料天然橡胶价格上涨等影响,2016下半年开始,中国轮胎价格止跌企稳,大部分轮胎企业发布涨价通知,米其林、普利司通、马牌、倍耐力、固特异等国际一线品牌生产商也都已在12月底宣布提价。2017年伴随着天胶价格看涨的趋势,轮胎也将迎来新一轮价格提升期。
受美国轮胎“双反”等贸易摩擦影响,2015年中国轮胎出口严重受挫,全年汽车轮胎出口量同比下滑4.12%。2016年出口量有所恢复,1-11月,轮胎出口总量同比增长7.3%,但出口美国市场仍处于下滑的状态。2017年1月,美国将对中国卡客车“双反”做出终裁,同时美国新任总统川普的回笼政策等也对中国轮胎出口带来压力,预计2017年出口美国市场仍不乐观。
企业方面,普利司通、米其林、固特异、德国大陆和倍耐力位居全球前五位。在中国汽车市场快速发展的机遇下,全球主要轮胎巨头均已在中国布局生产基地,近两年扩产投资进一步加剧,如德国大陆集团2015年11月在合肥新建三期项目,将在华年产能提高至1400万条/年;固特异2016年11月开工扩建大连普兰工厂(新增产能500万条/年)。
为规避双反及贸易摩擦对出口的影响,中国主要本土生产商则开始加快海外布局,如位居全球第10,中国第1位的中策集团已在泰国建立轮胎工厂;玲珑集团泰国工厂一期于2016年投产,二期在建; 2016年7月双钱轮胎也在泰国开建首个海外工厂。
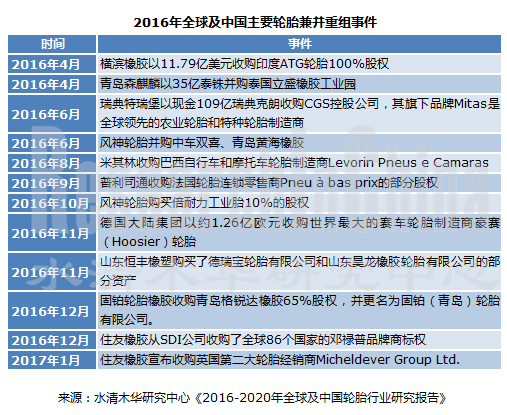
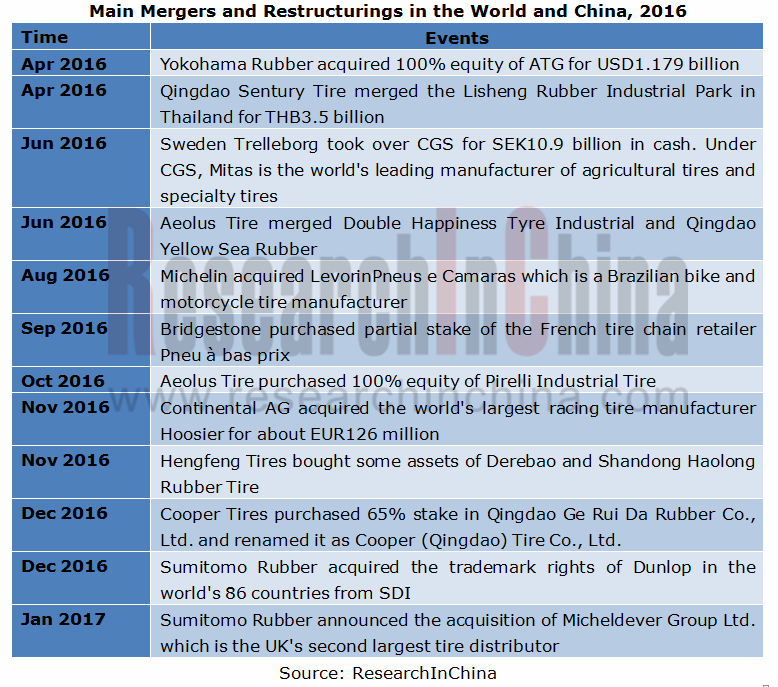
另外, 2016年全球及中国轮胎企业的兼并、重组事件增多,如:横滨收购印度ATG轮胎、风神收购黄海橡胶和中车双喜、恒丰买下德瑞宝轮胎和山东昊龙橡胶轮胎资产等。2017年企业整合趋势将更加明显。
水清木华研究中心《2016-2020年全球及中国轮胎行业研究报告》着重研究了以下内容:
 全球汽车市场与产业发展情况及趋势等; 全球汽车市场与产业发展情况及趋势等;
中国汽车市场与产业发展情况及趋势等;
全球轮胎市场发展情况、前30强企业排名以及发展趋势等;
中国与美国轮胎市场规模、前10强企业收入及产量排名、进出口、子午轮胎市场发展情况与趋势等;
天然橡胶、合成橡胶和炭黑等轮胎主要原材料市场发展、价格走势以及发展趋势等;
27家轮胎重点企业经营情况及发展战略等。
In 2016, the steady growth in the global automobile market and the rapid growth of Chinese automobile market stimulated the tire market to recover slightly. The global tire shipment increased by 2% year on year to 1.963 billion, while China's automotive tire output edged up 1.2% to 572 million. In 2017-2020, Chinese automotive tire market is expected to grow by approximately 4%.
The operating rate of the Chinese market rebounded significantly in 2016, especially showed an uptrend in the off-season after October; in early December, the operating rates of all-steel tire and semi-steel tire plants stayed at 72.7% and 73.4% respectively, 10.5 and 7.5 percentage points higher than the same period last year each.
Under the impact of rising natural rubber (which is a raw material) price, China’s tire price has stopped falling to stabilize since the second half of 2016. Most tire companies announced to raise prices, for instance, Michelin, Bridgestone, Continental, Pirelli, Goodyear and other international first-tier brand manufacturers declared price hike at the end of December. Along with the bullish trend of the natural rubber price, tires will see a new round of price increase in 2017.
Due to anti-dumping and countervailing investigations launched by the United States, China's tire export suffered a serious setback in 2015, and the annual export volume of automotive tires dropped 4.12% year on year. The figure restored in 2016, and increased by 7.3% year on year from January to November, but the export to the US market declined. The United States will make the final ruling about anti-dumping and countervailing investigations on China's trucks and buses as well as the austerity policy of the President-elect will put pressure on China's tire export in January 2017, so the export to the US market in 2017 is still not optimistic.
As for enterprises, Bridgestone, Michelin, Goodyear, Continental and Pirelli rank the top five in the world. Amid the fast-growing Chinese automobile market, the world's major tire giants have deployed production bases in China and further increased investment in expansion over the recent two years, for example, Continental started its Phase III project in Hefei in November 2015 so as to level up the capacity in China to 14 million tyres/a, Goodyear conducted the expansion of Dalian Plant in November 2016 with a new capacity of 5 million tyres/a.
In a bid to avoid the influence of anti-dumping and countervailing investigations launched as well as trade friction by the United States on export, China's major local manufacturers have accelerated the overseas layout, such as the world's 10th-ranked and China's first-ranked Hangzhou Zhongce Rubber has set up a tire factory in Thailand, Linglong Tire’s Thai Factory Phase I was put into operation in 2016 and Phase II is under construction, Double Coin opened its first overseas factory in Thailand in July 2016.
In addition, the mergers and restructurings of global and Chinese tire companies swelled in 2016, like: Yokohama Rubber acquired ATG; Aeolus Tire took over Yellow Sea Rubber and Double Happiness Tyre Industrial;Hengfeng Tires bought the assets of Derebao and Shandong Haolong Rubber Tire. In 2017, the corporate integration trend will be more obvious.
The report highlights the following:
 Development, trend, etc. of global automobile industry and market; Development, trend, etc. of global automobile industry and market;
Development, trend, etc. of Chinese automobile industry and market;
Development of global tire market, ranking of top 30 companies, development trend, etc.;
Tire market size, ranking of top 10 enterprises by revenue and output, import and export, radial tire market development and trend, etc. in China and the United States;
Market development, price trend and development trend of major tire raw materials such as natural rubber, synthetic rubber, carbon black and the like;
Operation and development strategies of 27 key tire enterprises.
第一章 全球汽车市场与产业
1.1 全球汽车市场
1.2 美国汽车市场
1.3 日本与巴西汽车市场
1.4 德国、英国、法国汽车市场
1.5 韩国与意大利汽车市场
第二章 中国汽车市场与产业
2.1 中国汽车市场概况
2.2 中国汽车市场近况
2.3 中国汽车市场分析
第三章 全球轮胎市场
3.1 全球轮胎市场规模
3.2 全球轮胎产业排名
3.3 美国轮胎市场
3.3.1 美国轮胎市场规模
3.3.2 美国轮胎分销商排名
3.3.3 美国轮胎市场主要厂家市场占有率
3.3.4 美国OTR市场主要厂家市场占有率
3.3.5 美国OE轮胎市场分析
3.3.6 北美汽车轮胎产业
3.4 中国轮胎市场
3.5 中国轮胎产业
3.6 中国轮胎出口
3.7 中国全钢子午胎产业
3.8 中国轮胎价格
3.9 中国轮胎市场主要厂家市场占有率
3.10 中国轮胎十大厂家
3.11 中美轮胎反倾销
第四章 原材料市场
4.1天然橡胶
4.1.1 全球天然橡胶市场
4.1.2 中国天然橡胶市场
4.1.3 天然橡胶价格
4.1.4 中国轮胎企业布局天然橡胶
4.2 合成橡胶
4.3 炭黑
第五章 全球主要轮胎厂家研究
5.1 米其林
5.2 普利司通
5.3 固特异
5.4 大陆
5.5 住友橡胶
5.6 倍耐力
5.7 横滨
5.8 韩泰
5.9 固铂
5.10 锦湖
5.11 东洋橡胶
5.12 Apollo Tyres
5.13 MRF
5.14 NOKIAN
5.15 正新
5.16 中策
5.17 三角轮胎
5.18 玲珑
5.19 风神
5.20 双钱
5.21 通用股份
5.22 贵州轮胎
5.23 青岛双星
5.24 兴源集团
5.25 赛轮金宇
5.26 佳通
5.27 盛泰集团
1 Global Automobile Market and Industry
1.1 Global Automobile Market
1.2 Automobile Market in the United States
1.3 Automobile Market in Japan and Brazil
1.4 Automobile Market in Britain, France and Germany
1.5 Automobile Market in South Korea and Italy
2 Chinese Automobile Market and Industry
2.1 Overview
2.2 Developments
2.3 Analysis
3. Global Tire Market
3.1 Market Size
3.2 Ranking
3.3 American Tire Market
3.3.1 Market Size
3.3.2 Ranking of Tire Dealers
3.3.3 Market Share of Major Tire Vendors
3.3.4 Market Share of Major OTR Vendors
3.3.5 OE Tire Market Analysis
3.3.6 North American Automotive Tire Industry
3.4 Chinese Tire Market
3.5 China Tire Industry
3.6 China's Tire Export
3.7 China All-steel Radial Tire Industry
3.8 China's Tire Price
3.9 Market Share of Major Tire Vendors in China
3.10 Top 10 Tire Vendors in China
3.11 Tire Anti-dumping in China and the United States
4. Raw Material Market
4.1 Natural Rubber
4.1.1 Global Natural Rubber Market
4.1.2 Chinese Natural Rubber Market
4.1.3 Natural Rubber Price
4.1.4 Layout of Chinese Tire Enterprises in Natural Rubber
4.2 Synthetic Rubber
4.3 Carbon Black
5. Leading Tire Vendors Worldwide
5.1 Michelin
5.2 Bridgestone
5.3 Goodyear
5.4 Continental
5.5 Sumitomo Rubber Group
5.6 Pirelli
5.7 Yokohama Rubber
5.8 Hankook
5.9 Cooper
5.10 Kumho Tire
5.11 Toyo Tire & Rubber
5.12 Apollo Tyres
5.13 MRF
5.14 Nokian
5.15 Cheng Shin Tire
5.16 Hangzhou Zhongce Rubber
5.17 Triangle Tire
5.18 Linglong Tire
5.19 Aeolus Tire
5.20 Double Coin
5.21 Jiangsu General Science Technology
5.22 Guizhou Tire
5.23 Qingdao Double Star
5.24 Xingyuan
5.25 Sailun Jinyu
5.26 Giti Tire
5.27 Shengtai
2010-2016年全球汽车产量
2016年1月至11月世界汽车销售额地区分布
2015-2016全球汽车月度销量
2010-2016年全球汽车销量
2003-2016年全球轻型车产量地域分布
2016-2023全球轻型车产量地域分布
2015-2016年美国(分车型)销量
2015-2016年美国汽车月度产量
2015-2016美国轻型车月度销量
2016年美国轻型车(分制造商)累计销量
2016年巴西各类型汽车产销量
2016年德国各类型汽车销量
2016年英国各类型汽车销量
2016年法国乘用车(分品牌)销量
2016年韩国汽车整车厂销量
2016年意大利新车销量
2005-2016年中国汽车销量
2016年中国汽车月度销量
2008-2016年中国各类型汽车年销量同比增幅
2009-2016年中国汽车(分车系)销量市场份额
2011-2016年中国新能源汽车销量
2012-2016年中国新能源乘用车销量
2010-2016年中国汽车月度销量
2006-2016年中国乘用车销量
2006-2016年中国商用车销量
2013-2020年全球轮胎市场规模
2014-2020年汽车轮胎市场规模
2017年全球轮胎出货量地域分布
2010-2015年全球前30大轮胎厂家轮胎销售额
2011-2015年全球主要轮胎厂家营业利润率
2004-2016年美国乘用车OE与替换轮胎出货量
2004-2016年美国轻卡OE与替换轮胎出货量
2004-2016年美国中重卡OE与替换轮胎出货量
2015年美国替换轮胎销售额
2000-2015年卡车轮胎替换市场崩溃细分
1995-2015年美国消费轮胎经销渠道市场份额
2011年美国轮胎销售量渠道分布
2014-2015年美国替换消费轮胎品牌份额
2013年美国替换 消费轮胎品牌份额
2015年美国替换中型/重型卡车轮胎品牌份额
2014年美国替换中型/重型卡车轮胎品牌份额
2013年美国替换中型/重型卡车轮胎品牌份额
2015年美国翻新卡车轮胎市场份额
国内最受欢迎的OE乘用车轮胎和LT轮胎尺寸
2014-2015年美国轮胎平均价格
2014-2015年美国 OE农场轮胎市场份额
2013年美国替换农场轮胎市场份额
2014-2015年克莱斯勒/菲亚特OE轮胎供应商市场份额
2014-2015年宝马OE轮胎供应商市场份额
2014-2015年日产OE轮胎供应商市场份额
2014-2015年福特OE轮胎供应商市场份额
2014-2015年通用OE轮胎供应商市场份额
2014-2015年丰田OE轮胎供应商市场份额
2014-2015年本田OE轮胎供应商市场份额
2014-2015年奔驰OE轮胎供应商市场份额
2014-2015年大众OE轮胎供应商市场份额
2013-2015年北美汽车轮胎厂家收入排名
2016年北美轮胎厂产量一览
2010-2020年中国汽车轮胎市场规模
2009-2017年中国汽车轮胎OE与替换市场规模
各类型轮胎配套与替换数量
2007-2016年中国汽车轮胎产量
2015-2016年中国全钢胎月度开工率
2015-2016年中国半钢胎月度开工率
2014年中国轮胎产量地域分布
中国轮胎厂家分布
中国一线轮胎厂家产能
中国二线轮胎厂家产能
2006-2016年中国轮胎外胎新增产能
2013-2016年中国15大轮胎企业产量
2008-2016年中国汽车轮胎出口量
2015-2016年中国PCR轮胎主要出口国家出口量占比
2016年11月中国TBR出口量变化趋势及主要出口国家占比
2016年中国主要省轮胎月度出口量
2015年山东省轮胎出口前10大企业
2003-2015年美国从中国进口的消费轮胎数量
2011-2015年美国从中国进口的卡车轮胎数量
2012-2016年中国出口美国充气橡胶轮胎金额
2013-2016年中国出口美国橡胶轮胎出口量
2004-2016年中国轮胎子午化率
2005-2016年中国全钢子午胎产量
2008-2015年中国全钢胎产量前十大企业
2016年中国主要轮胎企业轮胎价格上涨情况
2016年中国半钢胎企业按产能分布
2016年中国全钢胎企业按产能分布
2015中国轿车轮胎OE市场主要厂家市场占有率
2015年中国交叉型乘用车轮胎主要厂家市场占有率
2015年中国载重车轮胎主要厂家市场占有率
2013-2016年中国十大轮胎厂家轮胎销售收入
截至2016年底中美轮胎反倾销进程及结果
2015年以来中国轮胎破产企业统计
中国轮胎企业海外布局
中国主要轮胎企业兼并重组大事件
轮胎成本构成
2008-2016年全球天然橡胶产量及同比增长
2013-2015年全球天然橡胶(分国家)产量
2008-2016年全球天然橡胶耗用量及同比增长
2008-2016年中国天然橡胶产量及同比增长
2005-2016年中国天然橡胶自给率
2008-2016年中国天然橡胶耗用量及同比增长
2004-2016年中国天然橡胶进口量及同比增长
2015-2020年中国天然橡胶生产量与耗用量
2014-2016年国际天然橡胶走势
2016年中国天然橡胶价格走势
中国主要轮胎企业天然橡胶布局
2003-2020年中国合成橡胶生产量与耗用量
2012-2016年中国顺丁橡胶价格走势
2012-2016年中国丁苯橡胶价格走势
2007-2016年中国炭黑产能
2016年中国炭黑价格走势
2004-2016年中国炭黑进出口量
2004-2016年米其林收入与营业利润率
2007-2016年米其林营业利润与营业利润率
2007-2016H1年米其林乘用车轮胎营业利润与营业利润率
2007-2016年米其林卡车轮胎营业利润与营业利润率
2010-2016年米其林(分部门)营业利润构成
2009-2016年米其林收入部门分布
2009-2016年米其林各部门营业利润率
2015年米其林(分司机)净销售额
2014-2016H1年米其林收入地区分布
2015-2016H1年米其林(分货币)净销售额
2015-2016年米其林季度销量与价格组合
2017-2020年米其林发展目标
2015-2020年米其林资本支出与折旧
2020年米其林财政目标
2016-2020米其林各产品营业利润率目标
2010-2015年米其林品牌乘用车销量增长
2013-2015年米其林轮胎出货量尺寸分布
2005-2016年米其林乘用车及轻卡轮胎工厂布局
米其林墨西哥轻型车轮胎新工厂
2012-2020年米其林PC/LT轮胎产能及产能利用率
米其林中国收入地域分布
米其林中国区分布
米其林中国经销商分布
2009-2019年沈阳米其林累计投资
2010-2019年 沈阳米其林“爬坡效应”
2007-2016年普利司通收入与营业利润率
2004-2016年普利司通收入地域分布
2016年普利斯通营业利润桥梁图
2012-2015年普利司通轮胎业务销售额和资本支出
2016年12月普利司通全球工厂分布
2011-2015年普利司通轮胎(分地区)产量
2010-2016年普利司通品牌价值
普利司通中国分布
2004-2016年固特异收入与营业利润率统计
2007-2016年固特异销量
2016-2015年固特异销量下游分布
2008-2016年固特异收入地域分布
2008-2015年固特异各地区营业利润率
2006-2013年固特异各地区替换轮胎销售比例
2006-2016年固特异轮胎销量地域分布
固特异轮胎产能扩充项目
2010-2015年固特异在中国(分商店类型)品牌零售扩张
2010-2015年固特异在中国(分城市等级)品牌零售扩张
2015-2020年固特异轮胎布局中国三四线城市
2000-2016年德国大陆销售额及净利润
2015年德国大陆子公司分布
2010-2015年德国大陆集团收入地域分布和业务分布
2013-2015年大陆集团轮胎业务主要数据
大陆集团轮胎品牌一览
2010&2015年大陆集团轮胎业务收入地域分布
2018年大陆集团PLT轮胎新增产能地域分布
2025年德国大陆轮胎业务发展目标
2013-2015年大陆集团PLT轮胎产能地域分布(不包括欧洲)
2013-2015年大陆集团欧洲PLT轮胎产能地域分布
2013-2015年大陆集团CV轮胎产能地域分布
2010-2014年大陆集团PLT轮胎销量
2010-2015年大陆集团CV轮胎销量
2015年德国大陆轮胎工厂分布
2015年德国大陆轮胎厂人工成本
2025年德国大陆轮胎业务目标
2004-2016年住友橡胶收入与营业利润率
2011-2015 住友橡胶营业利润
2007-2015年住友橡胶收入地域分布
2007-2016年住友橡胶收入产品分布
2007-2016年住友橡胶营业利润按产品分布
2011-2015年住友橡胶轮胎销量
2014-2016年住友橡胶轮胎(分地区)OE/RT市场销量
2009-2016年住友橡胶轮胎除日本外市场销量
2011-2016年住友橡胶轮胎分地区产能
2009-2016年住友橡胶轮胎产量
2006-2016年住友橡胶产量与产能利用率
2006-2016年倍耐力收入与营业利润率
2006-2016年倍耐力轮胎业务销售额(分渠道)
2012-2015年倍耐力轮胎业务销售额(分业务)
2013-2015年倍耐力轮胎业务销售额(分部门)
2012-2015年倍耐力轮胎业务销售额(分地区)
2016年1-9月倍耐力轮胎原材料成本
2015年倍耐力轮胎原材料成本
2013年倍耐力轮胎原材料成本
2014年倍耐力轮胎原材料成本
2016年倍耐力员工数量地域分布
倍耐力全球分布
2006-2016年横滨橡胶销售额与营业利润率
2006-2015年横滨橡胶轮胎收入地域分布
2006-2015年横滨橡胶轮胎收入业务分布
2016年横滨橡胶收入业务分布
2011-2014年横滨橡胶全球工厂产能
2014-2020年横滨轮胎产能
横滨橡胶全球布局
横滨橡胶2014-2020扩展计划
2003-2016年韩泰轮胎收入与营业利润率
2013年4季度-2014年4季度韩泰轮胎收入地域分布
2015年韩泰轮胎销售额(分地区)
2016年韩泰在欧洲拓展子午线卡车胎(TBR OE)及车队业务情况
2005-2015年韩泰轮胎产量地域分布
2015-2016年季度韩泰轮胎中国区季度收入与毛利率
固铂基本情况
2004-2016年固铂收入与营业利润率
2006-2016年固铂收入地域分布
2012年固铂销售额产品分布
2015固铂工厂分布
2013-2016年固铂资本资产、并购股票回购及股利情况
青岛格瑞达橡胶有限公司基本情况
2005-2016年锦湖轮胎收入与营业利润率
锦湖轮胎产能分布
2013-2015年锦湖轮胎收入地域分布
2009-2013年锦湖轮胎出货量与平均售价
2010-2016Q3锦湖轮胎大尺寸轮胎全球销售趋势
2012-2016年锦湖轮胎产量地域分布
2014-2016年锦湖轮胎季度原材料成本趋势 (基于投入成本)
2013年4季度-2016年1季度锦湖轮胎中国分公司收入与营业利润率
2015-2016年季度锦湖轮胎在中国产量
2007-2016年东洋橡胶收入与营业利润率
2015-2016 东洋橡胶营业利润
2007-2016年东洋橡胶收入地域分布
2011-2016年东洋橡胶产量地域分布
2011-2016年东洋橡胶销量地域分布
2016年Apollo概览
2016年Apollo 地区分布
Apollo 发展历程
2007-2016财年Apollo轮胎收入与净利润率
2015财年Apollo轮胎销售额产品分布
2016年Apollo主要合作伙伴
2012财年Apollo轮胎销售额与产能地域分布
Apollo轮胎收入地域分布
Apollo轮胎营业利润地域分布
2006-2016财年MRF收入与利润
2004-2016年Nokian收入与营业利润率
2013-2016 Nokian销售额地域分布
2012-2016年Nokian收入业务分布
2013-2016年Nokian息税前利润率部门分布
2010-2016年Nokian公司原材料成本情况
2016年Nokian原材料消费
2016年Nokian全球分布
2003-2016年正新收入与营业利润率
2016年正新橡胶产能
2016正新工厂全球分布
正新各工厂简介
2015-2016上半年正新主要子公司收入
2016年上半年正新公司收入(按子公司)
2011-2015年正新收入地域分布
2012-2016年正新收入产品分布
2016年上半年正新橡胶收入分产品出货量
2016年上半年正新收入地域分布
2016年上半年正新公司原材料成本构成
2016年上半年正新收入(按OE&RE客户)
正新轮胎中国应用车型
2016年中策橡胶公司
2007-2016年杭州中策橡胶收入与营业利润率
2007-2016年杭州中策橡胶收入与产量
中策橡胶公司轮胎品牌
中策橡胶组织结构
2013-2016年三角轮胎收入与营业利润率
2013-2016年三角轮胎收入与产量
2013-2016年三角轮胎(分用途)产能、产量及销量
2013-2016年三角轮胎(分产品)产能、产量与销量
2013-2016年三角轮胎(分用途)收入及构成
2013-2016年三角轮胎(分产品)收入及构成
2013-2016年三角轮胎替换市场与原配市场收入及占比
2013-2016年三角轮胎境外(分地区)收入及构成
2013-2016年三角轮胎全钢胎收入及毛利率
2013-2016年三角轮胎半钢胎收入与毛利率
2013-2016年三角轮胎斜交胎收入及毛利率分析
三角轮胎股份公司子公司分布
2007-2016年玲珑轮胎集团收入与营业利润率
2007-2016年玲珑轮胎集团收入与产量
2013-2016年玲珑轮胎(分地区)收入
2013-2015年玲珑轮胎(分产品)销量及收入
2013-2015年玲珑轮胎(分产品)毛利率及收入占比
2013-2016玲珑轮胎(分产品)产能、产销量
玲珑轮胎子公司分布
2016年玲珑轮胎主要在建项目
2006-2016年风神股份收入与营业利润率
2014-2016年风神轮胎产销量
风神轮胎组织结构
2005-2014年双钱股份收入与营业利润率
2013-2016年上海华谊集团营业收入与营业利润率
2010-2016年双钱轮胎(分产品)产量
2015-2016年上海华谊轮胎营业收入及营业成本
2013-2016年通用股份(分产品/分销售模式)收入及占比
2013-2016年通用股份各类型轮胎产能、产量
2013-2016年通用股份各类型轮胎产销量
2013-2016年通用股份(分产品)收入及占比
2013-2016年通用股份全钢胎(分地区)收入及占比
2013-2016年通用股份斜交胎(分地区)收入及占比
2013-2016年通用股份(分产品)毛利率
2016年通用股份轮胎产品成本构成
通用股份股权结构
2006-2016年贵州轮胎收入与营业利润率
2013-2016年贵州轮胎各类型轮胎产量
2013-2016年贵州轮胎轮胎产销量
2015年贵州轮胎(分产品)销量及收入
2013-2015年贵州轮胎出口量及出口收入
2004-2016年青岛双星收入与营业利润率
2013-2015年青岛双星轮胎(分产品)产能、产销量
2013-2015年青岛双星出口量及出口收入
2007-2013年兴源集团收入与营业利润率
2009-2016赛轮金宇收入与营业利润率
2013-2016年赛轮金宇收入产品分布
2013-2016年赛轮金宇毛利及毛利率产品分布
2013-2015年赛轮金宇轮胎(分地区)收入
2013-2015年赛轮金宇轮胎产品产能、产销量
2013-2015年赛轮金宇轮胎产品成本构成
2016年赛轮金宇主要在建项目
2012年收入情况(分地区)
2006-2015年佳通轮胎股份有限公司收入与营业利润
Global Automobile Output, 2010-2016
Global Vehicle Sales by Region, Jan-Nov 2016
Global Monthly Automobile Sales Volume, 2015-2016
Global Automobile Sales Volume, 2010-2016
Geographical Distribution of Global Light Vehicle Output, 2003-2016
Geographical Distribution of Global Light Vehicle Output, 2016-2023E
Automobile Sales Volume in the United States (by Model), 2015-2016
Monthly Automobile Output in the United States, 2015-2016
Monthly Light Vehicle Sales Volume in the United States, 2015-2016
Accumulative Light Vehicle Sales Volume in the United States (by Manufacturer), 2016
Automobile Output and Sales Volume in Brazil, 2016
Automobile Sales Volume in Germany, 2016
Automobile Sales Volume in United Kingdom, 2016
Passenger Car Sales Volume in France (by Brand), 2016
Sales Volume of Automakers in South Korea, 2016
New Car Sales Volume in Italy, 2016
China’s Automobile Sales Volume, 2005-2016
China’s Monthly Automobile Sales Volume, 2016
YoY Growth Rate of China’s Annual Automobile Sales Volume, 2008-2016
China’s Automobile Sales Volume and Market Share (by Series), 2009-2016
China's New Energy Vehicle Sales Volume, 2011-2016
China's New Energy Passenger Car Sales Volume, 2012-2016
China's Monthly Automobile Sales Volume, 2010-2016
China's Passenger Car Sales Volume, 2006-2016
China's Commercial Vehicle Sales Volume, 2006-2016
Global Tire Market Size, 2013-2020E
Automotive Tire Market Size, 2014-2020E
Geographical Distribution of Global Tire Shipment, 2017
Global Top 30 Tire Manufacturers by Revenue, 2010-2015
Operating Margin of Global Major Tire Manufacturers, 2011-2015
Passenger Car OE and Replacement Tire Shipment in the United States, 2004-2016
Light Truck OE and Replacement Tire Shipment in the United States, 2004-2016
Medium/Heavy Truck OE and Replacement Tire Shipment in the United States, 2004-2016
Replacement Tire Sales in the United States, 2015
Truck Tire Replacement Market Breakdown, 2000-2015
Consumer Tire Distribution by Channel and Market Share in the United States, 1995-2015
Distribution of Tire Sales Channels in the United States, 2011
Share of Replacement Consumer Tire Brands in the United States, 2014-2015
Share of Replacement Consumer Tire Brands in the United States, 2013
Share of Replacement Medium/Heavy Truck Tire Brands in the United States, 2015
Share of Replacement Medium/Heavy Truck Tire Brands in the United States, 2014
Share of Replacement Medium/Heavy Truck Tire Brands in the United States, 2013
Market Share of Retreaded Truck Tires in the United States, 2015
Most Popular Domestic OE Passenger and LT Tire Sizes
Tire Average Price in the United States, 2014-2015
OE Farm Tire Market Share in the United States, 2014-2015
Replacement Farm Tire Market Share in the United States, 2013
Market Share of OE Tire Suppliers for Chrysler/Fiat, 2014-2015
Market Share of OE Tire Suppliers for BMW, 2014-2015
Market Share of OE Tire Suppliers for Nissan, 2014-2015
Market Share of OE Tire Suppliers for Ford, 2014-2015
Market Share of OE Tire Suppliers for GM, 2014-2015
Market Share of OE Tire Suppliers for TOYOTA , 2014-2015
Market Share of OE Tire Suppliers for HONDA, 2014-2015
Market Share of OE Tire Suppliers for Mercedes-Benz, 2014-2015
Market Share of OE Tire Suppliers for VW, 2014-2015
Ranking of Automobile Tire Manufacturers in North America by Revenue, 2013-2015
Output of Tire Manufacturers in North America, 2016
China’s Automobile Tire Market Size, 2010-2020E
China’s Automobile Tire OE and Replacement Market Size, 2009-2017
Tire Matching and Replacement Amount by Type
China’s Automobile Tire Output, 2007-2016
Monthly Operating Rate of Chinese All-steel Tires, 2015-2016
Monthly Operating Rate of Chinese Semi-steel Tires, 2015-2016
Geographical Distribution of China’s Tire Output, 2014
Distribution of Chinese Tire Manufacturers
Capacity of First-tier Tire Manufacturers in China
Capacity of Second-tier Tire Manufacturers in China
New Capacity of Chinese Tire Outer Covers, 2006-2016
Output of China’s Top 15 Tire Enterprises, 2013-2016
China’s Automotive Tire Export Volume, 2008-2016
Share of China’s PCR Tire Major Export Destinations by Export Volume, 2015-2016
China’s TBR Export Volume and Share of Major Export Destinations, Nov 2016
Monthly Tire Export Volume of China’s Major Provinces, 2016
Top 10 Enterprises in Shandong Province by Tire Export, 2015
U.S. Consumer Tire Imports from China, 2003-2015
U.S. Truck Tire Imports from China, 2011-2015
Export Value of Chinese Inflatable Rubber Tires to the United States, 2012-2016
Export Volume of Chinese Rubber Tires to the United States, 2013-2016
China’s Tire Meridianization Rate, 2004-2016
China’s All-steel Radial Tire Output, 2005-2016
Top 10 All-steel Tire Enterprises in China by Output 2008-2015
Tire Price Hike of Major Tire Enterprises in China, 2016
Capacity Distribution of Semi-steel Tire Enterprises in China, 2016
Capacity Distribution of All-steel Tire Enterprises in China, 2016
Market Share of Major Sedan Tire OE Manufacturers in China, 2015
Market Share of Major Cross-type Passenger Car Tire Manufacturers in China, 2015
Market Share of Major Truck Tire Manufacturers in China, 2015
Top 10 Tire Manufacturers in China by Tire Revenue, 2013-2016
Sino-US Tire Anti-dumping process and Result, by the end of 2016
Statistics of Chinese Bankrupt Tire Enterprises Since 2015
Overseas Layout of Chinese Tire Enterprises
Main Mergers and Acquisitions of Chinese Major Tire Enterprises
Tire Cost Structure
Global Natural Rubber Output and YoY Growth, 2008-2016
Global Natural Rubber Output by Country, 2013-2015
Global Natural Rubber Consumption and YoY Growth, 2008-2016
China’s Natural Rubber Output and YoY Growth, 2008-2016
China’s Natural Rubber Self-sufficiency Rate, 2005-2016
China’s Natural Rubber Consumption and YoY Growth, 2008-2016
Import Volume and YoY Growth of Natural Rubber in China, 2004-2016
Natural Rubber Output and Consumption in China, 2015-2020E
International Natural Rubber Trend, 2014-2016
China’s Natural Rubber Price Trend, 2016
Natural Rubber Layout of Chinese Major Tire Enterprises
Synthetic Rubber Output and Consumption in China, 2003-2020E
China’s Butadiene Rubber Price Trend, 2012-2016
China’s Styrene-butadiene Rubber Price Trend, 2012-2016
China’s Carbon Black Capacity, 2007-2016
China’s Carbon Black Price Trend, 2016
China’s Carbon Black Import and Export Volume, 2004-2016
Michelin’s Revenue and Operating Margin, 2004-2016
Michelin’s Operating Income and Margin, 2007-2016
Michelin’s Passenger Car Tire Operating Income and Margin, 2007-H1 2016
Michelin’s Strong Truck Tire Operating Income and Margin, 2007-2016
Michelin’s Operating Income Structure by Division, 2010-2016
Michelin’s Revenue by Division, 2009-2016
Michelin’s Operating Margin by Division, 2009-2016
Michelin’s Net Sales by Drivers, 2015
Michelin’s Revenue by Region, 2014-H1 2016
Michelin’s Net Sales by Currency, 2015-H1 2016
Michelin’s Quarterly Volumes and Price-mix, 2015-2016
Michelin’s Development Goals, 2017-2020E
Michelin’s Capital Expenditure and Depreciation, 2015-2020E
Michelin’s Financial Goals, 2020E
Michelin’s Operating Margin Goals by Product, 2016-2020E
Michelin’s Brand Passenger Car Volume Growth, 2010-2015
Michelin’s Tire Shipment by Size, 2013-2015
Layout of Michelin’s Passenger Car and Light Truck Tire Factories, 2005-2016
Michelin’s New Light Vehicle Tire Factories in Mexico
Michelin’s PC/LT Tire Capacity and Capacity Utilization, 2012-2020E
Revenue of Michelin China by Region
Distribution of Michelin in China
Distribution of Michelin’s Dealers in China
Accumulative Investment of Shenyang Michelin, 2009-2019E
Ramp-up of Shenyang Michelin, 2010-2019E
Bridgestone’s Revenue and Operating Margin, 2007-2016
Bridgestone’s Revenue by Region, 2004-2016
Bridge Diagram of Bridgestone’s Operating Income, 2016
Bridgestone’s Tire Revenue and Capital Expenditure, 2012-2015
Distribution of Bridgestone’s Global Factories, Dec 2016
Bridgestone’s Tire Output (by Region), 2011-2015
Bridgestone’s Brand Value, 2010-2016
Distribution of Bridgestone in China
Goodyear’s Revenue and Operating Margin, 2004-2016
Goodyear’s Sales Volume, 2007-2016
Goodyear’s Sales Volume by Application, 2016-2015
Goodyear’s Revenue by Region, 2008-2016
Goodyear’s Operating Margin by Region, 2008-2015
Sales Ratio of Goodyear’s Replacement Tires by Region, 2006-2013
Goodyear’s Tire Sales Volume by Region, 2006-2016
Goodyear’s Tire Capacity Expansion Project
Goodyear’s Branded Retail Expansion by Store Type in China, 2010-2015
Goodyear’s Branded Retail Expansion by City Tier in China, 2010-2015
Goodyear’s Tire Layout in China’s Third- and Fourth-tier Cities, 2015-2020E
Continental’s Revenue and Net Income, 2000-2016
Distribution of Continental’s Subsidiaries, 2015
Continental’s Revenue by Region and Business Distribution, 2010-2015
Key Figures of Continental’s Tire Business, 2013-2015
Continental’s Tire Brands
Continental’s Tire Revenue by Region, 2010&2015
Continental’s PLT Tire Additional Capacity by Region, 2018E
Continental’s Tire Business Development Goals, 2025E
Continental’s PLT Tire Capacity by Region (excluding Europe), 2013-2015
Continental’s PLT Tire Capacity in Europe by Region, 2013-2015
Continental's CV Tire Capacity by Region, 2013-2015
Continental's PLT Tire Sales Volume, 2010-2014
Continental's CV Tire Sales Volume, 2010-2015
Distribution of Continental's Tire factories, 2015
Labor Costs of Continental's Tire factories, 2015
Continental's Tire Business Goals, 2025E
Revenue and Operating Margin of Sumitomo Rubber, 2004-2016
Operating Income of Sumitomo Rubber, 2011-2015
Revenue of Sumitomo Rubber by Region, 2007-2015
Revenue of Sumitomo Rubber by Product, 2007-2016
Operating Income of Sumitomo Rubber by Product, 2007-2016
Tire Sales Volume of Sumitomo Rubber, 2011-2015
Tire OE/RT Sales Volume of Sumitomo Rubber (by Region), 2014-2016
Tire Sales Volume of Sumitomo Rubber outside Japan by Region, 2009-2016
Tire Capacity of Sumitomo Rubber by Region, 2011-2016
Tire Output of Sumitomo Rubber, 2009-2016
Output and Capacity Utilization of Sumitomo Rubber, 2006-2016
Pirelli's Revenue and Operating Margin, 2006-2016
Pirelli's Tire Sales by Channel, 2006-2016
Pirelli's Tire Sales by Business, 2012-2015
Pirelli's Tire Sales by Segment, 2013-2015
Pirelli's Tire Sales by Region, 2012-2015
Pirelli's Tire Raw Material Costs, Jan-Sep 2016
Pirelli's Tire Raw Material Costs, 2015
Pirelli's Tire Raw Material Costs, 2013
Pirelli's Tire Raw Material Costs, 2014
Geographical Distribution of Pirelli's Employees, 2016
Pirelli's Global Distribution
Revenue and Operating Margin of Yokohama Rubber, 2006-2016
Tire Revenue of Yokohama Rubber by Region, 2006-2015
Tire Revenue Distribution of Yokohama Rubber, 2006-2015
Revenue of Yokohama Rubber by Business, 2016
Capacity of Global Factories of Yokohama Rubber, 2011-2014
Tire Capacity of Yokohama Rubber, 2014-2020E
Global Layout of Yokohama Rubber
Expansion Plan of Yokohama Rubber, 2014-2020
Hankook’s Tire Revenue and Operating Margin, 2003-2016
Hankook’s Revenue by Region, Q4 2013-Q4 2014
Hankook’s Tire Revenue by Region, 2015
Hankook’s Expanding TBR OE and Fleet Business in Europe, 2016
Hankook’s Tire Output by Region, 2005-2015
Quarterly Revenue and Gross Margin of Hankook China, 2015-2016
Cooper’ Facts
Cooper’s Revenue and Operating Margin, 2004-2016
Cooper’s Revenue by Region, 2006-2016
Cooper’s Revenue by Product, 2012
Cooper’s Factory Distribution, 2015
Cooper’s Capex, M&A and Dividend, 2013-2016
Facts of Qingdao GRT
Revenue and Operating Margin of Kumho Tire, 2005-2016
Capacity Distribution of Kumho Tire
Revenue of Kumho Tire by Region, 2013-2015
Shipment and ASP of Kumho Tire, 2009-2013
Global Sales Trend of High-inch Tires of Kumho Tire, 2010-Q3 2016
Output of Kumho Tire by Region, 2012-2016
Trend of Quarterly Raw Material Costs (Based on Input Costs) of Kumho Tire, 2014-2016
Revenue and Operating Margin of Kumho Tire China, Q4 2013-Q1 2016
Quarterly Output of Kumho Tire in China, 2015-2016
Revenue and Operating Margin of Toyo Tire & Rubber, 2007-2016
Operating Income of Toyo Tire & Rubber, 2015-2016
Revenue of Toyo Tire & Rubber by Region, 2007-2016
Output of Toyo Tire & Rubber by Region, 2011-2016
Sales Volume of Toyo Tire & Rubber by Region, 2011-2016
Apollo Tyres at a Glance, 2016
Regional Distribution of Apollo Tyres, 2016
Development Course of Apollo Tyres
Revenue and Net Profit Margin of Apollo Tyres, FY2007-FY2016
Revenue of Apollo Tyres by Product, FY2015
Major Copartners of Apollo Tyres, 2016
Revenue and Capacity of Apollo Tyres by Region, FY2012
Revenue of Apollo Tyres by Region
Operating Income of Apollo Tyres by Region
MRF’s Revenue and Profit, FY2006-FY2016
Nokian’s Revenue and Operating Margin, 2004-2016
Nokian’s Revenue by Region, 2013-2016
Nokian’s Revenue by Business, 2012-2016
Nokian’s EBIT Margin by Division, 2013-2016
Nokian’s Raw Material Cost Development, 2010-2016
Nokian’S Raw Material Consumption, 2016
Nokian’s Global Distribution, 2016
Revenue and Operating Margin of Cheng Shin Tire, 2003-2016
Rubber Capacity of Cheng Shin Tire, 2016
Global Distribution of Factories of Cheng Shin Tire, 2016
Introduction to Factories of Cheng Shin Tire
Revenue of Major Subsidiaries of Cheng Shin Tire, 2015-H1 2016
Revenue of Cheng Shin Tire by Subsidiary, H1 2016
Revenue of Cheng Shin Tire by Region, 2011-2015
Revenue of Cheng Shin Tire by Product, 2012-2016
Revenue of Cheng Shin Tire by Product and Shipment, H1 2016
Revenue of Cheng Shin Tire by Region, H1 2016
Raw Material Cost Structure of Cheng Shin Tire, H1 2016
CST’s Revenue by OE & RE Customer, H1 2016
Vehicle Models Supported by Cheng Shin Tire in China
Hangzhou Zhongce Rubber, 2016
Revenue and Operating Margin of Hangzhou Zhongce Rubber, 2007-2016
Revenue and Output of Hangzhou Zhongce Rubber, 2007-2016
Tire Brands of Hangzhou Zhongce Rubber
Organizational Structure of Hangzhou Zhongce Rubber
Revenue and Operating Margin of Triangle Tire, 2013-2016
Revenue and Output of Triangle Tire, 2013-2016
Capacity, Output and Sales Volume of Triangle Tire (by Application), 2013-2016
Capacity, Output and Sales Volume of Triangle Tire (by Product), 2013-2016
Revenue and Structure of Triangle Tire (by Application), 2013-2016
Revenue and Structure of Triangle Tire (by Product), 2013-2016
Replacement & OEM Revenue and Percentage of Triangle Tire, 2013-2016
Overseas Revenue and Structure of Triangle Tire (by Region), 2013-2016
All-steel Tire Revenue and Gross Margin of Triangle Tire, 2013-2016
Semi-steel Tire Revenue and Gross Margin of Triangle Tire, 2013-2016
Bias Tire Revenue and Gross Margin of Triangle Tire, 2013-2016
Distribution of Triangle Tire’s Subsidiaries
Revenue and Operating Margin of Linglong Tire, 2007-2016
Revenue and Output of Linglong Tire, 2007-2016
Revenue of Linglong Tire (by Region), 2013-2016
Sales Volume and Revenue of Linglong Tire (by Product), 2013-2015
Gross Margin and Revenue Structure of Linglong Tire (by Product), 2013-2015
Capacity, Output and Sales Volume of Linglong Tire (by Product), 2013-2016
Distribution of Linglong Tire’s Subsidiaries
Linglong Tire’s Major Projects under Construction, 2016
Revenue and Operating Margin of Aeolus Tire, 2006-2016
Output and Sales Volume of Aeolus Tire, 2014-2016
Organizational Structure of Aeolus Tire
Revenue and Operating Margin of Double Coin, 2005-2014
Revenue and Operating Margin of Shanghai Huayi Group, 2013-2016
Output of Double Coin (by Product), 2010-2016
Tire Revenue and Operating Costs of Shanghai Huayi Group, 2015-2016
Revenue and Structure of Jiangsu General Science Technology (by Product/Sales Model), 2013-2016
Tire Capacity and Output of Jiangsu General Science Technology by Type, 2013-2016
Tire Output and Sales Volume of Jiangsu General Science Technology by Type, 2013-2016
Revenue and Structure of Jiangsu General Science Technology (by Product), 2013-2016
All-steel Tire Revenue and Structure of Jiangsu General Science Technology (by Region), 2013-2016
Bias Tire Revenue and Structure of Jiangsu General Science Technology (by Region), 2013-2016
Gross Margin of Jiangsu General Science Technology (by Product), 2013-2016
Tire Cost Structure of Jiangsu General Science Technology, 2016
Equity Structure of Jiangsu General Science Technology
Revenue and Operating Margin of Guizhou Tire, 2006-2016
Tire Output of Guizhou Tire by Type, 2013-2016
Tire Output and Sales Volume of Guizhou Tire, 2013-2016
Sales Volume and Revenue of Guizhou Tire (by Product), 2015
Export Volume and Value of Guizhou Tire, 2013-2015
Revenue and Operating Margin of Qingdao Double Star, 2004-2016
Tire Capacity, Output and Sales Volume of Qingdao Double Star (by Product), 2013-2015
Export Volume and Value of Qingdao Double Star, 2013-2015
Xingyuan’sRevenue and Operating Margin, 2007-2013
Revenue and Operating Margin of Sailun Jinyu, 2009-2016
Revenue of Sailun Jinyu by Product, 2013-2016
Gross Profit and Gross Margin of Sailun Jinyu by Product, 2013-2016
Tire Revenue of Sailun Jinyu (by Region), 2013-2015
Tire Capacity, Output and Sales Volume of Sailun Jinyu, 2013-2015
Tire Cost Structure of Sailun Jinyu, 2013-2015
SailunJinyu’s Major Projects under Construction, 2016
Revenue by Geographical Location, 2012
Revenue and Operating Income of Giti Tire, 2006-2015
如果这份报告不能满足您的要求,我们还可以为您定制报告,请 留言说明您的详细需求。
|