|
|
|
报告导航:研究报告—
生命科学—制药医疗
|
|
2016-2020年中国医院行业研究报告 |
 |
字数:6.2万 |
页数:151 |
图表数:160 |
|
中文电子版:8000元 |
中文纸版:4000元 |
中文(电子+纸)版:8500元 |
|
英文电子版:2400美元 |
英文纸版:2600美元 |
英文(电子+纸)版:2700美元 |
|
编号:ZLC-043
|
发布日期:2017-01 |
附件:无 |
 |
|
|
近年来,在《关于促进健康服务业发展的若干意见》等相关政策和居民医疗健康意识逐步加强以及老龄化加速的驱动下,中国医院行业发展迅速。截至2016年10月,中国医院数量达28584个,较2010年增加7666个。估计2016年,中国医院收入达27080亿元,较2010增长163.3%。
同时,中国的医疗保障系统也逐步完善,医疗资源快速增长,为医院行业的健康有序发展奠定了基础。截至2015年底,中国参加城镇基本医疗保险的人数达6.66亿人,新农合参保人数达6.70亿人,基本实现了医保全覆盖。同时,全国医疗卫生机构床位达到701.5万张,每千人口医疗卫生机构床位数增长至5.11张。根据《关于加快推进健康与养老服务工程建设的通知》,到2020年,医疗卫生机构每千人口病床数(含住院护理)将达到6张。
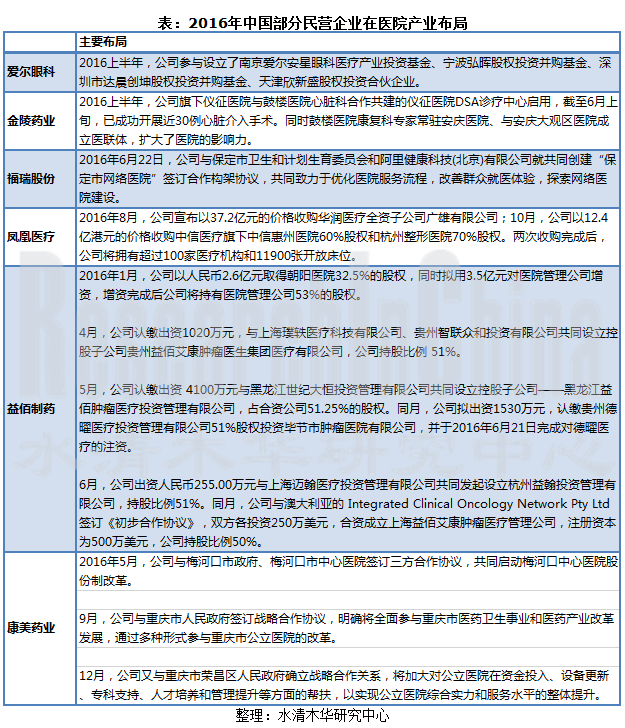
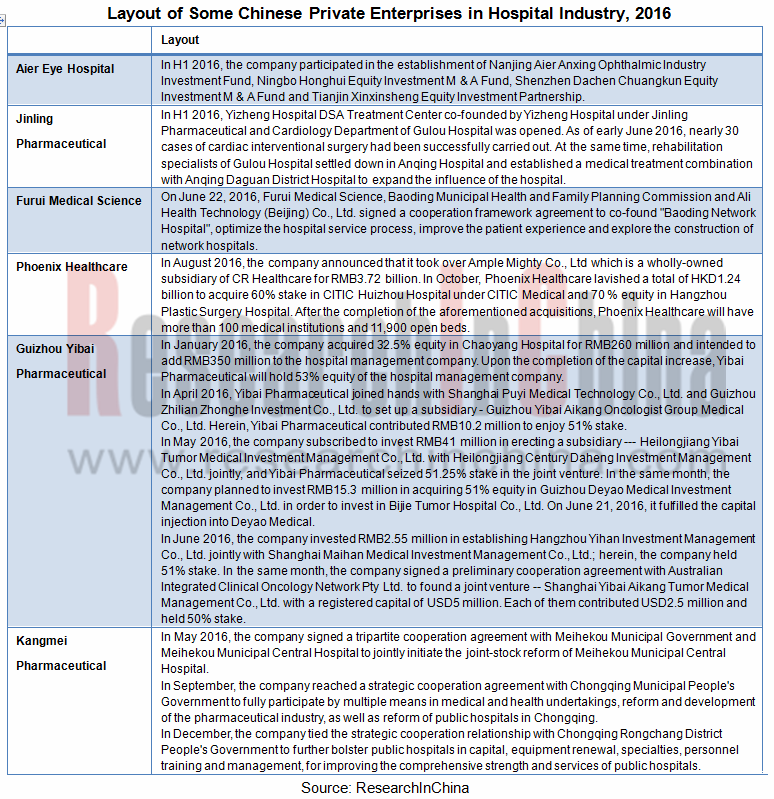
在公立医院改革等政策的推动下,中国掀起了社会资本投资医疗行业的热潮,中国民营医院数量急速上升。截至2016年10月底,中国民营医院数量达15798个,占医院总量的55.3%。但是民营医院收入还不到医院总收入的10%。预计未来几年,中国民营医院将较快发展,到2020年,数量将达20262个,收入将达6396亿元。
由于专科医院投资成本小,投资回报率高,同时需求旺盛,因此社会资本热衷于投资专科医院,目前中国专科医院民营医院占比超过65%。近年来,中国专科医院收入增速保持在20%左右,目前收入规模已超过3000亿元。
其中,眼科医院、口腔医院以及整形美容医院的盈利能力都非常强,利润率达到10%以上。如爱尔眼科是全国最大的眼科医疗连锁机构,在全国有100余家连锁店,年门诊量超300万人,2016上半年公司实现营业收入19.2亿元,净利润2.8亿元,净利润率达14.6%。
《2016-2020年中国医院行业研究报告》主要包括以下内容:
 中国医院行业发展概况,包括医院数量、收入情况、医疗服务、竞争格局及预测与展望; 中国医院行业发展概况,包括医院数量、收入情况、医疗服务、竞争格局及预测与展望;
中国专科医院发展现状,包括专科医院总体概况、各类专科医院分析以及总结预测;
中国医疗保障体系发展概况,包括发展现状及发展趋势分析;
中国医院行业投资分析,包括相关政策、公立与民营医院对比分析、社会资本投资领域以及外资医院发展方向及经营模式分析;
15家相关企业介绍,包括经营情况分析、在医院产业的布局情况分析以及发展预测等。
In recent years, "Opinions on Promoting the Development of Health Service Industry" and other related policies, the people’s growing awareness of health care and the acceleration of population aging have prompted the rapid development of China's hospital industry. As of October 2016, there had been a total of 28,584 hospitals in China, an increase of 7,666 compared with that in 2010. It is estimated that Chinese hospitals gained the revenue of RMB2,708 billion in 2016, soaring 163.3% over 2010.
Chinese medical insurance system has been gradually perfect and medical resources have swelled radically, laying the foundation for the healthy and orderly development of the hospital industry. As of the end of 2015, a total of 666 million Chinese people had enjoyed urban basic medical insurance and 670 million people had held new rural cooperative medical insurance, marking the full coverage of medical insurance. At the same time, the national medical and health institutions had offered 7.015 million beds, namely 5.11 beds for per thousand population. According to Circular on Accelerating the Construction of Health and Old-age Service Project, medical and health institutions should provide 6 beds for per thousand population (including inpatients) averagely by 2020.
Driven by the reform of public hospitals and other policies, China has set off a wave of social capital inrush to the medical industry and witnessed an upsurge in the number of private hospitals. By the end of October 2016, there had been 15,798 private hospitals in China, accounting for 55.3% of the total hospitals. However, the revenue of private hospitals is less than 10% of the total hospital revenue. In the forthcoming years, Chinese private hospitals will grow by leaps and bounds, with the number registering 20,262 and the revenue reporting RMB639.6 billion by 2020.
Specialized hospitals need low investment costs but trigger high return on investment; coupled with the robust demand, they have attracted the fanatical investment of social capital. Private hospitals occupy more than 65% of Chinese specialized hospitals. In recent years, the revenue of Chinese specialized hospitals has been growing at around 20%; the current revenue exceeds RMB300 billion.
Among specialized hospitals, ophthalmic hospitals, stomatological hospitals as well as orthopedics & beauty hospitals enjoy exceedingly high profitability, with the profit margin of above 10%. For instance, Aier Eye Hospital, the nation's largest chain ophthalmic institution – boasts over 100 stores in the country and serves more than 3 million outpatients annually; in the first half of 2016, the company achieved the revenue of RMB1.92 billion, the net income of RMB280 million and the net profit margin of 14.6%.
The report highlights the following:
 Overview of China hospital industry, including number of hospitals, revenue, medical services, competition pattern, forecast and prospect, etc.; Overview of China hospital industry, including number of hospitals, revenue, medical services, competition pattern, forecast and prospect, etc.;
Status quo of specialized hospitals in China, including overview, analysis on specialized hospitals of all sorts, summary and forecast;
Overview of Chinese medical insurance system, embracing status quo and development trend;
Investment in China hospital industry, including related policies, comparison between public and private hospitals, investment of social capital, development directions and business models of foreign-funded hospitals;
Operation, hospital industry layout, development forecast, etc. of 15 enterprises.
第一章中国医院行业概述
1.1 定义
1.2 分类
1.3 产业链
第二章中国医院行业发展概况
2.1 医院概况
2.1.1 医院数量
2.1.2 分布情况
2.2 收入情况
2.3 医疗服务
2.3.1 诊疗人次
2.3.2 病床使用率
2.4 竞争格局
2.5 预测与展望
2.5.1 医院数量及收入将稳步增长
2.5.2 医院公私合营成一大趋势
2.5.3 民营医院数量及收入将稳步增长
2.5.4 民营医院向专业化发展
2.5.5 民营医院逐步品牌化
第三章中国专科医院发展现状
3.1 专科医院总体情况
3.1.1 数量
3.1.2 收入
3.2 各类专科医院现状
3.2.1 眼科医院
3.2.2 口腔医院
3.2.3 整形外科及美容医院
3.2.4 妇产医院
3.2.5 儿童医院
3.2.6 肿瘤医院
3.3 总结与预测
第四章中国医疗保障体系发展概况
4.1 发展现状
4.1.1 医保体系
4.1.2 医保覆盖率接近饱和
4.1.3 城乡居民大病保险
4.2 发展趋势
4.2.1 城镇化将优化医疗保健体系
4.2.2 推进异地医保结算
4.2.3 医保基金累计结存逐年增长
4.2.4 县医院医疗资源供给能力提升
4.2.5 医疗资源快速增长
第五章中国医院行业投资分析
5.1 相关政策
5.2 公立医院与民营医院对比分析
5.2.1 公立医院占据主导地位
5.2.2 民营医院运营效率高
5.3 社会资本投资领域
5.3.1 专科医疗领域
5.3.2 综合性公立医院
5.4 外资医院发展方向及经营模式
5.4.1 外资医院在华现状
5.4.2 外资医院发展方向
5.4.3 外资医院经营方式
第六章中国医院行业主要企业
6.1 爱尔眼科
6.1.1 公司简介
6.1.2 经营情况
6.1.3 营收构成
6.1.4 毛利率
6.1.5 研发与投资
6.1.6 医疗服务
6.1.7 发展预测
6.2 通策医疗
6.2.1 公司简介
6.2.2 经营情况
6.2.3 营收构成
6.2.4 毛利率
6.2.5 医疗服务
6.2.6 发展预测
6.3 马应龙
6.3.1 公司简介
6.3.2 经营情况
6.3.3 营收构成
6.3.4 毛利率
6.3.5 研发
6.3.6 医疗服务
6.3.7 预测与展望
6.4 复星医药
6.4.1 公司简介
6.4.2 经营情况
6.4.3 营收构成
6.4.4 毛利率
6.4.5 研发与投资
6.4.6 医疗服务
6.4.7 预测与展望
6.5 金陵药业
6.5.1 公司简介
6.5.2 经营情况
6.5.3 营收构成
6.5.4 毛利率
6.5.5 研发与投资
6.5.6 医疗服务
6.5.7 预测与展望
6.6 新华医疗
6.6.1 公司简介
6.6.2 经营情况
6.6.3 营收构成
6.6.4 毛利率
6.6.5 研发与投资
6.6.6 医疗服务
6.6.7 预测与展望
6.7 国际医学
6.7.1 公司简介
6.7.2 经营情况
6.7.3 营收构成
6.7.4 医疗服务
6.7.5 预测与展望
6.8 福瑞股份
6.8.1 公司简介
6.8.2 经营情况
6.8.3 营收构成
6.8.4 医疗服务
6.8.5 预测与展望
6.9 健民集团
6.9.1 公司简介
6.9.2 经营情况
6.9.3 营收构成
6.9.4 医疗服务
6.9.5 预测与展望
6.10 泰和诚
6.10.1 公司简介
6.10.2 经营情况
6.10.3 医疗服务
6.10.4 预测与展望
6.11 凤凰医疗
6.11.1 公司简介
6.11.2 经营情况
6.11.3 医疗服务
6.11.4 预测与展望
6.12 益佰制药
6.12.1 公司简介
6.12.2 经营情况
6.12.3 医疗服务
6.12.4 预测与展望
6.13 康美药业
6.13.1 公司简介
6.13.2 经营情况
6.13.3 医疗服务
6.13.4 预测与展望
6.14 模塑科技
6.14.1 公司简介
6.14.2 经营情况
6.14.3 医疗服务
6.14.4 预测与展望
6.15 美中嘉和
6.15.1 公司简介
6.15.2 经营情况
6.15.3 主要客户
6.15.4 医疗服务
6.15.5 预测与展望
1. Overview of China Hospital Industry
1.1 Definition
1.2 Classification
1.3 Industry Chain
2. Development of China Hospital Industry
2.1 Overview
2.1.1 Number of Hospitals
2.1.2 Distribution
2.2 Revenue
2.3 Medical Services
2.3.1 Patient Visits
2.3.2 Bed Utilization
2.4 Competition Pattern
2.5 Forecast and Prospect
2.5.1 Number and Revenue of Hospitals Will Grow Steadily
2.5.2 Public-private Partnership of Hospitals Becomes a General Trend
2.5.3 Number and Revenue of Private Hospitals Will See Steady Growth
2.5.4 Private Hospitals Tend to Be Professional
2.5.5 Private Hospitals Will Forge Brands Gradually
3. Development of Specialized Hospitals in China
3.1 Overview
3.1.1 Number of Specialized Hospitals
3.1.2 Revenue
3.2 Status Quo of Specialized Hospitals of All Kinds
3.2.1 Ophthalmic Hospital
3.2.2 Stomatological Hospital
3.2.3 Orthopedics & Beauty Hospital
3.2.4 Obstetrics & Gynecology Hospital
3.2.5 Children’s Hospital
3.2.6 Tumor Hospital
3.3 Summary and Forecast
4 Development of Chinese Medical Insurance System
4.1 Status Quo
4.1.1 Medical Insurance System
4.1.2 Coverage of Medical Insurance System Is Close to Saturation
4.1.3 Serious Illness Insurance for Urban and Rural Residents
4.2 Development Trends
4.2.1 Urbanization Will Optimize Health Care System
4.2.2 Trans-regional Medical Insurance Settlement Will Be Promoted
4.2.3 Accumulated Balance of Medical Insurance Funds Grows Year by Year
4.2.4 Medical Resource Supply Capacity of County-level Hospitals Will Improve
4.2.5 Medical Resources Will Grow Rapidly
5. Investment in China Hospital Industry
5.1 Policies
5.2 Comparison between Public and Private Hospitals
5.2.1 Public Hospitals Play a Leading Role
5.2.2 Private Hospitals Run with High Efficiency
5.3 Investment Fields of Social Capital
5.3.1 Specialized Medical Field
5.3.2 General Public Hospitals
5.4 Development Orientation and Business Model of Foreign Hospitals
5.4.1 Status Quo of Foreign Hospitals in China
5.4.2 Development Direction
5.4.3 Business Practice
6. Major Enterprises
6.1 Aier Eye Hospital Group
6.1.1 Profile
6.1.2 Operation
6.1.3 Revenue Structure
6.1.4 Gross Margin
6.1.5 R&D and Investment
6.1.6 Medical Services
6.1.7 Prediction
6.2 TC Medical
6.2.1 Profile
6.2.2 Operation
6.2.3 Revenue Structure
6.2.4 Gross Margin
6.2.5 Medical Services
6.2.6 Prediction
6.3 Mayinglong Pharm
6.3.1 Profile
6.3.2 Operation
6.3.3 Revenue Structure
6.3.4 Gross Margin
6.3.5 R&D
6.3.6 Medical Services
6.3.7 Prediction and Outlook
6.4 Shanghai Fosun Pharmaceutical (Group)
6.4.1 Profile
6.4.2 Operation
6.4.3 Revenue Structure
6.4.4 Gross Margin
6.4.5 R&D and Investment
6.4.6 Medical Services
6.4.7 Prediction and Outlook
6.5 Jinling Pharmaceutical Company Limited
6.5.1 Profile
6.5.2 Operation
6.5.3 Revenue Structure
6.5.4 Gross Margin
6.5.5 R&D and Investment
6.5.6 Medical Services
6.5.7 Prediction and Outlook
6.6 Shinva Medical Instrument
6.6.1 Profile
6.6.2 Operation
6.6.3 Revenue Structure
6.6.4 Gross Margin
6.6.5 R&D and Investment
6.6.6 Medical Services
6.6.7 Prediction and Outlook
6.7 Xi’an International Medical Investment Co., Ltd.
6.7.1 Profile
6.7.2 Operation
6.7.3 Revenue Structure
6.7.4 Medical Services
6.7.5 Prediction and Outlook
6.8 Inner Mongolia Furui Medical Science
6.8.1 Profile
6.8.2 Operation
6.8.3 Revenue Structure
6.8.4 Medical Services
6.8.5 Prediction and Outlook
6.9 Wuhan Jianmin Pharmaceutical Groups Corp.
6.9.1 Profile
6.9.2 Operation
6.9.3 Revenue Structure
6.9.4 Medical Services
6.9.5 Prediction and Outlook
6.10 Concord Medical Services Holdings Limited
6.10.1 Profile
6.10.2 Operation
6.10.3 Medical Services
6.10.4 Prediction and Outlook
6.11 Phoenix Healthcare Group
6.11.1 Profile
6.11.2 Operation
6.11.3 Medical Services
6.11.4 Prediction and Outlook
6.12 Guizhou Yibai Pharmaceutical
6.12.1 Profile
6.12.2 Operation
6.12.3 Medical Services
6.12.4 Prediction and Outlook
6.13 Kangmei Pharmaceutical
6.13.1 Profile
6.13.2 Operation
6.13.3 Medical Services
6.13.4 Prediction and Outlook
6.14 Jiangnan Mould & Plastic Technology
6.14.1 Profile
6.14.2 Operation
6.14.3 Medical Services
6.14.4 Prediction and Outlook
6.15 Beijing Meizhong Jiahe Hospital Management
6.15.1 Profile
6.15.2 Operation
6.15.3 Major Clients
6.15.4 Medical Services
6.15.5 Prediction and Outlook
表:中国医院类型及简介
图:中国医院行业产业链
图:2009-2016年中国医院数量及同比增长量
图:2009-2016年中国医院数量(按医院等级)
图:2009-2016年中国医院数量占比(按医院等级)
图:2009-2016年中国医院数量(按经济类型)
图:2009-2016年中国医院数量占比(按经济类型)
表:2009-2016年中国医院数量(按类型)
表:截至2016年9月底中国医院数量(分地区)
图:2009-2016年中国医院总收入
图:2016年中国医院收入构成(按来源)
图:2016年中国医院收入构成(按医院类型)
图:2009-2016年中国医院诊疗人次
图:2012-2016年中国医院诊疗人次(按经济类型)
图:2012-2016年中国医疗诊疗人次构成(按经济类型)
图:2012-2016年中国医院诊疗人次(按医院类型)
图:2012-2016年中国医院诊疗人次构成(按医院等级)
图:2009-2016年中国医院病床使用率
图:2009-2016年中国医院病床使用率(按医院等级)
图:2016年中国医疗机构公立和民营医院数量占比(按种类)
表:2012-2016年中国医院行业主要民营企业医疗服务业务收入
图:2015-2020E中国医院数量及同比增长量
图:2015-2020E中国医院收入及同比增长率
图:2015-2020E中国医院收入(按经济类型)
图:2009-2020E中国民营医院数量及占医院总量比重
图:2009-2020E中国民营医院收入及占医院总收入比重
图:2009-2016年中国专科医院数量及占医院总量比重
图:2009-2016年中国专科医院数量占比(按经济类型)
表:2010-2016年中国专科医院数量(分类型)
图:2009-2016年中国专科医院收入及占医院总收入比重
表:2010-2016年中国专科医院收入(分类型)
表:2010-2016年中国专科医院利润率(分类型)
图:2009-2016年中国眼科医院数量(分经济类型)
表:2006-2016年中国眼科医院总收入及利润
表:2006-2016年中国眼科医院病床使用率及医师工作量
图:2009-2016年中国口腔医院数量(分经济类型)
表:2006-2016年中国口腔医院总收入及利润
表:2006-2016年中国口腔医院病床使用率及医师工作量
表:2016年中国主要民营口腔医疗机构及其连锁数量和分布情况
图:2009-2016年中国整形外科及美容医院数量(分经济类型)
表:2006-2016年中国整形外科及美容医院总收入及利润
图:2009-2016年中国妇产医院数量(分经济类型)
表:2006-2016年中国妇产医院总收入及利润
表:2006-2016年中国妇产医院病床使用率及医师工作量
图:2009-2016年中国儿童医院数量(分经济类型)
表:2006-2016年中国儿童医院总收入及利润
表:2006-2016年中国儿童医院病床使用率及医师工作量
图:2009-2016年中国肿瘤医院数量(分经济类型)
表:2006-2016年中国肿瘤医院总收入及利润
表:2006-2016年中国肿瘤医院病床使用率及医师工作量
图:2015-2020E中国专科医院数量及占医院总量比重
图:2015-2020E中国专科医院收入及占医院总收入比重
表:中国医保体系构成
图:2009-2015年中国城镇基本医疗保险参保人数(分类型)
图:2009-2015年中国新农合参合人数及参合率
图:2006-2016年中国城镇化率
图:2012-2015年中国医保基金累计结存(分类型)
表:2009-2016年中国县级医院建设扶持政策
图:2014-2020E中国医疗卫生机构每千人口病床数
表:1985-2016年中国社会资本进入医疗服务领域里程碑事件
表:2009-2016年中国社会资本进入医疗服务领域相关政策
表:中国民营医院与公立医院政策方面差别
图:中国公立医院委托代理链
图:2009-2016年中国公立医院收入及市场份额
图:2009-2016年中国民营医院收入及市场份额
表:中国主要医疗服务专科项目比较
表:中国医疗服务体系市场化趋势
表:中国公立医院既有产权制度改革模式
表:1999-2016年中国社会资本试水公立医院改制部分案例
表:中国部分中外合作经营医院合作方及主要医疗服务
表:中国部分外资主导合资医院合作方及主要服务
图:2011-2016年爱尔眼科营业收入及净利润
表:2015年爱尔眼科主要子公司营业收入及净利润
表:2014-2016年爱尔眼科营业收入(分业务)
表:2014-2016年爱尔眼科营业收入(分地区)
图:2012-2016年爱尔眼科营业收入构成(分地区)
图:2014-2016年爱尔眼科毛利率(分业务)
图:2012-2016年爱尔眼科研发支出
表:2016年爱尔眼科非公开发行股票计划投资项目
表: 2016年爱尔眼科收购标的营业收入及净利润
表:爱尔健康险股权结构
图:2013-2016年爱尔眼科门诊量
图:2013-2016年爱尔眼科手术量
图:2015-2020E爱尔眼科营业收入及净利润
图:2011-2016年通策医疗营业收入及净利润
表:2012-2016年通策医疗营业收入(分业务)
图:2012-2016年通策医疗营业收入(分地区)
图:2012-2016年通策医疗营业收入构成(分地区)
图:2012-2016年通策医疗毛利率
表:2012-2016年通策医疗毛利率(分业务)
表:2013-2016年通策医疗主要子公司营业收入及净利润
表:2015年通策医疗发行股份募集项目
图:2015-2020E通策医疗营业收入及净利润
图:2011-2016年马应龙营业收入及净利润
图:2012-2016年马应龙营业收入(分业务)
图:2012-2016年马应龙营业收入构成(分业务)
图:2012-2016年马应龙营业收入(分地区)
图:2012-2016年马应龙营业收入构成(分地区)
图:2012-2016年马应龙毛利率(分业务)
图:2012-2016年马应龙研发支出
表:2015年马应龙主要产品研发投入情况
表:马应龙旗下肛肠医院建立方式及股权占比
图:2015-2020E马应龙营业收入及净利润
图:2011-2016年复星医药营业收入及净利润
图:2011-2016年复星医药营业收入(分业务)
图:2011-2016年复星医药营业收入构成(分业务)
图:2011-2016年复星医药营业收入(分地区)
图:2011-2016年复星医药营业收入构成(分地区)
图:2011-2016年复星医药毛利率(分业务)
图:2012-2016年复星医药研发支出
表:2015年复星医药非公开发行股份数量及认购金额
表:复星医药主要控股医院
图:2015-2020E复星医药营业收入及净利润
图:2011-2016年金陵药业营业收入及净利润
图:2011-2016年金陵药业营业收入(分业务)
图:2011-2016年金陵药业营业收入构成(分业务)
图:2011-2016年金陵药业毛利率(分业务)
图:2012-2016年金陵药业研发支出
表:金陵药业主要控股医院
图:2015-2020E金陵药业营业收入及净利润
图:2011-2016年新华医疗营业收入及净利润
图:2011-2016年新华医疗营业收入(分业务)
图:2011-2016年新华医疗营业收入构成(分业务)
图:2011-2016年新华医疗营业收入(分地区)
图:2011-2016年新华医疗营业收入构成(分地区)
图:2011-2016年新华医疗毛利率(分业务)
图:2012-2015年新华医疗研发支出
表:新华医疗旗下医疗服务相关子公司
图:2015-2020E新华医疗营业收入及净利润
图:2011-2016年国际医学营业收入及净利润
图:2012-2016年国际医学营业收入(分业务)
图:2012-2016年国际医学营业收入构成(分业务)
表:2015年国际医学非公开发行股票发行对象及其获配股数、认购金额
图:2015-2020E国际医学营业收入及净利润
图:2011-2016年福瑞股份营业收入及净利润
图:2011-2016年福瑞股份营业收入(分业务)
图:2011-2016年福瑞股份营业收入构成(分业务)
图:2015-2020E福瑞股份营业收入及净利润
图:2011-2016年健民集团营业收入及净利润
图:2012-2016年健民集团营业收入(分业务)
图:2012-2016年健民集团营业收入构成(分业务)
图:2015-2020E健民集团营业收入及净利润
图:2012-2016年泰和诚营业收入及净利润
图:泰和诚服务网络覆盖地区
图:2011-2016年凤凰医疗营业收入及净利润
图:2011-2016年凤凰医疗综合医院服务营业收入
图:2014-2016年凤凰医疗医院管理服务营业收入(分医院)
图:2015-2020E凤凰医疗营业收入及净利润
图:2011-2016年益佰制药营业收入及净利润
图:2011-2016年益佰制药医疗服务营业收入
图:2015-2020E益佰制药营业收入及净利润
图:2011-2016年康美药业营业收入及净利润
图:2015-2020E康美药业营业收入及净利润
图:2011-2016年模塑科技营业收入及净利润
表:2014年模塑科技非公开发行股票预案募集资金用途
图:2015-2020E模塑科技营业收入及净利润
图:2013-2016年美中嘉和营业收入及净利润
表:2013-2015年美中嘉和前五名客户销售金额
表:2016年美中嘉和第二次股票发行方案募集资金用途
图:2015-2020E美中嘉和营业收入及净利润
Types and Introduction of Hospitals in China
Hospital Industry Chain in China
Number and YoY Growth of Hospitals in China, 2009-2016
Number of Hospitals in China by Hospital Level, 2009-2016
Percentage of Hospitals in China by Hospital Level, 2009-2016
Number of Hospitals in China by Economic Type, 2009-2016
Percentage of Hospitals in China by Economic Type, 2009-2016
Number of Hospitals in China by Type, 2009-2016
Number of Hospitals in China by Region as of Sept. 2016
Total Revenue of Hospitals in China, 2009-2016
Revenue Structure of Hospitals in China by Source, 2016
Revenue Structure of Hospitals in China by Hospital Type, 2016
Outpatient Visits to Hospitals in China, 2009-2016
Outpatient Visits to Hospitals in China by Economic Type, 2012-2016
Structure of Outpatient Visits to Hospitals in China by Economic Type, 2012-2016
Outpatient Visits to Hospitals in China by Hospital Type, 2012-2016
Structure of Outpatient Visits to Hospitals in China by Hospital Level, 2012-2016
Utilization of Hospital Beds in China, 2009-2016
Utilization of Hospital Beds in China by Hospital Level, 2009-2016
Proportion of Public Medical Institutions and Private Hospitals in China by Type, 2016
Medical Service Revenue of Major Private Hospitals in China, 2012-2016
Number and YoY Growth of Hospitals in China, 2015-2020E
Revenue and YoY Growth Rate of Hospitals in China, 2015-2020E
Revenue of Hospitals in China by Economic Type, 2015-2020E
Number of Private Hospitals and % of Total Hospitals in China, 2009-2020E
Revenue of Private Hospitals and % of Total Hospital Revenue in China, 2009-2020E
Number of Specialized Hospitals and % of Total Hospitals in China, 2009-2016
Proportion of Specialized Hospitals in China by Economic Type,
Number of Specialized Hospitals in China by Type, 2010-2016
Revenue of Specialized Hospitals and % of Total Hospital Revenue in China, 2009-2016
Revenue of Specialized Hospitals in China by Type, 2010-2016
Profit Margin of Specialized Hospitals in China by Type, 2010-2016
Number of Ophthalmic Hospitals in China by Economic Type, 2009-2016
Total Revenue and Profit of Ophthalmic Hospitals in China, 2006-2016
Bed Utilization and Doctor Workload of Ophthalmic Hospitals in China, 2006-2016
Number of Stomatological Hospitals in China by Economic Type, 2009-2016
Total Revenue and Profit of Stomatological Hospitals in China, 2006-2016
Bed Utilization and Doctor Workload of Stomatological Hospitals in China, 2006-2016
Number and Distribution of Major Private Stomatological Medical Institutions and Their Chains in China, 2016
Number of Orthopedics & Beauty Hospitals in China by Economic Type, 2009-2016
Total Revenue and Profit of Orthopedics & Beauty Hospitals in China, 2006-2016
Number of Obstetrics &GynecologyHospitals in China by Economic Type, 2009-2016
Total Revenue and Profit of Obstetrics &Gynecology Hospitals in China, 2006-2016
Bed Utilization and Doctor Workload of Obstetrics &Gynecology Hospitals in China, 2006-2016
Number of Children's Hospitals in China by Economic Type, 2009-2016
Total Revenue and Profit of Children's Hospitals in China, 2009-2016
Bed Utilization and Doctor Workload of Children's Hospitals in China, 2009-2016
Number of Tumor Hospitals in China by Economic Type, 2009-2016
Total Revenue and Profit of Tumor Hospitals in China, 2006-2016
Bed Utilization and Doctor Workload of Tumor Hospitals in China, 2006-2016
Number of Specialized Hospitals and % of Total Hospitals in China, 2015-2020E
Revenue of Specialized Hospitals and % of Total Hospital Revenue in China, 2015-2020E
Structure of Medical Insurance System in China
Number of People Participating in China's Urban Resident Basic Medical Insurance by Type, 2009-2015
Number of People Participating in Chinas New Rural Cooperative Medical Scheme and Participation Rate, 2009-2015
Rate of Utilization in China, 2006-2016
Cumulative Balance of Medical Insurance Fund in China by Type, 2012-2015
Polices Supporting Construction of County-level Hospitals in China, 2009-2016
Number of Hospital Beds per Thousand Population in Chinese Medical and Health Institutions, 2014-2020E
Milestones of Social Capital Inrush to Medical Service Field in China, 1985-2016
Policies on Social Capital Flowing to Medical Service Field in China, 2009-2016
Policy Differences between Private and Public Hospitals in China
Principal-agent Chain of Public Hospitals in China
Revenue and Market Share of Public Hospitals in China, 2009-2016
Revenue and Market Share of Private Hospitals in China, 2009-2016
Comparison of Major Medical Service Items in China
Medical Service System Marketing Tendency in China
Existing Property Right System Reform Models of Public Hospitals in China
Cases of China’s Social Capital Contributing to Public Hospital Restructuring, 1999-2016
Partners and Major Medical Services of Some Sino-foreign Cooperative Hospitals in China
Partners and Major Services of Some Foreign-led Joint Venture Hospitals in China
Revenue and Net Income of Aier Eye Hospital, 2011-2016
Revenue and Net Income of Major Subsidiaries of Aier Eye Hospital, 2015
Revenue Breakdown of Aier Eye Hospital by Business, 2014-2016
Revenue Breakdown of Aier Eye Hospital by Region, 2014-2016
Revenue Structure of Aier Eye Hospital by Region, 2012-2016
Gross Margin of Aier Eye Hospital by Business, 2014-2016
R&D Expenditures of Aier Eye Hospital, 2012-2016
Planned Investment Projects by Non-public Stock Issuance of Aier Eye Hospital, 2016
Acquisition Target Revenue and Net Income of Aier Eye Hospital, 2016
Ownership Structure of Aier Health Insurance
Outpatient Visits of Aier Eye Hospital, 2013-2016
Surgical Operations of Aier Eye Hospital, 2013-2016
Revenue and Net Income of Aier Eye Hospital, 2015-2020E
Revenue and Net Income of TC Medical, 2011-2016
Revenue Breakdown of TC Medical by Business, 2012-2016
Revenue Breakdown of TC Medical by Region, 2012-2016
Revenue Structure of TC Medical by Region, 2012-2016
Gross Margin of TC Medical, 2012-2016
Gross Margin of TC Medical by Business, 2012-2016
Revenue and Net Income of Major Subsidiaries of TC Medical, 2013-2016
Projects Raised by Issuing Shares of TC Medical, 2015
Revenue and Net Income of TC Medical, 2015-2020E
Revenue and Net Income of Mayinglong Pharm, 2011-2016
Revenue Breakdown of Mayinglong Pharm by Business, 2012-2016
Revenue Structure of Mayinglong Pharm by Business, 2012-2016
Revenue Breakdown of Mayinglong Pharm by Region, 2012-2016
Revenue Structure of Mayinglong Pharm by Region, 2012-2016
Gross Margin of Mayinglong Pharm by Business, 2012-2016
R&D Expenditures of Mayinglong Pharm, 2012-2016
R&D Investment in Major Products of Mayinglong Pharm, 2015
Establishment Mode and Equity Structure of Anorectal Hospitals under Mayinglong Pharm
Revenue and Net Income of Mayinglong Pharm, 2015-2020E
Revenue and Net Income of Shanghai Fosun Pharmaceutical, 2011-2016
Revenue Breakdown of Shanghai Fosun Pharmaceutical by Business, 2011-2016
Revenue Structure of Shanghai Fosun Pharmaceutical by Business, 2011-2016
Revenue Breakdown of Shanghai Fosun Pharmaceutical by Region, 2011-2016
Revenue Structure of Shanghai Fosun Pharmaceutical by Region, 2011-2016
Gross Margin of Shanghai Fosun Pharmaceutical by Business, 2011-2016
R&D Expenditures of Shanghai Fosun Pharmaceutical, 2012-201
Non-public Stock Issuance and Subscription Amount of Shanghai Fosun Pharmaceutical, 2015
Major Controlled Hospitals of Shanghai Fosun Pharmaceutical
Revenue and Net Income of Shanghai Fosun Pharmaceutical, 2015-2020E
Revenue and Net Income of Jinling Pharmaceutical, 2011-2016
Revenue Breakdown of Jinling Pharmaceutical by Business, 2011-2016
Revenue Structure of Jinling Pharmaceutical by Business, 2011-2016
Gross Margin of Jinling Pharmaceutical by Business, 2011-2016
R&D Expenditures of Jinling Pharmaceutical, 2012-2016
Major Controlled Hospitals of Jinling Pharmaceutical
Revenue and Net Income of Jinling Pharmaceutical, 2015-2020E
Revenue and Net Income of Shinva Medical Instrument, 2011-2016
Revenue Breakdown of Shinva Medical Instrument by Business, 2011-2016
Revenue Structure of Shinva Medical Instrument by Business, 2011-2016
Revenue Breakdown of Shinva Medical Instrument by Region, 2011-2016
Revenue Structure of Shinva Medical Instrument by Region, 2011-2016
Gross Margin of Shinva Medical Instrument by Business, 2011-2016
R&D Expenditures of Shinva Medical Instrument, 2012-2015
Medical Service Related Subsidiaries of Shinva Medical Instrument
Revenue and Net Income of Shinva Medical Instrument, 2015-2020E
Revenue and Net Income of Xi’an International Medical Investment, 2011-2016
Revenue Breakdown of Xi’an International Medical Investment by Business, 2012-2016
Revenue Structure of Xi’an International Medical Investment by Business, 2012-2016
Objects for Non-public Stock Issuance, Their Rationed Shares, and Subscription Amount of Xi'an International Medical Investment, 2015
Revenue and Net Income of Xi’an International Medical Investment, 2015-2020E
Revenue and Net Income of Inner Mongolia Furui Medical Science, 2011-2016
Revenue Breakdown of Inner Mongolia Furui Medical Science by Business, 2011-2016
Revenue Structure of Inner Mongolia Furui Medical Science by Business, 2011-2016
Revenue and Net Income of Inner Mongolia Furui Medical Science, 2015-2020E
Revenue and Net Income of Wuhan Jianmin Pharmaceutical Group, 2011-2016
Revenue Breakdown of Wuhan Jianmin Pharmaceutical Group by Business, 2012-2016
Revenue Structure of Wuhan Jianmin Pharmaceutical Group by Business, 2012-2016
Revenue and Net Income of Wuhan Jianmin Pharmaceutical Group, 2015-2020E
Revenue and Net Income of Concord Medical Services, 2012-2016
Service Network Coverage of Concord Medical Services
Revenue and Net Income of Phoenix Healthcare Group, 2011-2016
General Hospital Service Revenue of Phoenix Healthcare Group, 2011-2016
Hospital Management Service Revenue of Phoenix Healthcare Group by Hospital, 2014-2016
Revenue and Net Income of Phoenix Healthcare Group, 2015-2020E
Revenue and Net Income of Guizhou Yibai Pharmaceutical, 2011-2016
Medical Service Revenue of Guizhou Yibai Pharmaceutical, 2011-2016
Revenue and Net Income of Guizhou Yibai Pharmaceutical, 2015-2020E
Revenue and Net Income of Kangmei Pharmaceutical, 2011-2016
Revenue and Net Income of Kangmei Pharmaceutical, 2015-2020E
Revenue and Net Income of Jiangnan Mould & Plastic Technology, 2011-2016
Purpose of Funds Raised through Non-public Stock Issuance Plan of Jiangnan Mould & Plastic Technology, 2014
Revenue and Net Income of Jiangnan Mould & Plastic Technology, 2015-2020E
Revenue and Net Income of Beijing Meizhong Jiahe Hospital Management, 2013-2016
Sales from Top 5 Customers of Beijing Meizhong Jiahe Hospital Management, 2013-2015
Purpose of Funds Raised through Second Stock Issuance Scheme of Beijing Meizhong Jiahe Hospital Management, 2016
Revenue and Net Income of Beijing Meizhong Jiahe Hospital Management, 2015-2020E
如果这份报告不能满足您的要求,我们还可以为您定制报告,请 留言说明您的详细需求。
|