|
|
|
报告导航:研究报告—
制造业—能源矿产
|
|
2016-2020年中国碳化硅行业研究报告 |
 |
字数:4.1万 |
页数:112 |
图表数:126 |
|
中文电子版:8000元 |
中文纸版:4000元 |
中文(电子+纸)版:8500元 |
|
英文电子版:2100美元 |
英文纸版:2300美元 |
英文(电子+纸)版:2400美元 |
|
编号:ZLC-044
|
发布日期:2017-02 |
附件:下载 |
 |
|
|
中国是全球最大的碳化硅生产和出口国,目前产能达220万吨,占全球碳化硅总产能的80%以上,不过由于产能扩张过快、需求过剩导致产能利用率不到50%。2015年中国碳化硅产量102万吨,产能利用率仅46.4%;估计2016年产量约105万吨左右,产能利用率47.7%。
自中国碳化硅出口配额制度取消后,2013-2014年中国碳化硅出口量增长较快,2015-2016年趋于稳定。2016年,碳化硅出口量为321.5千吨,同比增长2.1%。其中,宁夏出口量达111.9千吨,占出口总量的34.9%,是中国碳化硅的主要出口地区。
由于中国碳化硅产品主要是低端初加工产品,附加价值不高,因此出口均价与进口均价差距较大。2016年,中国碳化硅出口均价0.9美元/千克,不及进口均价4.3美元/千克的1/4。
碳化硅下游应用广泛,包括钢铁、耐火材料、陶瓷、光伏、电子等。近年碳化硅被列入第三代半导体材料,成为全球研发、应用的热点。2015年,全球碳化硅衬底市场规模约1.11亿美元;碳化硅功率器件约1.75亿美元;预计未来5年年均增速均在20%以上。
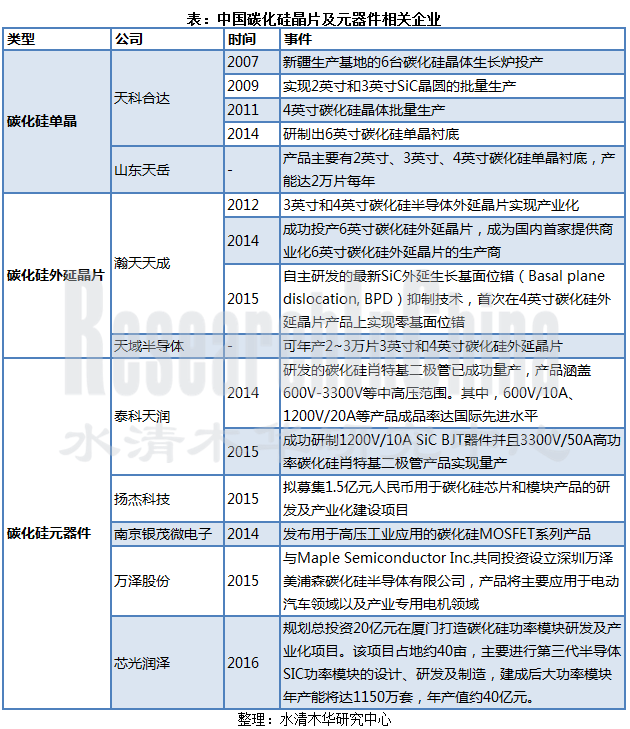
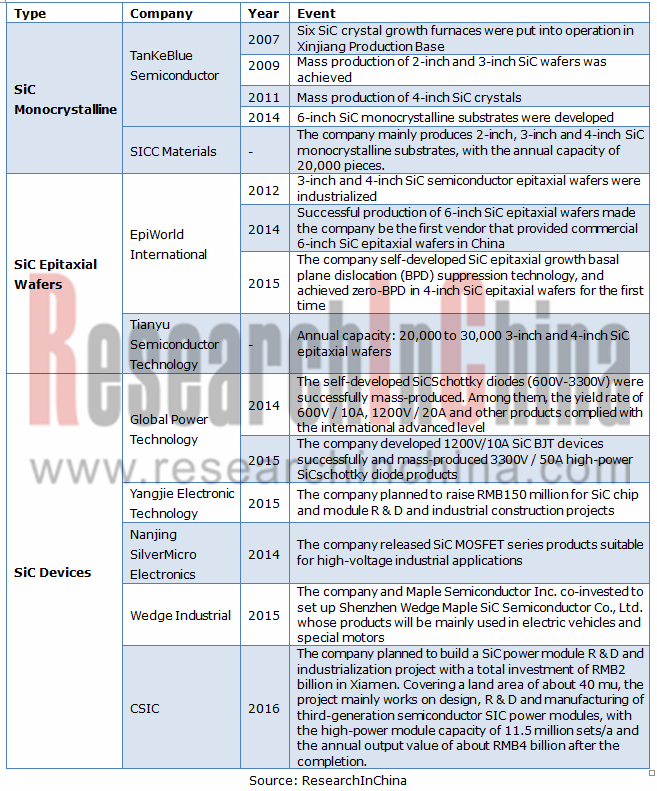
目前中国半导体碳化硅在研发方面已取得一定成效,实现了2英寸、3英寸、4英寸、6英寸的碳化硅单晶衬底和碳化硅外延晶片,以及碳化硅元器件的量产。代表企业有天科合达、山东天岳、瀚天天成、天域半导体、泰科天润、南京银茂微电子。
如今,推进碳化硅晶体及器件的发展已经被列入《中国制造2025》、《新材料产业发展指南》、《国家中长期科学和技术发展规划纲要( 2006—2020 年)》等多个产业政策中。受多重利好政策以及新能源汽车、智能电网等多个新兴市场的拉动,预计未来中国半导体碳化硅市场将迎来快速发展。
《2016-2020年中国碳化硅行业研究报告》主要包括以下内容:
 全球碳化硅行业发展概况,包括碳化硅原料和碳化硅晶片发展现状分析; 全球碳化硅行业发展概况,包括碳化硅原料和碳化硅晶片发展现状分析;
中国碳化硅行业发展概况,包括发展现状、相关政策、市场供需、竞争格局、进出口分析、价格趋势及发展趋势分析等;
中国碳化硅行业上下游行业发展概况分析;
18家碳化硅相关企业介绍,包括经营情况、碳化硅业务分析等。
China is the largest producer and exporter of silicon carbide in the world, with the capacity reaching 2.2 million tons, sweeping more than 80% of the global total. However, excessive capacity expansion and oversupply lead to the capacity utilization less than 50%. In 2015, the silicon carbide output in China totaled 1.02 million tons, with the capacity utilization rate of only 46.4%; in 2016, the total output was estimated to be about 1.05 million tons, with the capacity utilization rate of 47.7%.
Since China's silicon carbide export quota was abolished, China’s silicon carbide export volume grew rapidly during 2013-2014, and tended to stabilize during 2015-2016. In 2016, China’s silicon carbide exports came to 321,500 tons, up 2.1% year on year; wherein, Ningxia’s export volume amounted to 111,900 tons, accounting for 34.9% of the total exports and acting as a main silicon carbide exporter in China.
As China's silicon carbide products are mainly low-end preliminarily processed products with moderate added value, the average price gap between export and import is enormous. In 2016, China's silicon carbide exports had the average price at USD0.9 / kg, less than 1/4 of the import average price (USD4.3 / kg).
Silicon carbide is widely used in iron& steel, refractories, ceramics, photovoltaic, electronics and so on. In recent years, silicon carbide has been included in the third generation of semiconductor materials as a hot spot of the global R & D and applications. In 2015, the global silicon carbide substrate market size reached about USD111 million, and the size of silicon carbide power devices reached about USD175 million; both of them will see the average annual growth rate of more than 20% in the next five years.
At present, China has succeeded in R & D of semiconductor silicon carbide, and realized the mass production of 2-inch, 3-inch, 4-inch and 6-inch silicon carbide monocrystalline substrates, silicon carbide epitaxial wafers, and silicon carbide components. Representative enterprises include TanKeBlue Semiconductor, SICC Materials, EpiWorld International, Dongguan Tianyu Semiconductor, Global Power Technology and Nanjing SilverMicro Electronics.
Today, the development of silicon carbide crystals and devices has been contained in Made in China 2025, New Material Industry Development Guide, National Medium and Long-term Science and Technology Development Plan (2006-2020) and many other industrial policies. Driven by multiple favorable policies and emerging markets such as new energy vehicles and smart grid, Chinese semiconductor silicon carbide market will witness quick development in future.
SiC Wafer and Device-related Enterprises in China
The report mainly deals with the followings:
 Development of global silicon carbide industry, including the status quo of SiC raw materials and SiC wafer, etc. Development of global silicon carbide industry, including the status quo of SiC raw materials and SiC wafer, etc.
Development of China silicon carbide industry, including status quo, supply and demand, competitive landscape, import & export, price trend, and development trends, etc.;
Development of upstream and downstream sectors of silicon carbide industry;
Operation, silicon carbide business, etc. of 18 silicon carbide manufacturers.
第一章概述
1.1 定义及分类
1.2 性质及应用
1.3 市场特点
第二章全球碳化硅行业发展概况
2.1 碳化硅原料
2.2 碳化硅晶片及器件
2.2.1 发展现状
2.2.2 市场规模
2.2.3 竞争格局
2.2.4 发展趋势
第三章中国碳化硅行业发展概况
3.1 发展现状
3.1.1 碳化硅原料
3.1.2 碳化硅晶片及器件
3.2 相关政策
3.3 市场供需
3.4 竞争格局
3.4.1 原料生产企业
3.4.2 晶片及器件相关企业
3.5 进出口分析
3.5.1 进口分析
3.5.2 出口分析
3.5.3 进出口均价对比
3.6 价格走势
3.6.1 绿碳化硅
3.6.2 黑碳化硅
3.7 发展趋势
3.7.1 行业整合提高产业集中度
3.7.2 碳化硅产品质量将逐步提升
3.7.3 下游行业需求增长利好行业好展
3.7.4 废砂浆回收将成太阳能硅片切割刃料的一大发展趋势
3.7.5 碳化硅晶片需求增长,碳化硅元器件应用逐步打开
第四章中国碳化硅上下游行业发展概况
4.1 上游行业
4.1.1 石英砂
4.1.2 无烟煤
4.1.3 石油焦
4.2 下游行业
4.2.1 磨料行业
4.2.2 耐火材料
4.2.3 钢铁行业
4.2.4 陶瓷行业
4.2.5 电子行业
4.2.6 新能源汽车行业
第五章主要企业
5.1 河南易成新能源股份有限公司
5.1.1 公司简介
5.1.2 经营情况
5.1.3 营收构成
5.1.4 毛利率
5.1.5 研发与投资
5.1.6 供销情况
5.1.7 碳化硅业务
5.1.8 预测与展望
5.2 宁夏东方钽业股份有限公司
5.2.1 公司简介
5.2.2 经营情况
5.2.3 营收构成
5.2.4 毛利率
5.2.5 碳化硅业务
5.2.6 预测与展望
5.3 江苏浩博新材料股份有限公司
5.3.1 公司简介
5.3.2 经营情况
5.3.3 营收构成
5.3.4 毛利率
5.3.5 碳化硅业务
5.3.6 预测与展望
5.4 北京天科合达半导体股份有限公司
5.4.1 公司简介
5.4.2 经营情况
5.4.3 营收构成
5.4.4 毛利率
5.4.5 供销情况
5.4.6 研发与投资
5.4.7碳化硅业务
5.4.8预测与展望
5.5潍坊六合微粉有限公司
5.5.1 公司简介
5.5.2 碳化硅业务
5.6 兰州河桥硅电资源有限公司
5.6.1 公司简介
5.6.2 碳化硅业务
5.7 宁夏金旌新材料股份有限公司
5.7.1 公司简介
5.7.2 碳化硅业务
5.8 通化宏信研磨材有限责任公司
5.8.1 公司简介
5.8.2 碳化硅业务
5.9 临沭县正宇碳化硅厂
5.9.1 公司简介
5.9.2 碳化硅业务
5.10 江苏乐园新材料集团有限公司
5.10.1 公司简介
5.10.2 碳化硅业务
5.11 汉江弘源襄阳碳化硅特种陶瓷有限责任公司
5.11.1 公司简介
5.11.2 碳化硅业务
5.11.3 发展优势
5.12 伊犁麦斯特碳化硅制品有限公司
5.12.1 公司简介
5.12.2 碳化硅业务
5.13 山东天岳晶体材料有限公司
5.13.1 公司简介
5.13.2 碳化硅业务
5.14 瀚天天成电子科技(厦门)有限公司
5.14.1 公司简介
5.14.2 碳化硅业务
5.15 东莞天域半导体科技有限公司
5.15.1 公司简介
5.15.2 碳化硅业务
5.16 泰科天润半导体科技(北京)有限公司
5.16.1 公司简介
5.16.2 碳化硅业务
5.17 其他企业
5.17.1 新疆龙海硅业发展有限公司
5.17.2 山东金蒙新材料股份有限公司
1 Overview
1.1 Definition and Classification
1.2 Properties and Applications
1.3 Market Features
2 Development of Global Silicon Carbide Industry
2.1 SiC Raw Materials
2.2 SiC Wafers and Devices
2.2.1 Status Quo
2.2.2 Market Size
2.2.3 Competitive Pattern
2.2.4 Development Trend
3 Development of China Silicon Carbide Industry
3.1 Status Quo
3.1.1 SiC Raw Materials
3.1.2 SiC Wafers and Devices
3.2 Policies
3.3 Supply and Demand
3.4 Competitive Landscape
3.4.1 Raw Materials Manufacturers
3.4.2 Wafer and Device-related Enterprises
3.5 Import and Export
3.5.1 Import
3.5.2 Export
3.5.3 Average Price Comparison of Imports and Exports
3.6 Price Trend
3.6.1 Green Silicon Carbide
3.6.2 Black Silicon Carbide
3.7 Development Trends
3.7.1 Industrial Integration Helps Boost Industrial Concentration
3.7.2 SiC Product Quality Gets Improved
3.7.3 Growth in Demand from Downstream Sectors Promote the Development of the Industry
3.7.4 Waste Mortar Recycling Will Be a Major Development Trend of Solar Silicon Wafer Cutting Blade Materials
3.7.5 Demand for SiC Wafers Grows, Applications of SiC Components Gradually Expand
4 Upstream and Downstream Sectors of China Silicon Carbide Industry
4.1 Upstream Sectors
4.1.1 Quartz Sand
4.1.2 Anthracite
4.1.3 Petroleum Coke
4.2 Downstream Sectors
4.2.1 Abrasives
4.2.2 Refractories
4.2.3 Iron & Steel
4.2.4 Ceramics
4.2.5 Electronics
4.2.6 New Energy Vehicles
5 Key Enterprises
5.1 Henan Yicheng New Energy Co., Ltd.
5.1.1 Profile
5.1.2 Operation
5.1.3 Revenue Structure
5.1.4 Gross Margin
5.1.5 R&D and Investment
5.1.6 Supply and Marketing
5.1.7 Silicon Carbide Business
5.1.8 Prediction and Outlook
5.2 Ningxia Orient Tantalum Industry Co., Ltd.
5.2.1 Profile
5.2.2 Operation
5.2.3 Revenue Structure
5.2.4 Gross Margin
5.2.5 Silicon Carbide Business
5.2.6 Prediction and Outlook
5.3 Jiangsu Haobo New Materials Co., Ltd
5.3.1 Profile
5.3.2 Operation
5.3.3 Revenue Structure
5.3.4 Gross Margin
5.3.5 Silicon Carbide Business
5.3.6 Prediction and Outlook
5.4 Beijing TanKeBlue Semiconductor Co., Ltd.
5.4.1 Profile
5.4.2 Operation
5.4.3 Revenue Structure
5.4.4 Gross Margin
5.4.5 Supply and Marketing
5.4.6 R&D and Investment
5.4.7Silicon Carbide Business
5.4.8 Prediction and Outlook
5.5Weifang Liuhe Sic Micro Powder Co., Ltd.
5.5.1 Profile
5.5.2 Silicon Carbide Business
5.6 Lanzhou Heqiao Resource Co., Ltd.
5.6.1 Profile
5.6.2 Silicon Carbide Business
5.7 Ningxia JinjingMetallurgicals and Minerals Industrial Co., Ltd
5.7.1 Profile
5.7.2 Silicon Carbide Business
5.8 TonghuaHongxin Abrasive Co., Ltd.
5.8.1 Profile
5.8.2 Silicon Carbide Business
5.9 LinshuZhengyu Silicon Carbide Factory
5.9.1 Profile
5.9.2 Silicon Carbide Business
5.10 Jiangsu LeyuanNew Materials Group Co., Ltd.
5.10.1 Profile
5.10.2 Silicon Carbide Business
5.11 HanjiangHongyuanXiangyang Silicon Carbide Special Ceramics Co., Ltd.
5.11.1 Profile
5.11.2 Silicon Carbide Business
5.11.3 Development Advantages
5.12 Yili Master Carborundum Products Co., Ltd.
5.12.1 Profile
5.12.2 Silicon Carbide Business
5.13 SICC Materials Co., Ltd
5.13.1 Profile
5.13.2 Silicon Carbide Business
5.14 EpiWorld International Co., Ltd
5.14.1 Profile
5.14.2 Silicon Carbide Business
5.15 Dongguan Tianyu Semiconductor Technology Co., Ltd.
5.15.1 Profile
5.15.2 Silicon Carbide Business
5.16 Global Power Technology (Beijing) Co. Ltd.
5.16.1 Profile
5.16.2 Silicon Carbide Business
5.17 Other Enterprises
5.17.1 Xinjiang Longhai Silicon Industry Development Co., Ltd.
5.17.2 Shandong Jinmeng New Materials Co., Ltd.
图:2016年全球碳化硅产能(分地区)
图:2009-2016年全球碳化硅下游需求量占比
图:碳化硅材料与硅及氮化镓材料性能对比
表:各代半导体材料性能对比
表:全球主要碳化硅晶片企业及其产品尺寸
图:碳化硅功率器件分类
图:碳化硅材料主要应用领域
表:部分国家地区支持发展碳化硅材料的相关政策
图:2010-2020E全球碳化硅衬底市场规模(分应用领域)
图:2010-2020E全球碳化硅功率器件市场规模(分应用领域)
表:全球碳化硅晶片及元器件相关企业
图:2014-2020年中国碳化硅产量(分类型)
表:2005-2017年中国碳化硅行业相关政策
图:2015-2020年中国碳化硅需求量(分地区)
图:2016-2020E中国新能源汽车领域对碳化硅功率器件的需求量
图:2016年中国主要碳化硅生产企业产能
表:中国碳化硅晶片及元器件相关企业
图:2009-2016年中国碳化硅进口量及进口金额
表:2016年中国碳化硅进口量前十来源国家地区
表:2016年中国碳化硅进口量前十目的地区
图:2009-2016年中国碳化硅出口量及出口金额
表:2016年中国碳化硅出口量前十国家地区
表:2016年中国碳化硅出口量前十来源地区
图:2009-2016年中国碳化硅进出口均价对比
表:2016-2017年中国绿碳化硅原块(98%)价格走势
表:2016-2017年中国欧洲标准绿碳化硅微粉价格走势
表:2016-2017年中国日本标准绿碳化硅微粉价格走势
表:2016-2017年中国黑碳化硅原块(98%)价格走势
表:2016-2017年中国黑碳化硅段砂价格走势
表:2016-2017年中国黑碳化硅微粉价格走势
图:中国石英砂储量分布
图:2009-2016年中国无烟煤产量
图:2009-2016年中国石油焦产量
表:2016年1-10月中国石油焦产量(分地区)
图:太阳能光伏产业链示意图
图:硅片切割示意图
图:2009-2020年中国光伏装机容量
图:2012-2016年中国耐火材料产量(分类型)
图:2009-2020年中国粗钢产量
图:2009-2020年中国陶瓷砖产量
图:2009-2016年中国特种陶瓷规模以上企业数量及主营收入
表:中国LED行业区域分布
图:2009-2020年中国LED行业产值
图:2009-2016年中国LED行业产值(分类型)
图:2009-2016年中国电子元件产量
表:碳化硅的相对优势
表:2011-2016年中国新能源汽车产销量(分类型)
图:2016-2020E中国新能源汽车产销量
图:2016-2020年中国新能源汽车领域碳化硅功率器件的潜在市场规模
图:2011-2016年易成新能营业收入及净利润
表:2016上半年易成新能主要子公司净利润
图:2011-2016年易成新能营业收入(分业务)
图:2011-2016年易成新能营业收入构成(分业务)
图:2011-2016年易成新能营业收入(分地区)
图:2011-2016年易成新能营业收入构成(分地区)
图:2013-2016年易成新能毛利率(分业务)
图:2012-2016年易成新能研发支出及占总营收比重
表:2015-2016年易成新能前5大供应商采购额
表:2015-2016年易成新能前5名客户销售额
表:2013-2015年易成新能产销库存量(分产品)
表:2015年易成新能碳化硅相关子公司营业收入及净利润
图:易成新能主要布局
图:2015-2020E易成校招能营业收入及净利润
图:2011-2016年东方钽业营业收入及净利润
图:2012-2016年东方钽业营业收入(分业务)
图:2012-2016年东方钽业营业收入构成(分业务)
图:2012-2016年东方钽业营业收入(分地区)
图:2012-2016年东方钽业营业收入构成(分地区)
图:2012-2016年东方钽业毛利率(分业务)
图:2012-2016年东方钽业碳化硅业务收入及占总营收比重
表:东方钽业碳化硅产品规格
图:2015-2020E东方钽业营业收入及净利润
图:浩博新材主要客户
图:2013-2016年浩博新材营业收入及净利润
图:2013-2016年浩博新材营业收入(分业务)
图:2013-2016年浩博新材营业收入构成(分业务)
图:2013-2016年浩博新材毛利率
图:浩博新材料业务发展历程
图:2015-2020E浩博新材营业收入及净利润
图:2014-2016年天科合达营业收入及净利润
图:2014-2016年天科合达营业收入(分产品)
图:2014-2016年天科合达营业收入构成(分产品)
图:2014-2016年天科合达营业收入(分地区)
图:2014-2016年天科合达营业收入构成(分地区)
图:2014-2016年天科合达毛利率
图:2014-2016年天科合达前五名客户销售金额
表:2016年天科合达前十大销售合同履行情况
表:2014-2016年天科合达前五名供应商采购金额
图:2014-2016年天科合达研发支出
图:天科合达6英寸导电型碳化硅晶体
图:天科合达2-4英寸导电型碳化硅晶片
图:天科合达X英寸半绝缘型碳化硅晶体
图:天科合达2-4英寸半绝缘型碳化硅晶片
图:天科合达2英寸SiC晶片产品标准
图:天科合达3英寸SiC晶片产品标准
图:天科合达4英寸SiC晶片产品标准
图:天科合达6英寸SiC晶片产品标准
图:天科合达试片级SiC晶体标准
图:2015-2020E天科合达营业收入及净利润
表:潍坊六合发展历程
表:潍坊六合股权结构
表:潍坊六合产品规格、用途及产能
表:兰州河桥发展历程
表:兰州河桥股权结构
表:兰州河桥黑碳化硅粒度砂规格
表:兰州河桥黑碳化硅细粉规格
表:兰州河桥高密度大结晶黑碳化硅规格
图:兰州河桥高密度大结晶黑碳化硅
表:兰州河桥黑碳化硅段砂规格
表:宁夏金旌黑碳化硅规格
表:通化宏信股权结构
表:乐园新材料主要产品
表:汉江弘源大结晶黑碳化硅主要性能指标
表:汉江弘源碳化硅工业泵规格型号
表:山东天岳股权结构
图:山东天岳国外销售网络
图:山东天岳国内销售网络
表:山东天岳N-型——2英寸衬底规格参数
表:山东天岳N-型——3英寸衬底规格参数
表:山东天岳N-型——4英寸衬底规格参数
表:天域半导体股权结构
图:天域半导体6英寸碳化硅外延晶片参数
图:天域半导体4英寸碳化硅外延晶片参数
图:泰科天润碳化硅肖特基二极管
表:泰科天润第三代碳化硅肖特基二极管规格参数
表:新疆龙海股权结构
Global Silicon Carbide Capacity (by Region), 2016
Structure of Downstream Demand for Silicon Carbide Worldwide, 2009-2016
Performance Comparison of SiC Materials and Carbon and Gallium Nitride Materials
Performance Comparison of Various Generations of Semiconductor Materials
Major Global SiC Wafer Vendors and Dimensions of Their Products
Classification of SiC Power Devices
Main Applications of Silicon Carbide Materials
Policies on Supporting the Development of SiC Materials in Some Countries
Global SiC Substrate Market Size (by Application), 2010-2020E
Global SiC Power Device Market Size (by Application), 2010-2020E
Global SiC Wafer and Device-related Companies
China’s Silicon Carbide Output by Type, 2014-2020E
Policies on Silicon Carbide Industry in China, 2005-2017E
China’s Demand for Silicon Carbide by Region, 2015-2020E
Demand for SiC Power Devices from NEV Field in China, 2016-2020E
Capacity of Major Silicon Carbide Producers in China, 2016
SiC Wafer and Device-related Companies in China
China’s Import Volume and Value of Silicon Carbide, 2009-2016
Top10 Sources of China’s Silicon Carbide Imports by Import Volume, 2016
Top10 Destinations of China’s Silicon Carbide Imports by Import Volume, 2016
China’s Export Volume and Value of Silicon Carbide, 2009-2016
Top10 Destinations of China’s Silicon Carbide Exports by Export Volume, 2016
Top10 Sources of China’s Silicon Carbide Exports by Export Volume, 2016
Average Import and Export Prices of Silicon Carbide in China, 2009-2016
Price Trend of Green Silicon Carbide Lump (98%) in China, 2016-2017E
Price Trend of Green Silicon Carbide Powder (European Standard) in China, 2016-2017E
Price Trend of Green Silicon Carbide Powder (Japanese Standard) in China, 2016-2017E
Price Trend of Black Silicon Carbide Lump (98%) in China, 2016-2017E
Price Trend of Black Silicon Carbide Sand in China, 2016-2017E
Price Trend of Black Silicon Carbide Powder in China, 2016-2017E
Distribution of Quartz Sand in China
China’s Anthracite Output, 2009-2016
China’s Petroleum Coke Output, 2009-2016
China’s Petroleum Coke Output by Region, Jan-Oct 2016
Diagram of Solar PV Industry Chain
Diagram of Silicon Wafer Cutting
Installed Capacity of Solar PV in China, 2009-2020E
China’s Output of Refractory Materials (by Type), 2012-2016
China’s Output of Crude Steel, 2009-2020E
China’s Output of Ceramic Tiles, 2009-2020E
Number of Special Ceramics Companies (with Annual Revenue of RMB20 mln or More from Their Main Business Operations) and Their Operating Revenue, 2009-2016
Geographical Distribution of LED Industry in China
Output Value of LED Industry in China, 2009-2020E
Output Value of LED Industry in China (by Type), 2009-2016
China’s Output of Electronic Components, 2009-2016
Comparative Advantages of Silicon Carbide
China’s Output and Sales of NEVs (by Type), 2011-2016
China’s Output and Sales of NEVs, 2016-2020E
Market Size of SiC Power Devices in NEV Field in China, 2016-2020E
Revenue and Net Income of Yicheng New Energy, 2011-2016
Net Income of Yicheng New Energy’s Major Subsidiaries, 2016H1
Revenue Breakdown of Yicheng New Energy by Business, 2011-2016
Revenue Structure of Yicheng New Energy by Business, 2011-2016
Revenue Breakdown of Yicheng New Energy by Region, 2011-2016
Revenue Structure of Yicheng New Energy by Region, 2011-2016
Gross Margin of Yicheng New Energy by Business, 2013-2016
R&D Expenditure of Yicheng New Energy and % of Total Revenue, 2012-2016
Yicheng New Energy’s Procurement from Top5 Suppliers, 2015-2016
Yicheng New Energy’s Sales from Top5 Customers, 2015-2016
Output, Sales, and Inventory of Yicheng New Energy (by Product), 2013-2015
Revenue and Net Income of Yicheng New Energy’s Silicon Carbide-related Subsidiaries, 2015
Yicheng New Energy’s Presence
Revenue and Net Income of Yicheng New Energy, 2015-2020E
Revenue and Net Income of Ningxia Orient Tantalum Industry, 2011-2016
Revenue Breakdown of Ningxia Orient Tantalum Industry (by Business), 2012-2016
Revenue Structure of Ningxia Orient Tantalum Industry (by Business), 2012-2016
Revenue Breakdown of Ningxia Orient Tantalum Industry (by Region), 2012-2016
Revenue Structure of Ningxia Orient Tantalum Industry (by Region), 2012-2016
Gross Margin of Ningxia Orient Tantalum Industry (by Business), 2012-2016
Ningxia Orient Tantalum Industry’s Revenue from Silicon Carbide Business and % of Total Revenue, 2012-2016
Specifications of Ningxia Orient Tantalum Industry’s Silicon Carbide Products
Revenue and Net Income of Ningxia Orient Tantalum Industry, 2015-2020E
Major Customers of Haobo New Materials
Revenue and Net Income of Haobo New Materials, 2013-2016
Revenue Breakdown of Haobo New Materials (by Business), 2013-2016
Revenue Structure of Haobo New Materials (by Business), 2013-2016
Gross Margin of Haobo New Materials, 2013-2016
Development History of Haobo New Materials
Revenue and Net Income of Haobo New Materials, 2015-2020E
Revenue and Net Income of TankeBlue Semiconductor, 2014-2016
Revenue Breakdown of TankeBlue Semiconductor by Product, 2014-2016
Revenue Structure of TankeBlue Semiconductor (by Product), 2014-2016
Revenue Breakdown of TankeBlue Semiconductor (by Region), 2014-2016
Revenue Structure of TankeBlue Semiconductor (by Region), 2014-2016
Gross Margin of TankeBlue Semiconductor
TankeBlue Semiconductor’s Sales from Top5 Customers, 2014-2016
Fulfillment of TankeBlue Semiconductor’s 10 Biggest Sales Contracts, 2016
TankeBlue Semiconductor’s Procurement from Top5 Suppliers, 2014-2016
TankeBlue Semiconductor’s R&D Expenditure, 2014-2016
TankeBlue Semiconductor’s 6-inch Conductive SiC Crystal
TankeBlue Semiconductor’s 2 to 4-inch Conductive SiC Wafers
TankeBlue Semiconductor’s X-inch Semi-insulating SiC Crystal
TankeBlue Semiconductor’s 2 to 4-inch Semi-insulating SiC Wafers
TankeBlue Semiconductor’s 2-inch SiC Wafer Standards
TankeBlue Semiconductor’s 3-inch SiC Wafer Standards
TankeBlue Semiconductor’s 4-inch SiC Wafer Standards
TankeBlue Semiconductor’s 6-inch SiC Wafer Standards
TankeBlue Semiconductor’s Test- level SiC Wafer Standards
Revenue and Net Income of TankeBlue Semiconductor, 2015-2020E
Development History of Weifang LiuheSiC Micro Powder
Shareholding Structure of Weifang LiuheSiC Micro Powder
Product Specifications, Applications, and Capacity of Weifang LiuheSiC Micro Powder
Development History of Lanzhou Heqiao Resource
Shareholding Structure of Lanzhou Heqiao Resource
Specifications of Lanzhou Heqiao Resource’s Black SiC Grit
Specifications of Lanzhou Heqiao Resource’s Black SiC Powder
Specifications of Lanzhou Heqiao Resource’s High-density Large-crystal Black Silicon Carbide
Lanzhou Heqiao Resource’s High-density Large-crystal Black Silicon Carbide
Specifications of Lanzhou Heqiao Resource’s Black SiC Sand
Specifications of Ningxia JinjingMetallurgicals& Minerals Industrial’s Black Silicon Carbide
Shareholding Structure of TonghuaHongxin Abrasive
Main Products of Jiangsu Leyuan New Materials Group
Key Performance Indicators of Large-crystal Black Silicon Carbide of HangjiangHongyuanXiangyang Silicon Carbide Special Ceramics
Specifications and Models of SiC Industrial Pumps of HangjiangHongyuanXiangyang Silicon Carbide Special Ceramics
Shareholding Structure of SICC Materials
Foreign Sales Network of SICC Materials
Domestic Sales Network of SICC Materials
Specifications of SICC Materials’ N-type 2-inch Substrate
Specifications of SICC Materials’ N-type 3-inch Substrate
Specifications of SICC Materials’ N-type 4-inch Substrate
Shareholding Structure of Dongguan Tianyu Semiconductor Technology
Parameters of Dongguan Tianyu Semiconductor Technology’s 6-inch SiC Epitaxial Wafer
Parameters of Dongguan Tianyu Semiconductor Technology’s 4-inch SiC Epitaxial Wafer
Global Power Technology (Beijing)’s SiCSchottky Diodes
Specifications of Global Power Technology (Beijing)’s G3 SiCSchottky Diodes
Shareholding Structure of Xinjiang Longhai Silicon Industry Development
如果这份报告不能满足您的要求,我们还可以为您定制报告,请 留言说明您的详细需求。
|