|
|
|
报告导航:研究报告—
TMT产业—电子半导体
|
|
2016-2020年全球及中国CMOS相机系统产业研究报告 |
 |
字数:3.5万 |
页数:188 |
图表数:200 |
|
中文电子版:9000元 |
中文纸版:4500元 |
中文(电子+纸)版:9500元 |
|
英文电子版:2600美元 |
英文纸版:2800美元 |
英文(电子+纸)版:2900美元 |
|
编号:ZYW231
|
发布日期:2017-02 |
附件:下载 |
 |
|
|
《2016-2020年全球及中国CMOS相机系统产业研究报告》包含以下内容:
1、CMOS图像传感器产业与市场分析,7个相关厂家研究。
2、CMOS相机镜头产业与市场分析,14个相关厂家研究。
3、CMOS相机模组产业与市场,24个相关厂家研究。
4、手机市场分析与手机相机发展方向。
2015年全球CCM(CMOS Camera Module)市场规模为16611百万美元,比2014年增长3.8%,是自2010年以来最低的增速,2016年因为CCM单价最高的苹果手机出货量下滑,导致全球市场则小幅度衰退,下滑0.5%,2017年受双摄像头驱动,大幅度反弹,增速为4.3%,市场规模为17232百万美元。预计到2020年市场规模为18512百万美元。
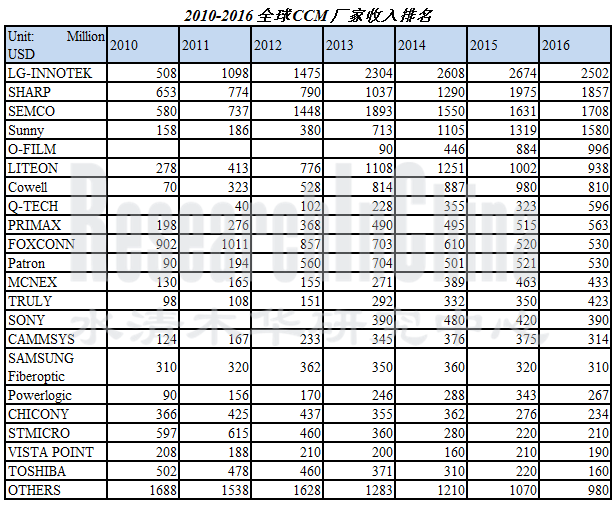
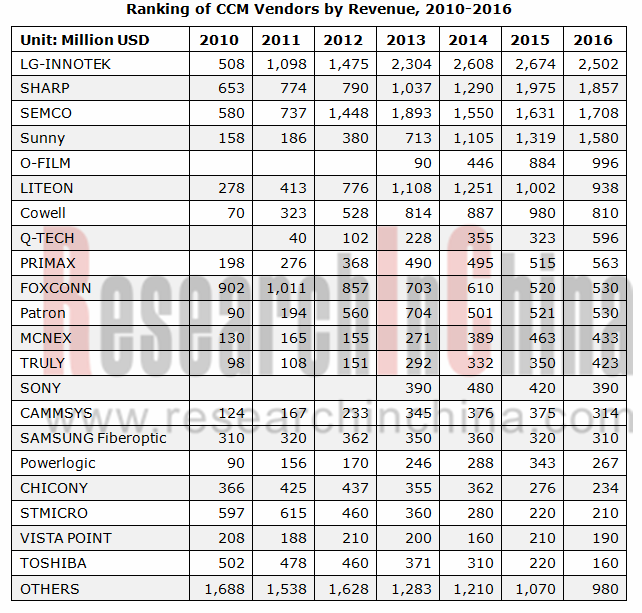
2016年中国厂家都取得了不错的成绩,韩国厂家由于过份依赖苹果和三星,收入都下滑或略微增长。中国厂家中以Q-Tech增速最高,达84.5%,主要由于其大客户OPPO和VIVO表现出色。其次是Truly,也是拜大客户OPPO和VIVO所赐。
预计未来同像素黑白双摄像头可能会成为苹果以外的主流,主要是成本略低,夜景有明显提升,消费者看得见的效果提升。而苹果则会坚持增加景深的双摄像头设计。智能手机高度同质化,即便消费者对双摄像头满意度不高,但在卖场竞争的情境下,双摄像头会比单摄像头更容易打动消费者,所以预计高端智能手机会把双摄像头作为标准配置。到2020年渗透率可达30-40%。
2016年CIS(CMOS Image Sensor)市场规模大约10516百万美元,比2015年增长5.6%,和2015年13.5%的增速相比大大降低了,主要原因是中高端产品被索尼一家垄断,中低端领域厂家无法突破索尼打造的技术门槛,只能展开价格战,即便是车载领域都是如此。而索尼虽然遭遇了地震、日元升值等因素干扰,但依靠压倒性的性能优势,在中高端领域的绝对垄断地位继续加强,收入继续大爆发,2016年收入大增32.9%,其余厂家除松下、Hynix外都出现了衰退。预计2017年CIS市场增长4.0%,索尼仍然有10%以上的增长,大部分厂家可能继续衰退。虽然手机市场都不被看好,但手机市场仍然是最重要的市场,索尼仍然垄断高端手机市场。
2016年大立光由于过份依赖苹果订单而出现了10年以来第一次收入下滑,但大立光的毛利率进一步上升,从2015年的57.4%提高到2016年的66.2%。显示出大立光的技术实力进一步提升。舜宇在中国市场进一步称霸,收入大增52%,毛利率从32.5%提高到38.2%(2016年上半年),仍然远低于大立光,有进一步提升的空间。大立光吸取过份依赖苹果的教训,积极拓展客户,对舜宇来说压力不小。舜宇的车载镜头虽然目前市场占有率高达33%,稳居全球第一,但未来不仅会受到来自大立光的挑战,也会受到来自韩国Sekonix的挑战。
Global and China CMOS Camera System Industry Report, 2016-2020 covers the following:
1. Analysis of CMOS Image Sensor (CIS) Industry and Market, with 7 vendors involved.
2. Analysis of CMOS Camera Lens Industry and Market, with 14 vendors involved.
3. Analysis of CMOS Camera Module (CCM) Industry and Market, with 24 vendors involved.
4. Analysis of Mobile Phone Market and Development Orientation of Mobile Phone Camera
In 2015, the global CCM (CMOS Camera Module) market size reported USD16.611 billion, up 3.8% from a year earlier but the lowest growth rate since 2010. In 2016, as the shipment of Apple phones with the highest single price of CCM fell, the world CCM market was at low ebb and down 0.5%. Due to the dual-camera stimulus in 2017, the global market rebounds substantially with the growth rate of 4.3% and the size estimated to be USD17.232 billion in 2017 and USD18.512 billion in 2020.
In 2016, Chinese manufacturers made remarkable achievements, while South Korean counterparts saw a drop or slight rise in revenue due to their heavy reliance on Apple and Samsung. Among Chinese players, Q-Tech enjoys the highest growth rate up to 84.5%, followed by Truly, both of which benefited from the outstanding performance of big customers OPPO and VIVO.
It is anticipated that monochrome dual-camera with same pixel will be the mainstream for smart phone brands except Apple in the future, as it is more affordable and can improve nightscape significantly (visible effect betterment for consumers), while Apple will persist in duel-camera design enriching depth of focus. Smart phones tend to be highly homogenized. Although they are still not quite satisfied with the dual-cameras, consumers are more impressed with dual-cameras than mono-camera. So, dual-camera is expected to be a standard configuration in high-end smart phones, and the penetration rate till 2020 would be as high up to 30-40%.
In 2016, the CIS (CMOS Image Sensor) market size approximated USD10.516 billion, rising by 5.6% from a year ago, but with an obvious fall in the speed of growth compared with the growth rate of 13.5% in 2015, mainly because medium- and high-end products are monopolized by Sony and the manufacturers in low- and medium-end fields are hard to break through the technological barriers and do nothing but hit the price war even in the vehicle field. Although influenced by factors like the Earthquake and the Appreciation of Japanese Yen, Sony still monopolized the medium- and high-end fields by dint of its overwhelming performance superiority and saw an upsurge of 32.9% in its revenue in 2016; by contrast, other players excluding Panasonic and Hynix saw decline. It is expected that, in 2017, the CIS market will grow 4.0%, Sony will see a growth rate of at least 10%, and most others will continue to suffer losses. In spite of being not much expected, the mobile phone market is still the most important market and Sony still monopolizes the high-end mobile phone market.
In 2016, Largan Precision’s revenue dropped for the first time over the ten years due to its excessive dependence on Apple’s orders, but Largan saw its gross margin further rise from 57.4% in 2015 to 66.2%, showing the strengthened technical competence. Sunny consolidated its hegemony in Chinese market with its revenue surging 52% and gross margin rising from 32.5% to 38.2% (in the first half of 2016), still far behind Largan’s but space left for improvement. Largan earnestly draws lessons from heavy reliance on Apple and actively develop new customers, which poses great pressure on Sunny. Currently holding a 33% market share and ranking first in the vehicle camera field worldwide, Sunny is probable to be challenged by Largan and S.Korean Sekonix in the future.
第一章、CMOS相机模组产业
1.1、CMOS相机模组产业链
1.2、CMOS图像传感器行业
1.3、CIS图像传感器市场
1.4、CMOS IMAGE SENSOR厂家市场占有率
1.5、中国CIS市场
1.6、光学镜头行业
1.7、CMOS相机模组行业
1.8、CMOS相机模组与品牌厂家供应关系
1.9、AFA(VCM)简介
1.10、AFA(VCM)行业格局
1.11、中国VCM产业研究
1.12、OIS简介
1.13、手机OIS市场
1.14、汽车摄像模组Automotive Camera 市场
1.15、主要汽车摄像模组厂家市场占有率
第二章、CMOS相机模组市场
2.1、全球手机市场
2.2、全球智能手机市场
2.3、中国手机市场
2.4、手机摄像发展趋势
2.4.1、提升对焦(Focusing)速度
2.4.2、提升暗光拍摄效果
2.4.3、4K
2.4.4、旋转、阵列
2.4.5、曲面CMOS Sensor
2.5、双摄像头手机
2.5.1同像素平行双摄像头
2.5.2不同像素立体摄像头
2.5.3同像素黑白双摄像头
2.5.4三维扫描双摄像头
第三章、CMOS图像传感器厂家研究
3.1、三星电子
3.2、Omnivision
3.3、APTINA(ON-SEMI)
3.4、索尼
3.5、东芝
3.6、格科微电子
3.7、思比科微电子
第四章、光学镜头厂家研究
4.1、大立光电
4.2、玉晶光电
4.3、亚洲光学
4.4、新钜科技
4.5、先进光电
4.6、KANTATSU
4.7、日立万胜
4.8、DIOSTECH
4.9、SEKONIX
4.10、高丽光学
4.11、FUJINON
4.12、光耀光电GLORY
4.13、KMOT
4.14、Digital Optics
第五章、相机模组厂家研究
5.1、群光
5.2、Vista Point Technologies
5.3、鸿海
5.4、LG INNOTEK
5.5、三美电机
5.6、信利国际
5.7、比亚迪光电
5.8、光宝科技LITEON
5.9、致伸科技
5.10、SEMCO
5.11、Partron
5.12、Sunny Optical
5.13、CAMMSYS
5.14、Powerlogics
5.15、MCNEX
5.16、Cowell
5.17、欧菲光
5.18、昆山丘钛微电子Q-TECH
5.19、Globaloptics
5.20、深圳盛泰光电Shine Tech
5.21、夏普
5.22、STMicroelectronics
5.23、其他
5.23.1、深圳市金康光电KingCome
5.23.2、广州大凌实业Darling
第六章、AFA(VCM)厂家研究
6.1、HYSONIC
6.2、韩国磁化电子JAHWA
1 CMOS Camera Module Industry
1.1 CMOS Camera Module Industry Chain
1.2 CMOS Image Sensor Industry
1.3 CIS Market
1.4 Market Share of CIS Vendors
1.5 China CIS Market
1.6 Optical Lens Industry
1.7 CMOS Camera Module Industry
1.8 Supply Relationship between CMOS Camera Module and Brand Vendors
1.9 Introduction to AFA (VCM)
1.10 AFA (VCM) Industry Pattern
1.11 China VCM Industry
1.12 Introduction to OIS
1.13 Mobile Phone OIS Market
1.14 Automotive Camera Module Market
1.15 Market Share of Major Automotive Camera Module Vendors
2 CMOS Camera Module Market
2.1 Global Mobile Phone Market
2.2 Global Smart Phone Market
2.3 China Mobile Phone Market
2.4 Trends of Mobile Phone Camera
2.4.1 Improving Focusing Speed
2.4.2 Improving Dim Light Shooting Effect
2.4.3 4K
2.4.4 Rotation, Array
2.4.5 Curved CMOS Sensor
2.5 Dual Camera Phone
2.5.1 Parallel Dual Camera with Same Pixels
2.5.2 Stereo Camera with Different Pixels
2.5.3 Monochrome Dual Camera with Same Pixels
2.5.4 3D Scanner Dual Camera
3 CMOS Image Sensor Vendors
3.1 Samsung Electronics
3.2 OmniVision
3.3 Aptina (ON-Semi)
3.4 Sony
3.5 Toshiba
3.6 Galaxycore Microelectronics
3.7 SuperPix Micro Technology
4 Optical Lens Vendors
4.1 Largan Precision
4.2 GeniuS Electronic Optical (GSEO)
4.3 Asia Optical
4.4 Newmax Technology
4.5 Ability Opto-Electronics Technology
4.6 Kantatsu
4.7 Hitachi Maxell
4.8 Diostech
4.9 Sekonix
4.10 Korea Optical
4.11 Fujinon
4.12 Glory
4.13 KMOT
4.14 Digital Optics
5 Camera Module Vendors
5.1 Chicony
5.2 Vista Point Technologies
5.3 Hon Hai
5.4 LG Innotek
5.5 Mitsumi Electric
5.6 Truly International
5.7 BYD Optical
5.8 Lite-On Technology
5.9 Primax
5.10 SEMCO
5.11 Partron
5.12 Sunny Optical
5.13 CammSys
5.14 PowerLogics
5.15 MCNEX
5.16 Cowell
5.17 O-Film
5.18 Q-Tech
5.19 Global Optics
5.20 Shinetech
5.21 Sharp
5.22 STMicroelectronics
5.23 Others
5.23.1 Shenzhen KingCome Optoelectronics
5.23.2 Guangzhou Darling Industrial
6 AFA (VCM) Vendors
6.1 Hysonic
6.2 Jahwa Electronics
CMOS相机模组产业链
2009-2015年8MP CCM成本结构
2012-2015年13MP CCM成本结构
IMAGE SENSOR厂家供应链
2011-2020年CIS(CMOS IMAGE SENSOR)市场规模
2014-2017年CIS(CMOS IMAGE SENSOR)市场规模下游分布
2013-2016年GLOBAL CIS VENDOR MARKET SHARE BY REVENUE
2012年全球主要CMOS IMAGE SENSOR厂家市场占有率
2012年全球主要CMOS IMAGE SENSOR厂家市场占有率(量)
2012年PC领域全球主要CMOS IMAGE SENSOR厂家市场占有率(量)
2010-2018 GLOBAL AND CHINA CIS MARKET VOLUME FOR MOBILE PHONE
2010-2018 GLOBAL AND CHINA CIS MARKET BY PIXEL COUNT
2010-2013 CHINA CIS VENDOR MARKET SHARE BY VOLUME
2010-2013 CHINA CIS VENDOR MARKET SHARE BY REVENUE
2016年全球CMOS相机模组镜头主要厂家出货量市场占有率
2011-2016年全球主要CMOS相机光学镜头厂家收入排名
2010-2020年全球CMOS相机模组市场规模
2010-2016全球CCM厂家收入排名
2014年10月中国十大CCM厂家出货量
2016年三星相机模组供应商分布
2016年苹果相机模组供应商分布
2016年ZTE相机模组供应商分布
2016年华为相机模组供应商分布
2013-2014年联想相机模组供应商分布
2016年小米相机模组供应商分布
2016年OPPO相机模组供应商分布
2016年VIVO相机模组供应商分布
VCM直观图
VCM剖面图
VCM结构
2016年全球VCM主要厂家市场占有率(出货量)
AFA与相机模组厂家之间供应关系
2015年全球主要AFA厂家市场占有率
2015年最具竞争力的国产VCM马达10强
OIS结构图
OIS原理图
2012-2017年采用OIS的手机出货量
2015年OIS主要厂家市场占有率
2009-2020年全球AUTOMOTIVE CAMERA MODULE 出货量
2010年主要汽车摄像模组厂家市场占有率
2011年主要汽车摄像模组厂家市场占有率
2012年主要汽车摄像模组厂家市场占有率
2016年全球汽车CCM主要厂家市场占有率
2016年全球汽车VISION SYSTEM主要厂家市场占有率
2016年全球汽车LENS主要厂家市场占有率
2007-2020年全球手机出货量
2015年4季度-2016年4季度全球主要智能手机厂家市场占有率
2016年全球智能手机厂家市场占有率
2014年中国智能手机市场主要厂家市场占有率
2016年中国智能手机市场主要厂家市场占有率
2016年中国智能手机出货量市场占有率
2016 年主流双摄机型及供货模组厂商
三星 8MP以上 CMOS IMAGE SENSOR产品一览
FY2009-FY2016 OMNIVISION收入与毛利率
FY2009-FY2016 OMNIVISION收入与运营利润率
FY2009-FY2015 OMNIVISION出货量
FY2009-FY2015 OMNIVISION收入地域分布
FY2009-FY2015 OMNIVISION资产地域分布
FY2011-FY2014 OMNIVISION收入下游应用分布
FY2013-FY2014 OMNIVISION收入RESOLUTION分布
2014 OVT各领域市场占有率
OMNINVISION 供应链
2014年3季度-2016年4季度 ON SEMICONDUCTOR QUARTERLY SALES AND GROSS MARGIN
3Q14-3Q16 ON SEMICONDUCTOR IMAGE SENSOR GROUP QUARTERLY REVENUES
索尼半导体事业部组织结构
索尼图像传感器产能扩展计划
IMAGE SENSOR应用分布
2011-2014年GALAXYCORE收入与毛利率
2011-2014年GALAXYCORE收入产品分布
2011-2014年GALAXYCORE收入像素分布BY PIXEL
2011-2014年GALAXYCORE产品出货量
2011-2014年GALAXYCORE资产、负债与现金流
2006-2017年大立光收入与毛利率
2006-2017年大立光收入与运营利润率
2014年12月-2016年12月大立光月度收入
2014-2016年大立光出货量像素分布
2011-2014年大立光电出货量
大立光电大陆子公司2015年财务数据
大立光电大陆子公司2014年财务数据
大立光电大陆子公司2012年财务数据
大立光电大陆子公司2013年财务数据
2005-2016年玉晶光电收入与毛利率
2005-2016年玉晶光电收入与运营利润率
2014年12月-2016年12月玉晶光月度收入
2007-2016年亚光收入与毛利率
2007-2016年亚光收入与运营利润率
2014年12月-2016年12月亚洲光学月度收入
2007-2016年新钜科技收入与毛利率
2014年12月-2016年12月新钜科技月度收入
2006-2016年先进光电收入与毛利率
2014年12月-2016年12月先进光电每月收入
KANTATSU手机相机模组产品一览
2013年DIOSTECH收入业务分布
2013年DIOSTECH产能、产量、产能利用率
DIOSTECH组织结构
DIOSTECH生产线
DIOSTECH客户
2012年DIOSTECH收入像素分布
2005-2016年SEKONIX收入与运营利润率
2009-2016年SEKONIX收入产品分布
2012-2014年SEKONIX HANDSET LENS业务收入像素分布
2007-2016年高丽光学收入与运营利润率
高丽光学路线图
2006-2016年光耀科技收入与运营利润率
2014年12月-2016年12月光耀科技每月收入
KMOT主要业务
2011-2012财年 KMOT OPTICAL UNITS FOR CELL PHONES 收入
2007-2016年DIGITAL OPTICS收入与运营利润率
2011-2014年DIGITAL OPTICS原材料成本分布
2005-2016年群光收入与毛利率
2014年12月-2016年12月群光月度收入
2011年群光主要大陆子公司财务数据
2012年群光主要大陆子公司财务数据
鸿海光学领域主要子公司2013年财务数据
鸿海光学领域主要子公司2014年财务数据
鸿海光学领域主要子公司2015年财务数据
2006-2017年LG INNOTEK收入与运营利润率
2008-2018 LG INNOTEK NET PROFIT
2013-2017年LG INNOTEK 收入业务分布
2011-2015年LG INNOTEK 运营利润业务分布
2014年1季度-2016年4季度LG INNOTEK OPTICAL季度收入与营业利润率
2014年1季度-2016年4季度LG INNOTEK AUTOMOTIVE&ELECTRONICS季度收入与营业利润率
2014年1季度-2016年4季度LG INNOTEK CCM像素分布
2006-2016财年三美电机收入与运营利润率
2006-2016财年三美电机收入产品分布
HOLDING STRUCTURE OF TRULY INTERNATIONAL'S SUBSIDIARIES
2005-2016年信利国际收入与运营利润率
2014-2018年信利收入BY SEGMENT
2014- 2018 SALES AND ASP OF TRULY'S AUTOMOTIVE PRODUCTS
信利手机LCD主要客户
信利汽车显示器主要客户
信利触摸屏产能
信利CCM主要客户
光宝集团
光宝广州科技园
光宝CCM技术路线图
2005-2015年光宝收入与运营利润率
致伸科技KEY MILESTONE
2008-2016年致伸科技收入与营业利润率
2007-2015年致伸科技收入部门分布
2014年12月-2016年12月致伸科技每月收入
致伸全球分布
致伸科技产品范围
2011-2016年SEMCO收入与营业利润
2014-2017年SEMCO收入部门分布
2015-2017年SEMCO运营利润部门分布
2013年1季度-2016年4季度SEMCO CCM业务收入
2007-2017年PARTRON收入与运营利润率
2013-2016年PARTRON收入客户分布
2004-2016年舜宇收入与毛利率
2014-2016舜宇收入BY SEGMENT
2009-2015年财务概要 FINANCIAL SUMMARY
舜宇主要客户
2013-2016舜宇各项产品出货量
2014-2018舜宇汽车LENS出货量与ASP
2010-2016年舜宇收入部门分布
2010-2016年舜宇各部门毛利率
舜宇工厂分布
CAMMSYS组织结构图
2009-2017年CAMMSYS收入与营业利润率
2011-2014年CAMMSYS原材料价格
2009-2016年POWERLOGIC收入与营业利润
2012-2014年POWERLOGIC CCM ASP
2012-2014年POWERLOGIC CCM COMPONENT ASP
2012-2014年POWERLOGIC CCM产能
2012-2014年POWERLOGIC CCM产量
2009-2016年MCNEX收入与营业利润
2013年MCNEX收入客户分布
2010-2016年MCNEX收入应用分布
MCNEX 手机领域主要产品
MCNEX 产能地域分布
东莞高伟2011-2017年收入与毛利率
2011-2016 COWELL REVENUE BREAKDOWN BY SEGMENT
2011-2015 COWELL SHIPMENTS VS ASP
2014年10月31日COWELL 产能
2013-2014 COWELL成本结构
2007-2017年欧菲光收入与运营利润率
2009-2017年欧菲光收入产品分布
2012-2014年欧菲光客户结构
2011-2017年Q-TECH收入与毛利率
2013-2017年Q-TECH CCM出货量
2015年1季度-2016年4季度 Q-TECH 季度出货量
2015-2018年Q-TECH CCM ASP
2015-2016 Q-TECH CCM ASP BY PIXELS
2015年Q-TECH客户分布
FY2009-FY2015年GAI收入与营业利润
FY2008-FY2017 SHARP 收入与营业利润率
2015年2季度-2016年4季度夏普CCM业务季度收入与营业利润率
夏普OIS路线图
FY2014 STMICRO REVENUE BY PRODUCT
3Q/2015 STMICRO REVENUE BY PRODUCT
HYSONIC结构
2006-2016年HYSONIC收入与运营利润
2014年3月底PERSONNEL ORGANIZATION OF HYSONIC
HYSONIC 主要产品
2012-2013年HYSONIC收入最终客户分布
2012-2013年HYSONIC收入客户分布
2005-2017年JAHWA收入与运营利润率
1Q13-4Q15 JAHWA季度收入产品分布
磁化电子海外子公司一览
CMOS Camera Module Industry Chain
8MP CCM Cost Structure, 2009-2015
13MP CCM Cost Structure, 2012-2015
Supply Chain of Image Sensor Vendors
CIS Market Size, 2011-2020E
CIS Market Size by Application, 2014-2017
Market Share of Global CIS Vendors by Revenue, 2013-2016
Market Share of Major Global CIS Vendors (by Revenue), 2012
Market Share of Major Global CIS Vendors (by Shipment), 2012
Market Share of Major Global CIS Vendors in PC Field, 2012
Global and China CIS Market Volume for Mobile Phone, 2010-2018E
Global and China CIS Market by Pixel Count, 2010-2018E
Market Share of Chinese CIS Vendors by Volume, 2010-2013
Market Share of Chinese CIS Vendors by Revenue, 2010-2013
Market Share of Major Global CCM Vendors by Shipment, 2016
Global CMOS Optical Camera Lens Vendor Rankings by Revenue, 2011-2016
Global CCM Market Size, 2010-2020E
Global CCM Vendor Rankings by Revenue, 2010-2016
Top 10 CCM Vendors by Revenue in China, Oct. 2014
Distribution of Samsung’s Camera Module Suppliers, 2016
Distribution of Apple’s Camera Module Suppliers, 2016
Distribution of ZTE’s Camera Module Suppliers, 2016
Distribution of Huawei’s Camera Module Suppliers, 2016
Distribution of Lenovo’s Camera Module Suppliers, 2013-2014
Distribution of Xiaomi’s Camera Module Suppliers, 2016
Distribution of OPPO’s Camera Module Suppliers, 2016
Distribution of VIVO’s Camera Module Suppliers, 2016
VCM Visual View
VCM Sectional View
VCM Structure
Market Share of Major Global VCM Vendors (by Shipment) , 2016
Supply Relationship between AFA and Camera Module Vendors
Market Share of Major Global AFA Vendors, 2015
Top 10 Most Competitive China-made VCM Motors, 2015
OIS Structural Diagram
OIS Schematic Diagram
Shipment of Mobile Phones with OIS, 2012-2017E
Market Share of Major OIS Vendors, 2015
Global Automotive Camera Module Shipment, 2009-2020E
Market Share of Major Automotive Camera Module Vendors, 2010
Market Share of Major Automotive Camera Module Vendors, 2011
Market Share of Major Automotive Camera Module Vendors, 2012
Market Share of Major Global Automotive CCM Vendors, 2016
Market Share of Major Global Automotive Vision System Vendors, 2016
Market Share of Major Global Automotive Lens Vendors, 2016
Global Mobile Phone Shipment, 2007-2020E
Market Share of Major Global Smartphone Vendors, 2015Q4-2016Q4
Market Share of Global Smartphone Vendors, 2016
Market Share of Major Smartphone Vendors in China, 2014
Market Share of Major Smartphone Vendors in China, 2016
Market Share of Major Smartphone Vendors in China by Shipment, 2016
Mainstream Dual-Camera Phones and Supply Module Vendors, 2016
Samsung 8MP- above CMOS Image Sensor Products List
OmniVision’s Revenue and Gross Margin, FY2009-FY2016
OmniVision’s Revenue and Operating Margin, FY2009-FY2016
OmniVision’s Shipment, FY2009-FY2015
OmniVision’s Revenue by Region, FY2009-FY2015
OmniVision’s Assets by Region, FY2009-FY2015
OmniVision’s Revenue by Application, FY2011-FY2014
OmniVision’s Revenue by Resolution, FY2013-FY2014
OmniVision’s Market Share by Field, 2014
OmniVision’s Supply Chain
ON Semiconductor’s Quarterly Sales and Gross Margin, 2014Q3-2016Q4
ON Semiconductor Image Sensor Group’s Quarterly Revenue, 2014Q3-2016Q3
Sony Semiconductor Solutions’ Organizational Structure
Sony’s Image Sensor Capacity Expansion Plan
Image Sensor Applications
Revenue and Gross Margin of Galaxycore, 2011-2014
Revenue Breakdown of Galaxycore by Product, 2011-2014
Revenue Breakdown of Galaxycore by Pixel, 2011-2014
Galaxycore’s Product Shipment, 2011-2014
Galaxycore’s Assets, Liabilities and Cash Flow, 2011-2014
Largan Precision’s Revenue and Gross Margin, 2006-2017
Largan Precision’s Revenue and Operating Margin, 2006-2017
Largan Precision’s Monthly Revenue, Dec. 2014-Dec. 2016
Largan Precision’s Shipment by Pixel, 2014-2016
Largan Precision’s Shipment, 2011-2014
Financial Data of Largan Precision’s Subsidiaries in Mainland China, 2015
Financial Data of Largan Precision’s Subsidiaries in Mainland China, 2014
Financial Data of Largan Precision’s Subsidiaries in Mainland China, 2012
Financial Data of Largan Precision’s Subsidiaries in Mainland China, 2013
GSEO’s Revenue and Gross Margin, 2005-2016
GSEO’s Revenue and Operating Margin, 2005-2016
GSEO’s Monthly Revenue, Dec. 2014-Dec. 2016
Asia Optical’s Revenue and Gross Margin, 2007-2016
Asia Optical’s Revenue and Operating Margin, 2007-2016
Asia Optical’s Monthly Revenue, Dec. 2014-Dec. 2016
Newmax Technology’s Revenue and Gross Margin, 2007-2016
Newmax Technology’s Monthly Revenue, Dec. 2014-Dec. 2016
Ability Opto-Electronics Technology’s Revenue and Gross Margin, 2006-2016
Ability Opto-Electronics Technology’s Monthly Revenue, Dec. 2014-Dec. 2016
Kantatsu Mobile Phone Camera Module Products List
Diostech’s Revenue by Business, 2013
Diostech’s Capacity, Output and Capacity Utilization, 2013
Diostech’s Organizational Structure
Diostech’s Production Line
Diostech’s Customers
Diostech’s Revenue by Pixel, 2012
Sekonix’s Revenue and Operating Margin, 2005-2016
Sekonix’s Revenue by Product, 2009-2016
Sekonix’s Handset Lens Revenue by Pixel, 2012-2014
Korea Optical’s Revenue and Operating Margin, 2007-2016
Korea Optical’s Roadmap
Optivision Technology’s Revenue and Operating Margin, 2006-2016
Optivision Technology’s Monthly Revenue, Dec. 2014-Dec. 2016
KMOT’s Main Businesses
Revenue of KMOT’s Optical Units for Cell Phones, FY2011-FY2012
Digital Optics’ Revenue and Operating Margin, 2007-2016
Distribution of Digital Optics’ Raw Material Costs, 2011-2014
Chicony’s Revenue and Gross Margin, 2005-2016
Chicony’s Monthly Revenue, Dec. 2014-Dec. 2016
Financial Data of Chicony’s Major Subsidiaries in Mainland China, 2011
Financial Data of Chicony’s Major Subsidiaries in Mainland China, 2012
Financial Data of Hon Hai’s Major Subsidiaries in Optical Field, 2013
Financial Data of Hon Hai’s Major Subsidiaries in Optical Field, 2014
Financial Data of Hon Hai’s Major Subsidiaries in Optical Field, 2015
LG Innotek’s Revenue and Operating Margin, 2006-2017
LG Innotek’s Net Profit, 2008-2018E
LG Innotek’s Revenue by Business, 2013-2017
LG Innotek’s Operating Income by Business, 2011-2015
LG Innotek’s Optical Revenue and Operating Margin by Quarter, 2014Q1-2016Q4
LG Innotek’s Automotive & Electronics Revenue and Operating Margin by Quarter, 2014Q1-2016Q4
LG Innotek’sCCM Distribution by Piexel, 2014Q1-2016Q4
Mitsumi Electric’s Revenue and Operating Margin, FY2006-FY2016
Mitsumi Electric’s Revenue by Product, FY2006-FY2016
Holding Structure of Truly International’s Subsidiaries
Truly International’s Revenue and Operating Margin, 2005-2016
Truly International’s Revenue by Segment, 2014-2018
Sales and ASP of Truly International’s Automotive Products, 2014-2018
Truly International’s Mobile Phone LCD Customers
Truly International’s Car Display Customers
Truly International’s Touch Screen Capacity
Truly International’s CCM Customers
Lite-On Technology Corporation
Lite-on Science Park, Guangzhou
Lite-on’s CCM Technology Roadmap
Lite-on’s Revenue and Operating Margin, 2005-2015
Primax’s Key Milestones
Primax’s Revenue and Operating Margin, 2008-2016
Primax’s Revenue by Division, 2007-2015
Primax’s Monthly Revenue, Dec. 2014-Dec. 2016
Primax’s Global Distribution
Primax’s Product Scope
Revenue and Operating Income of SEMCO, 2011-2017
Revenue of SEMCO by Division, 2014-2017
Operating Income of SEMCO by Dision, 2015-2017
Quarterly CCM Business Revenue of SEMCO, 2013Q1-2016Q4
Revenue and Operating Margin of Partron, 2007-2017
Revenue of Partron by Customer, 2013-2016
Revenue and Gross Margin of Sunny Optical, 2004-2016
Revenue of Sunny Optical by Segment, 2014-2016
Financial Summary of Sunny Optical, 2009-2015
Key Customers of Sunny Optical
Shipments of Sunny Optical by Product, 2013-2016
Automotive Lens Shipment and ASP of Sunny Optical, 2014-2018E
Revenue of Sunny Optical by Division, 2010-2016
Gross Margin of Sunny Optical by Division, 2010-2016
Distribution of Sunny Optical’s Plants
Organization Structure of CammSys
Revenue and Operating Margin of CammSys, 2009-2017
Raw Material Prices of CammSys, 2011-2014
Revenue and Operating Income of PowerLogic, 2009-2016
CCM ASP of PowerLogic, 2012-2014
CCM Component ASP of PowerLogic, 2012-2014
Production Capacity of PowerLogic CCM, 2012-2014
CCM Output of PowerLogic, 2012-2014
Revenue and Operating Income of MCNEX, 2009-2016
Revenue of MCNEX by Customer, 2013
Revenue of MCNEX by Application, 2010-2017
Major Products of MCNEX in Mobile Phone Field
Production Capacity of MCNEX by Region
Revenue and Gross Margin of Cowell, 2011-2017
Revenue of Cowell by Segment, 2011-2016
Shipments VS ASP of Cowell, 2011-2015
Production Capacity of Cowell, Oct 31, 2014
Cost Structure of Cowell, 2013-2014
Revenue and Operating Margin of O-Film, 2007-2017
Revenue of O-Film by Product, 2009-2017
Client Structure of O-Film, 2012-2014
Revenue and Gross Margin of Q-TECH, 2011-2017
CCM Shipment of Q-TECH, 2013-2017E
Quarterly Shipment of Q-TECH, 2015Q1-2016Q4
CCM ASP of Q-TECH, 2015-2018E
CCM ASP of Q-TECH by Pixels, 2015-2016
Client Structure of Q-TECH, 2015
Revenue and Operating Income of GAI, FY2009-FY2015
Revenue and Operating Margin of Sharp, FY2008-FY2017
CCM Business Revenue and Operating Margin of Sharp, 2015Q2-2016Q4
OIS Roadmap of Sharp
Revenue of STMicro by Product, FY2014
Revenue of STMicro by Product, 3Q/2015
Structure of Hysonic
Revenue and Operating Income of Hysonic, 2006-2016
Personnel Organization of Hysonic, end-March 2014
Major Products of Hysonic
Revenue of Hysonic by Ultimate Client, 2012-2013
Revenue of Hysonic by Customer, 2012-2013
Revenue and Operating Margin of Jahwa, 2005-2017
Quarterly Revenue of Jahwa by Product, 2013Q1-2015Q4
Overseas Subsidiaries of Jahwa
如果这份报告不能满足您的要求,我们还可以为您定制报告,请 留言说明您的详细需求。
|