|
|
|
报告导航:研究报告—
制造业—能源矿产
|
|
2017-2021年全球及中国风电运维行业研究报告 |
 |
字数:2.3万 |
页数:126 |
图表数:166 |
|
中文电子版:9000元 |
中文纸版:4500元 |
中文(电子+纸)版:9500元 |
|
英文电子版:2200美元 |
英文纸版:2400美元 |
英文(电子+纸)版:2500美元 |
|
编号:CYH059
|
发布日期:2017-02 |
附件:下载 |
 |
|
|
随着风电装机容量逐渐增长以及大批风电机组质保期临近,风电运维逐渐成为行业焦点。2016年,全球风电运维市场规模约107.5亿美元,同比增长12%,预计2021年其规模将攀升至186.12亿美元。
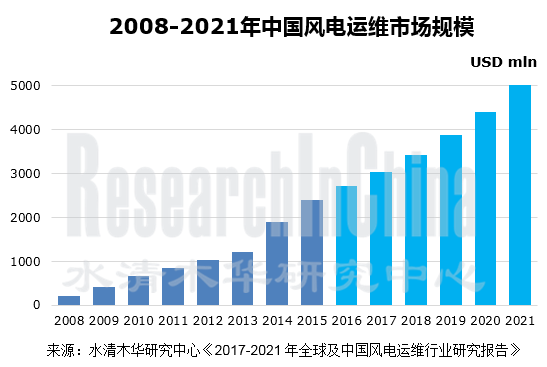
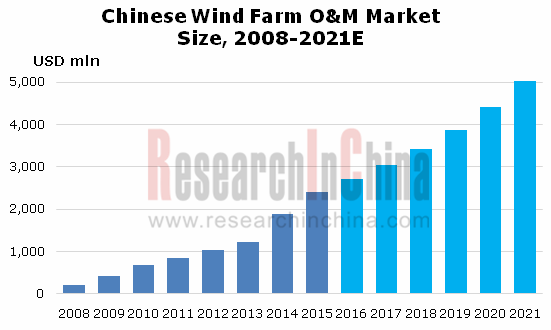
中国是全球最大的全球风电运维市场,2016年市场规模约27.16亿美元,占全球市场25.3%;随着中国出质保的风机加速增长,2017-2021年中国风电运维市场规模有望保持年均13%的速度增长,至2021年其值将达50.21亿美元。
当前,中国的风电运维市场仍以定期维修和事后维修为主,合计占比45%左右,随着新技术及产品不断投入,状态检修将是未来风电运维主要发展趋势。
企业方面,中国风电运维市场参与主体主要有风机制造商、风电开发商和第三方运维公司三种类型。其中风电开发商占比最高,2016年约74%,代表企业有协合新能源、国电龙源电力等;其次为风机制造商,占比15%,代表企业有金风科技、明阳风电、联合动力以及华锐风电等;而第三方运维公司规模尚小,约11%,代表企业有优利康达、汉能华、科雷斯普等。
另外,受互联网、大数据以及智能制造等政策的推动下,近两年,各大企业已开始布局智慧运维系统,其中金风科技公司2016年推出一体化、数字化智慧风场运维管理模式,实现为全球多个风场提供运维服务的功能;联合动力已在北京建成基于云平台的远程数据监控中心等。共享、智能以及集中将是未来风电运维主要发展方向。
水清木华研究中心《2017-2021年全球及中国风电运维行业研究报告》着重研究了以下内容:
 全球风电装机容量与分布、中国风电装机、地区结构、海上风电发展及企业格局等; 全球风电装机容量与分布、中国风电装机、地区结构、海上风电发展及企业格局等;
全球风电运维市场规模、地区分布及欧洲风电运维市场发展情况;
中国风电运维市场规模、成本分析及竞争格局及发展趋势等;
全球及中国18家风电运维企业经营情况及发展战略等。
As the wind power installed capacity grows and the warranty period of a large number of wind turbines is coming to an end, wind farm O & M has become the focus of the industry. In 2016, the global wind farm O & M market size jumped 12% year on year to about USD10.75 billion; in 2021, the size will rise to USD18.612 billion.
China is the world's largest wind farm O & M market, with the market size of about USD2.716 billion and making up 25.3% of the global total in 2016. Given a rising number of wind turbines whose warranty period expires, China’s wind farm O & M market size is anticipated to keep an AAGR of 13% during 2017-2021 and hit USD5.021 billion by 2021.
Source: Global and China Wind Farm O&M Industry Report, 2017-2021 byResearchInChina
At present, Chinese wind farm O & M market still centers on regular maintenance and breakdown maintenance, which share more than 45% together. With the continuous introduction of new technologies and products, state maintenance will be the main development trend of the future wind farm O & M.
Currently, players in the Chinese wind farm O&M market can be mainly divided into three types: wind turbine manufacturers, wind farm developers and third-party O&M companies. In 2016, wind farm developers represented by Concord New Energy and Longyuan Power enjoyed the lion’s share --74%, followed by wind turbine manufacturers such as Goldwind, Ming Yang Wind Power, United Power and SinovelWind Group with 15% and third-party O&M companies (still a small scale) including EULIKIND, Han Energy Technology and CLCP with 11%.
Additionally, under the impetus of the Internet, big data, intelligent manufacturing and other policies, the major companies have begun to deploy wisdom O & M systems in the past two years. Goldwind launched the integrated digital wisdom wind farm O & M management model in 2016 to serve a number of wind farms around the world with operational services. United Power has built a remote data monitoring center based on the cloud platform in Beijing. Sharing, intelligence and concentration will be the main direction of the future wind farm O & M.
Global and China Wind Farm O&M Industry Report, 2017-2021 by ResearchInChina focuses on the following:
 Global wind power installed capacity and distribution; China's wind power installed capacity, regional structure, offshore wind power development and corporate structure; Global wind power installed capacity and distribution; China's wind power installed capacity, regional structure, offshore wind power development and corporate structure;
Global wind farm O & M market size and geographical distribution; development of European wind farm O & M market;
Chinese wind farm O & M market size, cost analysis and competitive landscape and development trends;
Operation and development strategies of 18 major global and Chinese wind farm O & M companies.
第一章 风电运维简介
1.1 定义
1.2 分类
第二章 全球及中国风电市场分析
2.1 全球风电市场
2.1.1 风电装机及分布
2.1.2 德国
2.1.3 西班牙
2.1.4 美国
2.1.5 印度
2.2 中国风电市场
2.2.1 概况
2.2.2 风电装机与并网
2.2.3 海上风电
2.2.4 上网电价
2.2.5 风电整机制造商企业格局
2.2.6 风电开发商企业格局
第三章 全球风电运维市场分析
3.1 市场规模
3.2 地区结构
3.3 成本分析
3.4 欧洲市场
3.4.1 市场规模
3.4.2 竞争格局
3.5 企业格局
第四章 中国风电运维市场分析
4.1 发展概况
4.2 市场规模
4.3 成本分析
4.4 竞争格局
4.5 海上风电运维
4.6 发展趋势
4.6.1 市场趋势
4.6.2 智慧运维发展
第五章 全球及中国主要风电运维企业
5.1 Vestas
5.1.1 企业简介
5.1.2 经营情况
5.1.3 风电运维业务
5.1.4 在华业务
5.2 Gamesa
5.2.1 企业简介
5.2.2 经营情况
5.2.3 风电运维业务
5.2.4 在华业务
5.3 Suzlon
5.3.1 企业简介
5.3.2 经营情况
5.3.3 风电运维业务
5.3.4 在华业务
5.4 GE
5.4.1 企业简介
5.4.2 经营情况
5.4.3 在华业务
5.4.4 风电运维业务
5.5 Siemens
5.5.1 企业简介
5.5.2 经营情况
5.5.3 在华业务
5.5.4 风电运维业务
5.6 龙源电力
5.6.1 企业简介
6.1.2 经营情况
6.1.3 风电运维业务
5.7 金风科技
5.7.1 企业简介
5.7.2 经营情况
5.7.3 风电运维业务
5.8 明阳风电
5.8.1 企业简介
5.8.2 经营情况
5.8.3 风电运维业务
5.9 优利康达
5.9.1 企业简介
5.9.2 经营情况
5.9.3 风电运维业务
5.10 协合新能源
5.10.1 企业简介
5.10.2 经营情况
5.10.3 风电运维业务
5.11 联合动力
5.11.1 企业简介
5.11.2 经营情况
5.11.3 风电运维业务
5.12 科雷斯普
5.12.1 企业简介
5.12.2 经营情况
5.13 华锐风电
5.13.1 企业简介
5.13.2 经营情况
5.13.3 风电运维业务
5.14 汉能华
5.14.1 企业简介
5.14.2 经营情况
5.15 吉地安
5.15.1 企业简介
5.15.2 风电运维业务
5.16 锋电能源
5.16.1 企业简介
5.16.2 风电运维业务
5.17 东润环能
5.17.1 企业简介
5.17.2 经营情况
5.17.3 风电运维业务
5.18 EUM风电技术服务(北京)有限公司
1 Overview of Wind Farm O&M
1.1 Definition
1.2 Classification
2 Global and Chinese Wind Power Market
2.1 Global Wind Power Market
2.1.1 Wind Power Installed Capacity and Distribution
2.1.2 Germany
2.1.3 Spain
2.1.4 USA
2.1.5 India
2.2 Chinese Wind Power Market
2.2.1 Overview
2.2.2 Installed Capacity and Grid Connection
2.2.3 Offshore Wind Power
2.2.4 Feed-In Tariff
2.2.5 Pattern of Wind Turbine Manufacturers
2.2.6 Pattern of Wind Farm Developers
3 Global Wind Farm O&M Market
3.1 Market Size
3.2 Regional Structure
3.3 Cost Analysis
3.4 European Market
3.4.1 Market Size
3.4.2 Competitive Landscape
3.5 Corporate Pattern
4 Chinese Wind Farm O&M Market
4.1 Development
4.2 Market Size
4.3 Cost Analysis
4.4 Competitive Landscape
4.5 Offshore Wind Farm O&M
4.6 Development Trends
4.6.1 Market Trends
4.6.2 Development of Wisdom O & M
5 Major Global and Chinese Wind Farm O&M Companies
5.1 Vestas
5.1.1 Profile
5.1.2 Operation
5.1.3 Wind Farm O&M Business
5.1.4 Business in China
5.2 Gamesa
5.2.1 Profile
5.2.2 Operation
5.2.3 Wind Farm O&M Business
5.2.4 Business in China
5.3 Suzlon
5.3.1 Profile
5.3.2 Operation
5.3.3 Wind Farm O&M Business
5.3.4 Business in China
5.4 GE
5.4.1 Profile
5.4.2 Operation
5.4.3 Business in China
5.4.4 Wind Farm O&M Business
5.5 Siemens
5.5.1 Profile
5.5.2 Operation
5.5.3 Business in China
5.5.4 Wind Farm O&M Business
5.6 Longyuan Power
5.6.1 Profile
5.6.2 Operation
5.6.3 Wind Farm O&M Business
5.7 Goldwind
5.7.1 Profile
5.7.2 Operation
5.7.3 Wind Farm O&M Business
5.8 Ming Yang Wind Power
5.8.1 Profile
5.8.2 Operation
5.8.3 Wind Farm O&M Business
5.9 EULIKIND
5.9.1 Profile
5.9.2 Operation
5.9.3 Wind Farm O&M Business
5.10 Concord New Energy
5.10.1 Profile
5.10.2 Operation
5.10.3 Wind Farm O&M Business
5.11 United Power
5.11.1 Profile
5.11.2 Operation
5.11.3 Wind Farm O&M Business
5.12 CLCP
5.12.1 Profile
5.12.2 Operation
5.13 Sinovel Wind Group
5.13.1 Profile
5.13.2 Operation
5.13.3 Wind Farm O&M Business
5.14 Han Energy Technology
5.14.1 Profile
5.14.2 Operation
5.15 Gideon
5.15.1 Profile
5.15.2 Wind Farm O&M Business
5.16 Sharpower
5.16.1 Profile
5.16.2 Wind Farm O&M Business
5.17 East Environment Energy
5.17.1 Profile
5.17.2 Operation
5.17.3 Wind Farm O&M Business
5.18 EUM Wind Power Technologies Service (Beijing)
风电服务行业主要业务板块
2013&2021年全球风电运维市场服务类型占比
2008-2021年全球风电新增装机容量
2008-2021年全球风电累计装机容量
2016年全球前十大国家风电累计装机量及占比
2016年全球风电装机容量(分地区)
2011-2016年全球海上风电装机容量
1992-2016年德国新增及累计风电装机容量
2016年德国(分地区)风电装机容量
2005-2016年西班牙累计风电装机容量
2004-2016年美国累计风电装机容量
2016年美国(分地区)风电累计装机容量
2006-2016年美国风电主流机型度电成本
2012-2018年印度Annual Wind Capacity Addition
2016年Increasing Comfort of Global Institutional Customers in India Wind
1980-2020年中国风力发电机规模发展
1991-2016年中国新增和累计装机的风电机组平均功率
2007-2016年中国风电装机容量
2009-2016年中国风电并网装机容量
2015-2016年中国(分地区)新增风电装机容量占比
2012-2016年中国各地区新增风电装机容量趋势
2016年中国不同功率风电机组新增装机容量比例
2016年中国不同功率风电机组累计装机容量
2006-2016年1.5MW和2.0MW机组新增装机容量
2010-2050年中国风电发展目标及布局
2007-2016年中国海上风电新增装机容量及累计装机容量
中国首批海上风电特许权项目
2016年中国海上风电制造商累计装机容量
2016年中国海上风电不同功率机组累计装机容量
2016-2018年中国风力发电标杆上网电价
2016年中国风电整机制造企业新增装机容量
2016年中国风电整机制造企业中国市场份额
2013-2016年中国风电整机制造企业国内市场集中度
2016年中国风电制造企业累计装机容量
2016年中国风电制造企业累计市场份额
2016年中国风电开发商累计风电装机容量市场份额
2016年中国风电开发企业新增装机容量
2008-2021年全球风电运维市场规模
2015&2025年全球风电运维(分地区)市场规模构成
风电运维成本增长趋势
2014&2021年风电服务成本构成
2005-2020年欧洲风电运维市场规模
2005-2020年欧洲(分国家)风电运维市场规模
2012-2020年欧洲(分国家)新增可运维风电装机容量
2011&2020年欧洲风电运维(分电厂类型)市场份额
2016年欧洲风电运维市场(分国家和服务商类型)市场份额
2015-2016年全球主要风电运维企业兼并收购事件
2013-2021年中国出质保期风机容量
2008-2017年中国风电运维市场规模
50MW风电场年度运营成本
中国风电成本构成
中国陆地风力发电运营成本结构
中国海上风力发电运营成本结构
2015-2025年中国陆上风电度电成本下降趋势(平坦地形)
2025年国陆上风电度电成本下降趋势(复杂地形)
2015-2025年中国海上风电度电成本下降空间
2004-2050年中国风电机组价格
2016年中国风电运维(分企业类型)市场份额
中国风电运维市场三类竞争者SOWT分析
2016年中国主要风电企业风电运维业务发展
中国主要风电场业主类风电运维企业名单
中国主要风电整机厂商类风电运维企业名单
中国主要第三方风电运维企业名单
2016年中国海上风电成本测算
2016-2021年全球风电运维市场规模
2016-2021年中国风电运维市场规模
2025年中国路上风电成本路线图
Vestas全球分布
2009-2016年Vestas营业收入与净利润
2015-2016年Vestas Order intake
2015-2016年Average selling price of order intake
2012-2016年Vestas (分业务)营业收入构成
2012-2016年Vestas主要order数据
2014-2015年Vestas(分地区)风机出货量
2015-2016年Vestas(分地区)营业收入
2015-2016年Vestas(分地区)order intake
2016年Vestas Order intake by country
2009-2016年维斯塔斯风电运维服务Order backlog
2012-2016年Vestas Service revenue (onshore and offshore)
2016年Vestas风电运维订单
2016年Vestas(分地区)服务的风机容量
2008-2015年维斯塔斯在华风机出货量
2016年Vestas在华子公司
2009-2016年Gamesa营业收入与净利润
2015-2016年Gamesa公司订单量
2016年Gamesa公司月度订单量
2014-2016年Gamesa公司(分地区)订单量
2013-2016年Gamesa(分产品)营业收入构成
2013-2014年Gamesa(分地区)营业收入及构成
2016年Gamesa(分地区)风机销量构成
2015-2016年Gamesa季度销量
2010-2016年Gamesa公司风电运维业务营业收入
2015-2016年Gamesa公司风电运维Fleet and order book
Gamesa Merger with Siemens Wind Power moving forward
2015年Gamesa在中国经营情况
2008-2016年Gamesa在中国营业收入
2012-2015年Gamesa在中国风机销量占比
Suzlon group 业务结构
Suzlon研发基地
2016财年Suzlon公司(分地区) installed Capacity
2010-2017财年Suzlon营业收入与净利润
截至2016年底Suzlon公司的Order Book
2015-2017财年分季度Suzlon风机安装量
2014-2016财年Suzlon(分地区)营业收入构成
2009-2017财年Suzlon公司OMS业务营业收入
2016财年Suzlon公司运维服务能力
2017财年前三季度运维服务收入
2014-2016财年Suzlon在中国营业收入
2009-2015年GE营业收入与净利润
2015-2016年GE(分业务)主营业务收入构成
2011-2015年GE(分地区)主营业收入构成
通用电气灵活风电服务解决方案
西门子Digital Enterprise
2010-2017财年Siemens营业收入与净利润
2015-2016财年西门子经营情况
2014-2017财年Siemens(分业务)主营业务收入构成
2014-2017财年Siemens(分地区)主营业收入构成
2015年西门子在中国经营情况
2009-2016财年Siemens在中国营业收入
西门子中国战略
2011-2017财年Siemens风电部门营业收入
2017财年Q1西门子风电业务经营情况
2011-2017财年Siemens风电部门在手订单额
2016年西门子并购Gamesa
西门子风电运维系统
2009-2016年龙源电力营业收入与与净利润
2013-2016年龙源电力(分业务)营业收入构成
2012-2015年龙源电力(分业务)毛利率
龙源电力六大风电基地
2014-2016年龙源电力维修保养费用
2009-2016年金风科技营业收入与净利润
2011-2016年金风科技风机(分类型)销量
2014-2016年金风科技(分产品)主营业务收入构成
2015-2016年金风科技(分地区)主营业务收入构成
2011-2016年金风科技(分产品)毛利率
2010-2016年金风科技风电服务营业收入
2010-2016年天源科创营业收入及净利润
2015年底明阳风电主要生产基地及产能
2009-2016年明阳风电营业收入与净利润
2008-2015明阳风电风机出货量
2012-2015年明阳风电(分业务)营收占比
2012-2013年明阳风电(分地区)营收构成
明阳风电风电运维业务系统
2009-2015年明阳风电风电运维营业收入
优利康达服务地区分布
2014-2016年优利康达营业收入与净利润
2014-2016年优利康达(分业务)营业收入及构成
2014-2016年优利康达(分业务)毛利率
2015年优利康达前五名客户名称、收入贡献及占比
2009-2016年协合新能源营业收入与净利润
2013-2016年协合新能源(分业务)营业收入构成
2013-2016年协合新能源(分地区)营业收入构成
2013-2016年协合新能源风电运维营业收入
2012-2015年联合动力营业收入及净利润
2011-2014年联合动力风机销量
联合动力风电场工程总包(EPC)建设流程
2013-2016年科雷斯普营业收入与净利润
2014-2016年科雷斯普(分业务)营业收入及构成
2013-2016年华锐风电营业收入与净利润
2008-2016年汉能华公司发展历程
2013-2016年汉能华公司营业收入与净利润
2015-2016年汉能华公司(分产品)营业收入构成
2006-2016年吉地安主要风电运维项目
2012-2016年东润环能营业收入与净利润
2012-2016年东润环能(分业务)主营业务收入构成
东润环能风电运维系统
Major Business Sectors in Wind Power Service Industry
Structure of Global Wind Farm O&M Market by Type of Service, 2013 vs 2021E
Global Newly-installed Wind Power Capacity, 2008-2021E
Global Cumulative Installed Wind Power Capacity, 2008-2021E
Cumulative Installed Wind Power Capacityin Top 10 Countries and Percentages, 2016
Global Wind Power Installed Capacity (by Region), 2016
Global Offshore Wind Power Installed Capacity, 2011-2016
Newly-installed and Cumulative Wind Power Capacity in Germany, 1992-2016
Installed Wind Power Capacity in Germany (by Region), 2016
Cumulative Installed Wind Power Capacity in Spain, 2005-2016
Cumulative Installed Wind Power Capacity in USA, 2004-2016
Cumulative Installed Wind Power Capacity in USA (by Region), 2016
Cost Per Kw.h of Mainstream Wind Power Turbines in the United States, 2006-2016
Annual Wind Capacity Addition in India, 2012-2018E
Increasing Comfort of Global Institutional Customers in India Wind, 2016
Development Course of Chinese Wind Turbine Generators, 1980-2020E
Average Power of Newly-installed and Cumulatively-installed Wind Power Generation Units in China, 1991-2016
Installed Wind Power Capacity in China, 2007-2016
Grid-connected Installed Wind Power Capacity in China, 2009-2016
Newly-installed Wind Power Capacity Share (by Region) in China, 2015-2016
Newly-installed Wind Power Capacity Trend (by Region) in China, 2012-2016
Newly-installed Capacity Share of Wind Power Generating Units with Varied Power in China, 2016
Cumulative Installed Capacity of Wind Power Generating Units with Varied Power in China, 2016
Newly-installed Capacity of 1.5MW and 2.0MW Units, 2006-2016
Wind Power Development Goal and Layout in China, 2010-2050E
Newly-installed and Cumulative Offshore Wind Capacity in China, 2007-2016
China’s First Franchise Offshore Wind Projects
Cumulative Installed Wind Power Capacity of Chinese Offshore Wind Turbine Manufacturers, 2016
Cumulative Installed Capacity of Offshore Wind Power by Generating Units with Varied Power in China, 2016
Benchmark Feed-In Tariff for Wind Power in China, 2016-2018
Newly-installed Capacity of Chinese Wind Turbine Manufacturers, 2016
Market Share of Chinese Wind Turbine Manufacturers, 2016
Domestic Market Concentration of Chinese Wind Turbine Manufacturers, 2013-2016
Cumulative Installed Capacity of Chinese Wind Power Manufacturers, 2016
Cumulative Market Share of Chinese Wind Power Manufacturers, 2016
Market Share of Cumulative Wind Power Installed Capacity of Chinese Wind Farm Developers, 2016
Cumulative Wind Power Installed Capacity and Market Share of Chinese Wind Farm Developers, 2016
Newly-installed Wind Power Capacity of Chinese Wind Farm Developers, 2016
Global Wind Farm O&M Market Size, 2008-2021E
Global Wind Farm O&M Market Size Structure (by Region), 2015 vs 2025E
Cost Growth Trend of Wind Farm O&M
Cost Structure of Wind Power Service, 2014&2021
European Wind Farm O&M Market Size, 2005-2020E
European Wind Farm O&M Market Size (by Country), 2005-2020E
Newly-added Installed Wind Power Capacity Coming into O&M in Europe (by Country), 2012-2020E
Share of European Wind Farm O&M Market (by Type of Farm), 2011&2020E
Share of European Wind Farm O&M Market (by Country and Type of Service Provider), 2016
M&A Events of Major Wind Farm O&M Enterprises in the World, 2015-2016
Number of Wind Turbines Out of Warranty, 2013-2021E
Chinese Wind Farm O&M Market Size, 2008-2017
Annual Operating Costs of A 50MW Wind Farm
Cost Structure of Wind Power in China
Operating Costs Structure of Onshore Wind Power in China
Operating Costs Structure of Offshore Wind Power in China
Cost Per Kw.h Downtrend of Onshore Wind Power (Subdued Topography)in China, 2015-2025E
Cost Per Kw.h Downtrend of Onshore Wind Power (Accidented Topography) in China, 2015-2025E
Cost Per Kw.h Decline of Offshore Wind Power in China, 2015-2025E
Prices of Wind Power Generating Units in China, 2004-2050E
Wind Farm O&M Market Share (by Type of Companies) in China, 2016
SWOT Analysis of Three Types of Competitors in Chinese Wind Farm O&M Market
Wind Farm O&M Business of Major Wind Power Companies in China, 2016
Name List of Main Wind Farm O&M Enterprises (Type of Wind Farm Developers) in China
Name List of Main Wind Farm O&M Enterprises (Type of Wind Turbine Producers) in China
Name List of Key Third-party Wind Farm O&M Enterprises in China
Cost Estimation of Offshore Wind Power in China, 2016
Global Wind Farm O&M Market Size, 2016-2021E
China Wind Farm O&M Market Size, 2016-2021E
Cost Roadmap of Onshore Wind Power in China, 2025E
Global Footprint of Vestas
Revenue and Net Income of Vestas, 2009-2016
Order Intake of Vestas, 2015-2016
Average Selling Price of Order Intake of Vestas, 2016-2016
Revenue Structure of Vestas (by Business), 2012-2016
Data about Key Orders of Vestas, 2012-2016
Wind Turbine Shipments of Vestas (by Region), 2014-2015
Revenue of Vestas (by Region), 2015-2016
Order Intake of Vestas (by Region), 2015-2016
Order Intake of Vestas by Country, 2016
Wind Farm O&M Order Backlog of Vestas, 2009-2016
Vestas Service Revenue (Onshore and Offshore), 2012-2016
Wind Farm O&M Orders of Vestas, 2016
Capacity of Wind Turbines Served by Vestas (by Region), 2016
Wind Turbine Shipment of Vestas in China, 2008-2015
Subsidiaries of Vestas in China, 2016
Revenue and Net Income of Gamesa, 2009-2016
Order Book of Gamesa, 2015-2016
Monthly Orders of Gamesa, 2016
Order Book of Gamesa (by Region), 2014-2016
Revenue Structure of Gamesa (by Product), 2013-2016
Revenue Structure of Gamesa (by Region), 2013-2014
Wind Turbine Sales Volume Structure of Gamesa (by Region), 2016
Quarterly Sales Volume of Gamesa, 2015-2016
Wind Farm O&M Business Revenue of Gamesa, 2010-2016
Wind Farm O&M Fleet and Order Book of Gamesa, 2015-2016
Gamesa Merger with Siemens Wind Power moving forward
Operation of Gamesa in China, 2015
Revenue of Gamesa in China, 2008-2016
Percentage of Gamesa’s Wind Turbine Sales Volume in China, 2012-2015
Business Structure of SuzlonGroup
R&D Bases of Suzlon
Installed Capacity (by Region) of Suzlon, FY2016
Revenue and Net Income of Suzlon, FY2010-FY2017
Order Book of Suzlon as of End-2016
Wind Turbine Installations of Suzlon (by Quarter), FY2015-FY2017
Revenue Structure of Suzlon (by Region), FY2014-FY2016
OMS Business Revenue of Suzlon, FY2009-FY2017
OMS Capability of Suzlon, 2016
OMS Revenue of Suzlon, FY2017Q1-Q3
Revenue of Suzlon in China, FY2014-FY2016
Revenue and Net Income of GE, 2009-2015
Operating Revenue Structure of GE (by Business), 2015-2016
Operating Revenue Structure of GE (by Region), 2011-2015
GE’s Flexible Wind Farm Service Solutions
Digital Enterprise of Siemens
Revenue and Net Income of Siemens, FY2010-FY2017
Operation of Siemens, FY2015-FY2016
Operating Revenue Structure of Siemens (by Business), FY2014-FY2017
Operating Revenue Structure of Siemens (by Region), FY2014-FY2017
Operating of Siemens in China, 2015
Revenue of Siemens in China, FY2009-FY2016
Strategy of Siemens in China
Revenue of Wind Power Division of Siemens, FY2011-FY2017
Wind Power Business Operation of Siemens, FY2017Q1
Order Backlog of Siemens’ Wind Power Division, FY2011-FY2017
Siemens’ Acquisition on Gamesa in 2016
Wind Farm O&M System of Siemens
Revenue and Net Income of Longyuan Power, 2009-2016
Revenue Structure of Longyuan Power (by Business), 2013-2016
Gross Margin of Longyuan Power (by Business), 2012-2015
Six Wind Farm Bases of Longyuan Power
O&M Costs of Longyuan Power, 2014-2016
Revenue and Net Income of Goldwind, 2009-2016
Wind Turbine Sales Volume of Goldwind (by Type), 2011-2016
Operating Revenue Structure of Goldwind (by Product), 2014-2016
Operating Revenue Structure of Goldwind (by Region), 2015-2016
Gross Margin of Goldwind (by Product), 2011-2016
Wind Farm Service Revenue of Goldwind, 2010-2016
Revenue and Net Income of Tian Yuan New Energy Technology, 2010-2016
Main Production Bases and Capacity of Ming Yang Wind Power, End-2015
Revenue and Net Income of Ming Yang Wind Power, 2009-2016
Wind Turbine Shipment of Ming Yang Wind Power, 2008-2015
Revenue Structure of Ming Yang Wind Power (by Business), 2012-2015
Revenue Structure of Ming Yang Wind Power (by Region), 2012-2013
Wind Farm O&M Business System of Ming Yang Wind Power
Wind Farm O&M Revenue of Ming Yang Wind Power, 2009-2015
Regions Covered by EULIKIND’s Services
Revenue and Net Income of EULIKIND, 2014-2016
Revenue Structure of EULIKIND (by Business), 2014-2016
Gross Margin of EULIKIND (by Business), 2014-2016
Name List and Revenue Contribution of EULIKIND’S Top 5 Customers, 2015
Revenue and Net Income of Concord New Energy, 2009-2016
Revenue Structure of Concord New Energy (by Business), 2013-2016
Revenue Structure of Concord New Energy (by Region), 2013-2016
Wind Farm O&M Revenue of Concord New Energy, 2013-2016
Revenue and Net Income of United Power, 2012-2015
Wind Turbine Sales Volume of United Power, 2011-2014
Wind Farm EPC Construction Flow of United Power
Revenue and Net Income of CLCP, 2013-2016
Revenue Structure of CLCP (by Business), 2014-2016
Revenue and Net Income of Sinovel Wind Group, 2013-2016
Development History of Han Energy Technology, 2008-2016
Revenue and Net Income of Han Energy Technology, 2013-2016
Revenue Structure of Han Energy Technology(by Product), 2015-2016
Key Wind Farm O&M Projects of Gideon, 2006-2016
Revenue and Net Income of East Environment Energy, 2012-2016
Operating Revenue Structure of East Environment Energy(by Business), 2012-2016
Wind Farm O&M System of East Environment Energy
如果这份报告不能满足您的要求,我们还可以为您定制报告,请 留言说明您的详细需求。
|