|
|
|
报告导航:研究报告—
制造业—材料
|
|
2017-2021年全球及中国碳纤维及碳纤维复合材料(CFRP)行业研究报告 |
 |
字数:5.0万 |
页数:161 |
图表数:198 |
|
中文电子版:9000元 |
中文纸版:4500元 |
中文(电子+纸)版:9500元 |
|
英文电子版:2300美元 |
英文纸版:2500美元 |
英文(电子+纸)版:2600美元 |
|
编号:ZHP056
|
发布日期:2017-03 |
附件:下载 |
 |
|
|
碳纤维作为新一代增强纤维,具有出色的力学性能和化学稳定性,是目前已大量生产的高性能纤维中比强度、比模量最高的纤维材料。
2016年全球碳纤维需求量约8.3万吨,同比增长12.0%。其中,中国需求量为1.9万吨,全球占比为22.9%,是全球主要的碳纤维需求市场之一。但由于中国碳纤维生产技术相对落后、生产能力不足,碳纤维产品(尤其是高性能碳纤维产品)主要依靠进口,2016年碳纤维国产化率仅24.9%。随着生产技术的发展,中国未来碳纤维的国产化率将进一步提高,预计2021年可突破35.0%。
从全球范围看,碳纤维及其复合材料主要应用在航空航天、风电等领域,2015年两者需求占比合计为46%。同期,中国这两个领域的碳纤维需求占比合计不超过15%;而体育休闲领域的需求占比则超过50%,近几年随着汽车、风电、航空航天等产业的发展,体育休闲领域的需求占比处于下滑趋势。
未来,碳纤维及其复合材料产业的发展动力主要来自汽车、风电、航空航天等领域,尤其是新能源汽车。因为采用碳纤维材料可以有效减轻车身重量,达到节能减排、增加续航里程等效果。但是由于碳纤维成本较高,目前主要应用在法拉利、宝马等豪华车型上。未来,随着碳纤维回收产业的发展,使用成本会有所下降,碳纤维将逐渐在丰田、福特等中端车型上使用。
由于生产工艺复杂、技术含量高,加之政治因素限制技术和设备等引进,中外碳纤维产业存在一定的差距。
一是产品方面:2017年日本东丽已经开始进行T2000级别碳纤维(强度是T1000级碳纤维额10倍,且在聚合的过程中可以不掺入杂质)的研究,而中国大陆刚实现T800级碳纤维的量产。
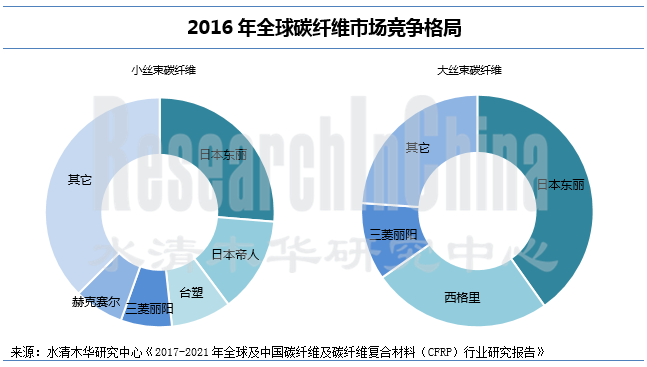
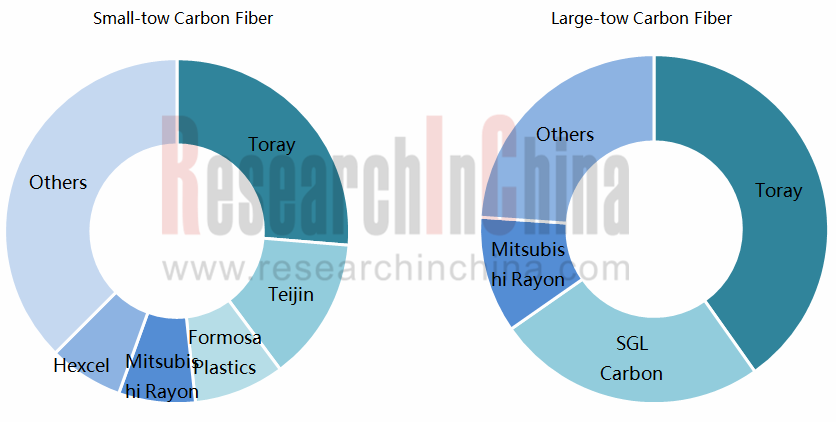
二是企业方面:日本东丽、日本帝人、三菱丽阳、美国Hexcel、美国Cytec(被比利时Solvay收购)、中国台塑等企业拥有全球碳纤维市场绝大部分市场份额。其中日本东丽在收购美国Zoltek之后,全球占比达到30%,而其大丝束碳纤维的市场占比则在40%以上。相比之下,中国千吨级以上碳纤维企业只有中复神鹰、恒神股份、蓝星纤维等6家,全球市场份额累计不足15%。
水清木华研究中心《2017-2021年全球及中国碳纤维及碳纤维复合材料(CFRP)行业研究报告》着重研究了以下内容:
 碳纤维的定义、分类、应用、技术水平产业链等情况; 碳纤维的定义、分类、应用、技术水平产业链等情况;
全球碳纤维发展现状、市场供需、竞争格局、专利现状、成本及价格、发展趋势等情况;
中国碳纤维政策环境、发展现状、市场供需、产业布局、竞争格局、进出口、发展趋势等情况;
碳纤维复合材料市场规模、市场结构、成本结构、竞争现状等情况;
上游碳纤维原丝、下游(航空航天、汽车、风电、体育休闲等)市场现状、市场需求等情况;
国外10家、中国20家碳纤维生产企业的经营情况、碳纤维业务、在华布局等情况。
As a new generation of reinforced fiber featuring excellent mechanical property and chemical stability, carbon fiber is the one with the highest specific strength and specific modulus among mass-produced high-performance fibers.
Global carbon fiber demand approximated 83,000 tons in 2016, a 12.0% increase from a year ago. China, one of the world’s leading sources of carbon fiber demand, consumed 19,000 tons, 22.9% of the global total. However, China relies heavily on imported carbon fiber products (particularly high-performance ones) because of its outdated production techniques and inadequate production capacity. Only 24.9% of carbon fibers were produced locally in China in 2016 and the localization rate is expected to exceed 35.0% in 2021 along with technological advances.
Carbon fiber and its composites are primarily applied to aviation & aerospace and wind power fields which together accounted for 46% of the world’s demand in 2015, compared with no more than 15% in China; sports and leisure fields made up more than 50% globally in 2015 but has suffered a decline in percentage as automobile/wind power/aviation & aerospace industries develop in recent years.
Carbon fiber and its composites industry will be mainly driven by automobile, wind power, and /aviation & aerospace fields, especially new energy vehicles. Carbon fiber materials can significantly reduce the weight of vehicle body, thus saving energy, reducing emissions, and increasing mileage. However, due to high costs, carbon fiber is chiefly used in Ferrari, BMW and other luxury models. As carbon-fiber recycling industry develops, the costs will decline, enabling its application to Toyota, Ford, and other middle-end models.
As carbon fiber is produced with sophisticated production processes and advanced technology, China, isolated from these technologies and equipment because of political factors, lags far behind foreign countries.
1) Product: Japan-based Toray has started research into T2000 carbon fiber (10 times as much as the strength of T1000 carbon fiber and no impurities during polymerization) in 2017, while China just achieves mass production of T800 carbon fiber.
2) Enterprise: Japanese Toray, Teijin, Mitsubishi Rayon, U.S. Hexcel, Cytec (acquired by Belgian Solvay), and China’s Formosa Plastics take the lion’s share of global carbon fiber market. After the acquisition of U.S. Zoltek, Toray holds a 30% share of global market as a whole and over 40% share of large-tow carbon fiber market specifically. By contrast, there are only six Chinese enterprises with production capacity of 1000t and above/a each including Zhongfu Shenying Carbon Fiber, Jiangsu Hengshen Fiber Material, and Bluestar Fibres, claiming a combined global share of less than 15%.
Competitive Landscape of Global Carbon Fiber Market, 2016
Global and China Carbon Fiber and CFRP Industry Report, 2017-2021
Global and China Carbon Fiber and CFRP Industry Report, 2017-2021 by ResearchInChina highlights the following:
 Carbon fiber (definition, classification, application, level of technology, industry chain, etc.); Carbon fiber (definition, classification, application, level of technology, industry chain, etc.);
Global carbon fiber market (status quo, supply & demand, competitive landscape, patent, costs & prices, development trends, etc.);
Chinese carbon fiber market (policy environment, development status, supply & demand, industrial layout, import & export, development trends, etc.);
Carbon fiber composites market (size, structure, cost structure, competition, etc.);
Upstream carbon fiber precursor and downstream (aviation & aerospace, automobile, wind power, sports & leisure, etc.) (market situation, market demand, etc.);
10 foreign and 20 Chinese carbon fiber manufacturers (operation, carbon fiber business, presence in China, etc.)
第一章碳纤维概述
1.1 定义及性质
1.2 工艺流程
1.3 分类
1.4 应用
1.5 技术水平
1.6 产业链
第二章全球碳纤维市场
2.1 发展现状
2.2 供需分析
2.2.1 供给
2.2.2 需求
2.3 竞争格局
2.3.1 碳纤维
2.3.2 PAN基碳纤维
2.3.3 沥青基碳纤维
2.4 生产技术与装备
2.5 专利现状
2.6 成本与价格
2.7 发展趋势
第三章中国碳纤维市场
3.1 政策环境
3.2 发展现状
3.3 供需分析
3.3.1 供给
3.3.2 需求
3.4 产业布局
3.5 竞争格局
3.6 生产技术与装备
3.7 价格
3.8 技术水平
3.9 进出口分析
3.9.1 碳纤维
3.9.2 碳纤维预浸料
3.9.3 其他碳纤维制品
3.10 发展趋势
第四章碳纤维复合材料
4.1 市场规模
4.2 市场结构
4.2.1 碳纤维复合材料
4.2.2 树脂基碳纤维复合材料
4.3 成本结构
4.4 专利现状
4.5 竞争现状
第五章上下游产业链分析
5.1 上游碳纤维原丝
5.1.1 全球
5.1.2 中国
5.2 下游应用领域
5.2.1 航空航天
5.2.2 汽车
5.2.3 风电
5.2.4 体育休闲
第六章海外重点企业
6.1 日本东丽
6.1.1 公司简介
6.1.2 经营情况
6.1.3 碳纤维业务
6.1.4 在华业务
6.2 日本帝人
6.2.1 公司简介
6.2.2 经营情况
6.2.3 碳纤维业务
6.2.4 在华业务
6.3 三菱化学控股集团
6.3.1 公司简介
6.3.2 经营情况
6.3.3 碳纤维业务
6.4 日本吴羽
6.4.1 公司简介
6.4.2 经营情况
6.4.3 碳纤维业务
6.4.4 在华业务
6.5 美国赫克塞尔
6.5.1 公司简介
6.5.2 经营情况
6.5.3 碳纤维业务
6.6 比利时索尔维
6.6.1 公司简介
6.6.2 经营状况
6.6.3 碳纤维业务
6.7 德国西格里
6.7.1 公司简介
6.7.2 经营状况
6.7.3 碳纤维业务
6.8 台塑
6.8.1 公司简介
6.8.2 经营情况
6.8.3 碳纤维业务
6.9 其他
6.9.1 韩国晓星
6.9.2 韩国泰光
6.9.3土耳其AKSACA
第七章中国大陆碳纤维厂商
7.1 恒神股份
7.1.1 公司简介
7.1.2 经营状况
7.1.3 客户及供应商
7.1.4 碳纤维业务
7.2 吉林碳谷
7.2.1 公司简介
7.2.2 经营状况
7.2.3 主要客户及供应商
7.2.4 碳纤维业务
7.3 方大炭素
7.3.1 企业简介
7.3.2 经营情况
7.3.3 研发
7.3.4 碳纤维业务
7.4 康得新
7.4.1 企业简介
7.4.2 经营情况
7.4.3 研发
7.4.4 碳纤维业务
7.5 吉林炭素
7.5.1 公司简介
7.5.2 经营状况
7.5.3 碳纤维业务
7.6 金发科技
7.6.1 公司简介
7.6.2 碳纤维业务
7.7 吉研高科
7.7.1 公司简介
7.7.2 碳纤维业务
7.8 江苏天鸟
7.8.1 公司简介
7.8.2 碳纤维业务
7.9 江苏航科
7.9.1 公司简介
7.9.2 碳纤维业务
7.10 其他企业
7.10.1 中复神鹰
7.10.2 威海拓展
7.10.3 河南永煤
7.10.4 沈阳中恒
7.10.5 中简科技
7.10.6 兴科控股
7.10.7 上海石化
7.10.8 蓝星纤维
7.10.9 嘉兴中宝
7.10.10 浙江精业
1 Overview of Carbon Fiber
1.1 Definition and Properties
1.2 Process Flow
1.3 Classification
1.4 Application
1.5 Technical Level
1.6 Industry Chain
2 Global Carbon Fiber Market
2.1 Status Quo
2.2 Supply and Demand
2.2.1 Supply
2.2.2 Demand
2.3 Competitive Landscape
2.3.1 Carbon Fiber
2.3.2 PAN-based Carbon Fiber
2.3.3 Pitch-based Carbon Fiber
2.4 Production Technology and Equipment
2.5 Status Quo of Patents
2.6 Cost and Price
2.7 Development Trend
3 Chinese Carbon Fiber Market
3.1 Policy
3.2 Status Quo
3.3 Supply and Demand
3.3.1 Supply
3.3.2 Demand
3.4 Industrial Layout
3.5 Competitive Landscape
3.6 Production Technology and Equipment
3.7 Price
3.8 Technical Level
3.9 Import & Export
3.9.1 Carbon Fiber
3.9.2 Carbon Fiber Prepreg
3.9.3 Other Carbon Fiber Products
3.10 Development Trend
4 Carbon Fiber Composites
4.1 Market Size
4.2 Market Structure
4.2.1 Carbon Fiber Composites
4.2.2 Carbon Fiber Reinforced Polymer (CFRP)
4.3 Cost Structure
4.4 Status Quo of Patents
4.5 Current Competition
5 Upstream and Downstream Industry Chains
5.1 Upstream Carbon Fiber Precursor
5.1.1 Global
5.1.2 China
5.2 Downstream Applications
5.2.1 Aviation & Aerospace
5.2.2 Automobile
5.2.3 Wind Power
5.2.4 Sport & Leisure
6 Key Overseas Companies
6.1 Toray
6.1.1 Profile
6.1.2 Operation
6.1.3 Carbon Fiber Business
6.1.4 Business in China
6.2 Teijin
6.2.1 Profile
6.2.2 Operation
6.2.3 Carbon Fiber Business
6.2.4 Business in China
6.3 Mitsubishi Chemical Corporation
6.3.1 Profile
6.3.2 Operation
6.3.3 Carbon Fiber Business
6.4 Kureha
6.4.1 Profile
6.4.2 Operation
6.4.3 Carbon Fiber Business
6.4.4 Business in China
6.5 Hexcel
6.5.1 Profile
6.5.2 Operation
6.5.3 Carbon Fiber Business
6.6 Solvay
6.6.1 Profile
6.6.2 Operation
6.6.3 Carbon Fiber Business
6.7 SGL Carbon
6.7.1 Profile
6.7.2 Operation
6.7.3 Carbon Fiber Business
6.8 Formosa Plastics
6.8.1 Profile
6.8.2 Operation
6.8.3 Carbon Fiber Business
6.9 Others
6.9.1 Hyosung
6.9.2 Taekwang
6.9.3 AKSACA
7 Carbon Fiber Manufacturers in Mainland China
7.1 Jiangsu Hengshen Fiber Material
7.1.1 Profile
7.1.2 Operation
7.1.3 Customers and Suppliers
7.1.4 Carbon Fiber Business
7.2 Jilin Tangu Carbon Fiber
7.2.1 Profile
7.2.2 Operation
7.2.3 Customers and Suppliers
7.2.4 Carbon Fiber Business
7.3 Fangda Carbon New Material
7.3.1 Profile
7.3.2 Operation
7.3.3 R&D
7.3.4 Carbon Fiber Business
7.4 Beijing Kangde Xin Composite Material
7.4.1 Profile
7.4.2 Operation
7.4.3 R&D
7.4.4 Carbon Fiber Business
7.5 Jilin Carbon
7.5.1 Profile
7.5.2 Operation
7.5.3 Carbon Fiber Business
7.6 Kingfa Sci.&Tech
7.6.1 Profile
7.6.2 Carbon Fiber Business
7.7 Jiyan High-tech Fibers
7.7.1 Profile
7.7.2 Carbon Fiber Business
7.8 Jiangsu Tianniao High Technology
7.8.1 Profile
7.8.2 Carbon Fiber Business
7.9 Jiangsu Hangke Composite Materials Technology
7.9.1 Profile
7.9.2 Carbon Fiber Business
7.10 Others
7.10.1 Zhongfu Shenying Carbon Fiber
7.10.2 Weihai Tuozhan Fiber
7.10.3 HNEC Yongmei Carbon Fiber
7.10.4 Shenyang Zhongheng New Materials
7.10.5 Sinofibers Technology
7.10.6 Xingke Holdings
7.10.7 Shanghai Petrochemical
7.10.8 Bluestar Fibres
7.10.9 Jiaxing Sinodia Carbon Fiber
7.10.10 Zhejiang Jingye Biochemical
图:碳纤维的轻量特性
图:碳纤维产业成长历史
表:碳纤维与常规材料性能对比
图:PAN基碳纤维生产工艺流程
图:PAN基碳纤维热处理过程
表:2015年碳纤维产业链附加值
表:碳纤维按不同类别分类
表:不同碳纤维性能对比
图:PAN基碳纤维性能分类
表:不同碳纤维复合材料及用途
表:碳纤维及其复合材料种类和主要应用
图:不同性能碳纤维性能对比
图:碳纤维产业链
表:全球碳纤维发展历程
图:2013-2021年全球碳纤维市场规模及增速
图:2009-2017年全球碳纤维产能及增长率
图:2016年全球碳纤维(分产品)产能结构
表:2016年全球主要碳纤维生产企业产能
图:2016年全球碳纤维(分国家/地区)产能构成
图:2015年全球PNA基碳纤维产能(分国家/地区)产能构成
图:2010-2021年全球碳纤维需求量及增长率
图:2015/2021年全球碳纤维(分应用领域)需求结构
图:全球碳纤维生产企业三大梯队
图:2016年全球碳纤维生产商产能结构
图:2016年全球PAN基碳纤维(小丝束)企业市场份额
图:2016年全球PAN基碳纤维(大丝束)企业市场份额
表:2015年全球及中国主要企业碳纤维经营情况对比
表:全球主要沥青基碳纤维生产商
表:国外主要企业原丝工艺技术及性能参数对比表
图:2005-2017年全球碳纤维专利数量
图:2015年全球碳纤维(分地区)专利数量结构
图:碳纤维生产过程及生产成本
图:2007-2017年全球碳纤维平均销售价格
表:原始碳纤维和回收碳纤维的成本比较
图:英国RCF公司回收碳纤维的工艺流程
表:碳纤维产业相关政策
图:2015-2021年中国碳纤维市场规模
图:2015-2021年中国碳纤维产能
图:2010-2021年中国碳纤维产量
图:2015年中国碳纤维(分产品)产量构成
表:2016年中国主要碳纤维生产企业及其产能
表:2016-2017年中国碳纤维拟/在建项目
图:2013-2021年中国碳纤维国产化率
图:2010-2021年中国碳纤维需求量及增长率
图:2010-2021年中国碳纤维需求量占全球比重
图:2015/2021年中国碳纤维(分应用领域)需求结构
图:2015年中国碳纤维(分省市)需求结构
图:中国碳纤维生产企业分布
图:2016年中国碳纤维(分省份)产能构成
图:2016年中国碳纤维市场竞争格局
图:中国碳纤维产业链企业布局
表:中国碳纤维生产企业技术装备情况
表:2009-2017年日本T700级碳纤维进口价格
表:中国碳纤维行业低、高端产品市场价格对比
表:中复神鹰碳纤维性能指标参数
表:中国碳纤维产品发展阶段
图:2015年中国进口碳纤维及制品主要应用领域占比
图:2010-2016年中国碳纤维进出口量
图:2010-2016年中国碳纤维进出口平均价格
图:2016年中国碳纤维(分地区)进口量构成
图:2016年中国碳纤维(分地区)出口量构成
图:2012-2016年中国碳纤维预浸料进出口量
图:2012-2016年中国碳纤维预浸料进出口平均价格
图:2016年中国碳纤维预浸料(分地区)进口量构成
图:2016年中国碳纤维预浸料出口目的地分布(按出口量)
图:2010-2016年中国其他碳纤维制品进出口量
图:2010-2016年中国其他碳纤维制品进出口平均价格
图:2016年中国其他碳纤维制品(分地区)进口量构成
图:2016年中国其他碳纤维制品(分地区)出口量构成
表:《中国制造2025》碳纤维复合材料发展规划
图:2013-2021年全球碳纤维复合材料市场规模及增长率
图:2015年全球碳纤维复合材料(分地区)市场规模占比
图:2015年高性能复合材料(分产品)市场规模构成
图:2015年碳纤维复合材料(分基材)市场规模占比
图:2015年树脂基碳纤维复合材料(分应用领域)市场规模构成
图:2015年树脂基碳纤维复合材料(分地区)市场规模构成
图:2015年树脂基碳纤维复合材料(分生产工艺)产量构成
图:碳纤维复合材料成本结构
表:截止2015年全球碳纤维复合材料专利数量
表:中国主要的碳纤维复合材料生产商
表:全球主流厂商PN碳纤维原丝制备路线
图:2016年全球碳纤维原丝(分国家)产能构成
图:2016年中国碳纤维原丝(分企业)产能构成
图:2013-2021年全球碳纤维应用结构
图:碳纤维在航空航天领域的应用历程
图:2015年全球航空航天领域细分市场销售收入构成
图:2015年全球航空材料(分产品)市场份额
图:2015年全球航空材料(分用途)市场份额
图:波音787客机碳纤维复合材料应用情况
图:A380机身结构
图:B787机身结构
表:全球主要碳纤维生产企业在航空航天领域中的拓展
图:2015年全球航空航天领域碳纤维复合材料市场规模结构
图:2016年全球航空航天领域碳纤维复合材料(分客户)需求结构
图:2013-2021年全球航空和国防用碳纤维复合材料市场规模
图:碳纤维复合材料在汽车上的应用
表:CFRP汽车零部件轻量化实例
表:全球主要整车厂商的碳纤维应用案例及供应商
表:2011-2016年全球主要碳纤维生产企业在汽车工业中的拓展
图:碳纤维在宝马汽车零部件中的应用比例
图:2013-2016年宝马碳纤维工厂产能
图:宝马i3的碳纤维车身生产工艺
图:2020年全球汽车领域碳纤维使用量
图:碳纤维和钢铁制造汽车的成本对比
图:2013-2021年全球汽车用碳纤维复合材料市场规模及增速
图:碳纤维复合零件的制造工艺及用途
图:聚丙烯腈碳纤维混合沥青碳纤维后性能显著提升
图:碳纤维叶片
图:碳纤维在风机叶片中的应用
图:碳纤维复合材料在风机上的应用实例
图:2009-2021年全球风电累计装机容量和新增装机容量
图:2014-2016年全球(分地区)风电装机容量占比
图:2013-2021年全球风电用碳纤维复合材料市场规模
图:2015年全球体育休闲(分产品)碳纤维复合材料需求量构成
图:2013-2021年全球体育休闲用碳纤维复合材料市场规模
图:日本东丽全球布局
图:日本东丽全球业务发展历程
图:2010-2016财年日本东丽净销售额和净利润
图:2014-2016财年日本东丽(分部门)销售收入构成
表:2014-2015财年日本东丽(分地区)销售收入
图:2010-2016财年日本东丽碳纤维业务净销售额与营业利润
图:2012-2015财年东丽碳纤维部门(按应用领域)销售收入占比
表:2016年东丽碳纤维工厂及其产能
图:2015-2016财年东丽碳纤维相关投资项目
图:日本东丽GR项目发展
表:日本东丽在华企业
图:帝人全球布局
图:2010-2016财年帝人净销售额和净利润
图:2014-2016财年帝人(分部门)销售收入构成
图:2011-2015财年日本Teijin先进纤维及其复合材料部门销售收入和营业利润
图:2015财年帝人(分地区)销售收入构成
表:帝人集团下属碳纤维公司
表:日本东邦碳纤维主要应用领域
图:2010-2016财年三菱化学控股净销售额与净利润
图:2014-2015财年三菱化学控股(分业务)销售收入构成
表:三菱丽阳基本信息
表:三菱丽阳下属碳纤维公司一览表
表:三菱丽阳碳纤维主要应用领域
表:三菱丽阳碳纤维业务发展情况
图:2010-2016财年日本吴羽净销售额和净利润
图:2013-2016财年日本Kureha(分业务)销售收入构成
图:2010-2016财年日本Kureha先进材料部门销售收入及营业利润
图:2013-2016财年日本Kureha先进材料部门主要产品销售收入
图:Hexcel生产基地全球分布
图:2010-2015年美国Hexcel净销售额与净利润
图:2013-2015美国Hexcel(分业务)销售收入构成
图:2013-2015年美国Hexcel(分地区)销售收入构成
图:Solvay全球布局
图:2010-2016年Solvay销售额与净利润
图:2016年Solvay(分业务)销售额构成
图:2016年Solvay(分地区)销售额构成
图:2016年Solvay(分应用领域)销售额构成
图:德国SGL全球生产基地分布
图:2010-2016年德国SGL销售收入与净利润
图:2014-2016年德国SGL(分业务)销售收入构成
图:2013-2015年德国SGL(分地区)销售收入构成
图:2014-2015年德国SGL(分消费领域)销售收入构成
图:2013-2016年德国SGL碳纤维及复合材料部门销售收入及EBITDA
图:2014-2015年德国SGL碳纤维及复合材料部门(分业务)销售收入构成
图:2014-2015年德国SGL碳纤维及复合材料部门(分市场)销售收入构成
表:台塑事业部门及主营业务
图:2010-2016年台塑营业收入及净利润
图:2014-2015年台塑(分部门)营业收入构成
图:2010-2015年台塑碳纤维销售收入及平均价格
图:2010-2015年台塑碳纤维产能、产量及开工率
图:2010-2015年台塑碳纤维销量和产销率
图:韩国晓星全球布局
表:2014-2015年韩国晓星经营情况
图:2013-2016年恒神股份营业收入和净利润
图:2013-2015年恒神股份(分产品)营业收入构成
图:2015年恒神股份(分地区)营业收入构成
图:2013-2016年恒神股份前五名客户贡献收入及占比
表:2015年恒神股份主要客户销售额及占比
图:2013-2015年恒神股份前五大供应商采购金额及占比
表:2015年恒神股份主要供应商采购金额及占比
图:2013-2016年吉林碳谷营业收入和净利润
表:2014-2015年吉林碳谷(分地区)营业收入及占比
表:2015年吉林碳谷主要客户销售额及占比
表:2015年吉林碳谷主要供应商采购额及占比
表:吉林碳谷碳纤维原丝相关技术
图:2013-2016年吉林碳谷碳纤维原丝销量
图:2015年方大炭素(分产品)产能分布
图:2010-2016年方大炭素营业收入与净利润
图:2010-2016年方大炭素(分产品)营业收入构成
图:2010-2016年方大炭素(分地区)营业收入构成
图:2009-2016年方大炭素(分产品)毛利率
图:2011-2016年方大炭素研发投入及占比
图:2012-2016年江城碳纤维营业收入和净利润
图:2010-2016年康得新营业收入与净利润
图:2013-2016年康得新(分产品)营业收入构成
图:2010-2016年康得新(分地区)营业收入构成
图:2011-2016年康得新毛利率
图:2011-2016年康得新研发投入与占比
图:2010-2016年吉林炭素营业收入和净利润
图:2015年吉林炭素(分产品)营业收入构成
图:2013-2016年金发碳纤维净利润
图:2014-2016年吉研高科营业收入和净利润
图:2015年江苏天鸟(分业务)营业收入构成
Lightweight Properties of Carbon Fiber
History of Carbon Fiber Industry
Performance Comparison of Carbon Fiber and Conventional Materials
Production Process of PAN-based Carbon Fiber
Heat Treatment Process of PAN-based Carbon Fiber
Added Value of Carbon Fiber Industry Chain, 2015
Classification of Carbon Fiber by Type
Performance Comparison of Different Carbon Fibers
Classification of PAN-based Carbon Fiber by Performance
Different Carbon Fiber Composites and Their Uses
Types and Main Application of Carbon Fibers and Their Composites
Performance Comparison of Different Carbon Fibers
Carbon Fiber Industry Chain
History of Global Carbon Fiber Development
Global Carbon Fiber Market Size and Growth Rate, 2013-2021E
Global Carbon Fiber Capacity and Growth Rate, 2009-2017
Global Carbon Fiber Capacity Structure (by Product), 2016
Capacity of World’s Major Carbon Fiber Production Enterprises, 2016
Global Carbon Fiber Capacity Structure (by Country/Region), 2016
Global PAN-based Carbon Fiber Capacity Structure (by Country/Region), 2015
Global Carbon Fiber Demand and Growth Rate, 2010-2021E
Global Carbon Fiber Demand Structure (by Applications), 2015/2021E
Three Echelons of Global Carbon Fiber Production Enterprises
Capacity Structure of Global Carbon Fiber Producers, 2016
Market Share of Global PAN-based Carbon Fiber (Small Tow) Enterprises, 2016
Market Share of Global PAN-based Carbon Fiber (Large Tow) Enterprises, 2016
Comparison of Carbon Fiber Operations between World and China’s Major Enterprises, 2015
World’s Major Pitch-based Carbon Fiber Producers
Comparison Table of Precursor Technology and Performance Parameters of Major Foreign Companies
Number of Global Carbon Fiber Patents, 2005-2017
Numerical Structure of Global Carbon Fiber Patents (by Region), 2015
Carbon Fiber Production Process and Cost
Average Selling Price of Global Carbon Fiber, 2007-2017
Cost Comparison of Original Carbon Fiber and Recycled Carbon Fiber
Recycling Carbon Fiber Recycling Process of RCF
Policies on Carbon Fiber Industry
China’s Carbon Fiber Market Size, 2015-2021E
China’s Carbon Fiber Capacity, 2015-2021E
China’s Carbon Fiber Production, 2010-2021E
China’s Carbon Fiber Production Structure (by Product), 2015
China’s Major Carbon Fiber Production Enterprises and Their Capacity, 2016
China’s Carbon Fiber Projects (Proposed & Under Construction), 2016-2017
China’s Carbon Fiber Localization Rate, 2013-2021E
China’s Carbon Fiber Demand and Growth Rate, 2010-2021E
China’s Carbon Fiber Demand as A Percentage of Global Demand, 2010-2021E
China’s Carbon Fiber Demand Structure (by Applications), 2015/2021E
China’s Carbon Fiber Demand Structure (by Province/Municipality), 2015
Distribution of Chinese Carbon Fiber Production Enterprises
China’s Carbon Fiber Capacity Structure (by Province), 2016
Competition Pattern of China’s Carbon Fiber Market, 2016
Corporate Layout of China’s Carbon Fiber Industry Chain
Technical Equipment of Chinese Carbon Fiber Production Enterprises
Import Price of Japan’s T700 Carbon Fiber, 2009-2017
Market Price Comparison of High-end and Low-end Products in China’s Carbon Fiber Industry
Performance Parameters of Zhongfu Shenying Carbon Fiber
Stages of China’s Carbon Fiber Product Development
Structure of China’s Imported Carbon Fiber and Products by Applications, 2015
China’s Carbon Fiber Export and Import Volume, 2010-2016
Average Price of China’s Carbon Fiber Exports and Imports, 2010-2016
Structure of China’s Carbon Fiber Import Volume (by Region), 2016
Structure of China’s Carbon Fiber Export Volume (by Region), 2016
China’s Carbon Fiber Prepreg Export and Import Volume, 2012-2016
Average Price of China’s Carbon Fiber Prepreg Exports and Imports, 2012-2016
Structure of China’s Carbon Fiber Prepreg Import Volume (by Region), 2016
Distribution of China’s Carbon Fiber Prepreg Export Destinations (by Export Volume), 2016
China’s Other Carbon Fiber Products Export and Import Volume, 2010-2016
Average Price of China’s Other Carbon Fiber Products Exports and Imports, 2010-2016
Structure of China’s Other Carbon Fiber Products Import Volume (by Region), 2016
Structure of China’s Other Carbon Fiber Products Export Volume (by Region), 2016
Development Plan for Carbon Fiber Composites in “Made in China 2025”
Global Carbon Fiber Composites Market Size and Growth Rate, 2013-2021E
Structure of Global Carbon Fiber Composites Market Size by Region, 2015
Structure of High-performance Composites Market Size by Product, 2015
Structure of Carbon Fiber Composites Market Size by Substrate, 2015
Structure of Carbon Fiber Reinforced Polymer (CFRP) Market Size by Application, 2015
Structure of Carbon Fiber Reinforced Polymer (CFRP) Market Size by Region, 2015
Structure of Carbon Fiber Reinforced Polymer (CFRP) Output by Production Process, 2015
Cost Structure of Carbon Fiber Composites
Global Number of Patents about Carbon Fiber Composites, by 2015
Major Carbon Fiber Composites Producers in China
PN Carbon Fiber Precursor Preparation Routes of Global Mainstream Producers
Structure of Global Carbon Fiber Precursor Capacity by Country, 2016
Structure of China’s Carbon Fiber Precursor Capacity by Enterprise, 2016
Global Carbon Fiber Application Structure, 2013-2021E
History of Carbon Fiber Applied in Aerospace Field
Revenue Structure of Global Aerospace Market Segments, 2015
Market Share of Global Aeronautical Materials by Product, 2015
Market Share of Global Aeronautical Materials by Application, 2015
Application of Carbon Fiber Composites in Boeing 787 Dreamliner
A380 Fuselage Structure
B787 Fuselage Structure
Expansion of Major Global Carbon Fiber Producers in Aerospace Field
Structure of Carbon Fiber Composites Market Size in Global Aerospace Field, 2015
Demand Structure of Carbon Fiber Composites in Global Aerospace Field by Customer, 2016
Global Market Size of Carbon Fiber Composites for Aerospace and National Defense, 2013-2021E
Application of Carbon Fiber Composites in Automobiles
Examples of Lightweight CFRP Automotive Parts
Carbon Fiber Application Cases and Suppliers of Global Automakers
Expansion of Major Global Carbon Fiber Producers in Automobile Industry, 2011-2016
Application Proportion of Carbon Fiber in BMW’s Auto Parts
Capacity of BMW’s Carbon Fiber Plant, 2013-2016
Carbon-fiber Body Production Process of BMW i3
Carbon Fiber Consumption in Automotive Field Worldwide, 2020E
Cost Comparison between Carbon-fiber Cars and Steel Cars
Global Automotive Carbon Fiber Composites Market Size and Growth Rate, 2013-2021E
Manufacturing Process of and Application of CFRP Parts
Significant Improvement in Performance of PAN-based Carbon Fiber Mixed with Pitch-based Carbon Fiber
Carbon Fiber Blades
Application of Carbon Fiber in Wind Turbine Blades
Application Cases of Carbon Fiber Composites in Wind Turbines
Global Cumulative and New Wind Power Capacity, 2009-2021E
Global Installed Wind Power Capacity Structure by Region, 2014-2016
Global Market Size of Carbon Fiber Composites for Wind Power, 2013-2021E
Demand Structure of Carbon Fiber Composites in Global Sports & Leisure Market by Product, 2015
Global Market Size of Carbon Fiber Composites for Sports & Leisure, 2013-2021E
Global Layout of Toray
Global Business Development Course of Toray
Revenue and Net Income of Toray, FY2010-FY2016
Revenue Structure of Toray by Division, FY2014-FY2016
Revenue of Toray by Region, FY2014-FY2015
Net Sales and Operating Income of Toray's Carbon Fiber Division, FY2010-FY2016
Revenue Structure of Toray's Carbon Fiber Division by Application, FY2012-FY2015
Carbon Fiber Factories and Capacity of Toray, 2016
Carbon Fiber-related Investment Projects of Toray, FY2015-FY2016
Development of Toray's GR Projects
Toray’s Companies in China
Global Presence of Teijin
Revenue and Net Income of Teijin, FY2010-FY2016
Revenue Structure of Teijin by Division, FY2014-FY2016
Revenue and Operating Income of Teijin’s Advanced Fibers and Composites Division, FY2011-FY2015
Revenue Structure of Teijin by Region, FY2015
Carbon Fiber Companies under Teijin
Main Applications of Toho’s Carbon Fibers
Revenue and Net Income of Mitsubishi Chemical Holdings, FY2010-FY2016
Revenue Structure of Mitsubishi Chemical Holdings by Business, FY2014-FY2015
Basic Information of Mitsubishi Rayon
Carbon Fiber Companies under Mitsubishi Rayon
Main Applications of Mitsubishi Rayon’s Carbon Fibers
Development of Mitsubishi Rayon’s Carbon Fiber Business
Revenue and Net Income of Kureha, FY2010-FY2016
Revenue Structure of Kureha by Business, FY2013-FY2016
Revenue and Operating Income of Kureha’s Advanced Materials Division, FY2010-FY2016
Revenue from Main Products of Kureha’s Advanced Materials Division, FY2013-FY2016
Production Bases of Hexcel Worldwide
Revenue and Net Income of Hexcel, 2010-2015
Revenue Structure of Hexcel by Business, 2013-2015
Revenue Structure of Hexcel by Region, 2013-2015
Global Presence of Solvay
Revenue and Net Income of Solvay, 2010-2016
Revenue Structure of Solvay by Business, 2016
Revenue Structure of Solvay by Region, 2016
Revenue Structure of Solvay by Application, 2016
Production Bases of SGL Carbon Worldwide
Revenue and Net Income of SGL Carbon, 2010-2016
Revenue Structure of SGL Carbon by Business, 2014-2016
Revenue Structure of SGL Carbon by Region, 2013-2015
Revenue Structure of SGL Carbon by Consumption, 2014-2015
Revenue and EBITDA of SGL Carbon’s Carbon Fibers and Composites Division, 2013-2016
Revenue Structure of SGL Carbon’s Carbon Fibers and Composites Division by Business, 2014-2015
Revenue Structure of SGL Carbon’s Carbon Fibers and Composites Division by Market, 2014-2015
Business Divisions and Operating Business of Formosa Plastics
Revenue and Net Income of Formosa Plastics, 2010-2016
Revenue Structure of Formosa Plastics by Division, 2014-2015
Revenue and Average Price of Formosa Plastics’ Carbon Fiber, 2010-2015
Carbon Fiber Capacity, Output and Utilization of Formosa Plastics, 2010-2015
Carbon Fiber Sales Volume and Sales-Output Ratio of Formosa Plastics, 2010-2015
Global Presence of Hyosung
Operation of Hyosung, 2014-2015
Revenue and Net Income of Jiangsu Hengshen Fiber Material, 2013-2016
Revenue Structure of Jiangsu Hengshen Fiber Material by Product, 2013-2015
Revenue Structure of Jiangsu Hengshen Fiber Material by Region, 2015
Revenue from Top5 Customers and % of Total Revenue of Jiangsu Hengshen Fiber Material, 2013-2016
Revenue Contribution of Key Customers of Jiangsu Hengshen Fiber Material, 2015
Procurement from Top5 Suppliers and % of Total Procurement of Jiangsu Hengshen Fiber Material, 2013-2015
Procurement Breakdown of Key Suppliers of Jiangsu Hengshen Fiber Material, 2015
Revenue and Net Income of Jilin Tangu Carbon Fiber, 2013-2016
Revenue Breakdown of Jilin Tangu Carbon Fiber by Region, 2014-2015
Revenue Contribution of Key Customers of Jilin Tangu Carbon Fiber, 2015
Procurement Breakdown of Key Suppliers of Jilin Tangu Carbon Fiber, 2015
Carbon Fiber Precursor Technologies of Jilin Tangu Carbon Fiber
Carbon Fiber Precursor Sales Volume of Jilin Tangu Carbon Fiber, 2013-2016
Capacity Distribution of Fangda Carbon New Material by Product, 2015
Revenue and Net Income of Fangda Carbon New Material, 2010-2016
Revenue Structure of Fangda Carbon New Material by Product, 2010-2016
Revenue Structure of Fangda Carbon New Material by Region, 2010-2016
Gross Margin of Fangda Carbon New Material by Product, 2009-2016
R&D Costs and % of Total Revenue of Fangda Carbon New Material, 2011-2016
Revenue and Net Income of Jilin Fangda Jiangcheng Carbon Fiber, 2012-2016
Revenue and Net Income of Beijing Kangde Xin Composite Material, 2010-2016
Revenue Structure of Beijing Kangde Xin Composite Material by Product, 2013-2016
Revenue Structure of Beijing Kangde Xin Composite Material by Region, 2010-2016
Gross Margin of Beijing Kangde Xin Composite Material, 2011-2016
R&D Costs and % of Total Revenue of Beijing Kangde Xin Composite Material, 2011-2016
Revenue and Net Income of Jilin Carbon, 2010-2016
Revenue Structure of Jilin Carbon by Product, 2015
Net Income of Kingfa Carbon Fiber Materials, 2013-2016
Revenue and Net Income of Jiyan High-tech Fibers, 2014-2016
Revenue Structure of Jiangsu Tianniao High Technology by Business, 2015
如果这份报告不能满足您的要求,我们还可以为您定制报告,请 留言说明您的详细需求。
|