|
|
|
报告导航:研究报告—
生命科学—生物科技
|
|
2017-2021年中国血液制品行业研究报告 |
 |
字数:4.5万 |
页数:131 |
图表数:164 |
|
中文电子版:9500元 |
中文纸版:4750元 |
中文(电子+纸)版:10000元 |
|
英文电子版:2700美元 |
英文纸版:2900美元 |
英文(电子+纸)版:3000美元 |
|
编号:ZLC048
|
发布日期:2017-04 |
附件:下载 |
 |
|
|
在2015年血液制品限价政策放开,中国血液制品价格不同程度上升,以及血液制品批签发量增长的推动下,2016年中国血液制品市场规模迅速增长,全年估计达238亿元,同比增长16.7%。
未来,在下游需求的推动下,浆站数量稳步增长以及血浆综合利润率提高,中国血液制品行业将迎来飞速发展期。预计到2021年市场规模有望达到475亿元。
2016年,中国血液制品行业主要表现出以下几个特点:
一、血浆供应增长,2025年有望实现供需平衡
近几年,受血液制品价格管制放开、血浆站新设加速推动,中国采浆量呈逐年增长趋势。2016年,中国采浆量达6964吨,同比增长达19.8%。尽管采浆量持续增长,但依然无法满足日益增长的市场需求。未来,在单采血浆站数量增长的推动下,中国采浆量将快速增长,预计到2025年将实现血浆供需平衡。
二、主要产品批签发量稳步增长
目前,中国血液制品仍以白蛋白和静注人免疫球蛋白为主,二者占血液制品市场70%以上的市场份额。2016年人血白蛋白和静注人免疫球蛋白(ph4)两大血液制品批签发量分别达3931万瓶(按10g计)和1089万瓶(按2.5g计),分别同比增长17.8%和27.4%。
除了此之外,凝血因子Ⅷ、人免疫球蛋白、人凝血酶原复合物等国内紧缺血液制品批签发量在2016年也实现大幅增长,增速分别为38.0%、143.8%和20%。
三、新产品研发力度加大,血浆综合利用率有望提升
目前,中国血液制品企业最多可从血浆中分离11个品种的血液制品,一般企业仅可分离3-4个品种,血浆综合利用率极低。为解决这一问题,中国血液制品企业加速新品研发,以期提高血浆综合利用率。
以凝血因子Ⅷ为例,目前包括贵州泰邦、博雅生物、天坛生物、振兴生化、中原瑞德在内的血液制品企业正在积极开展凝血因子Ⅷ的临床试验,预计未来两年可实现量产。
四、行业内占浆为王格局仍将继续
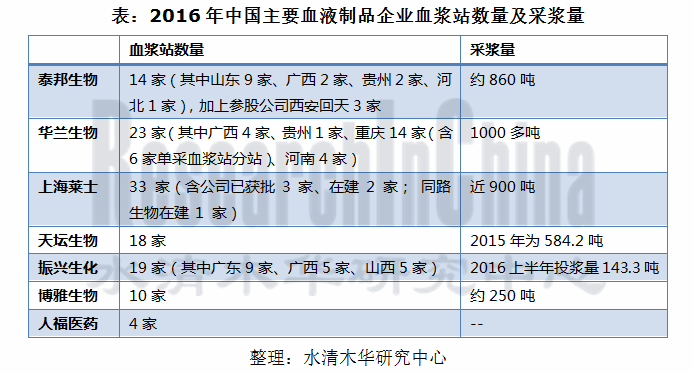
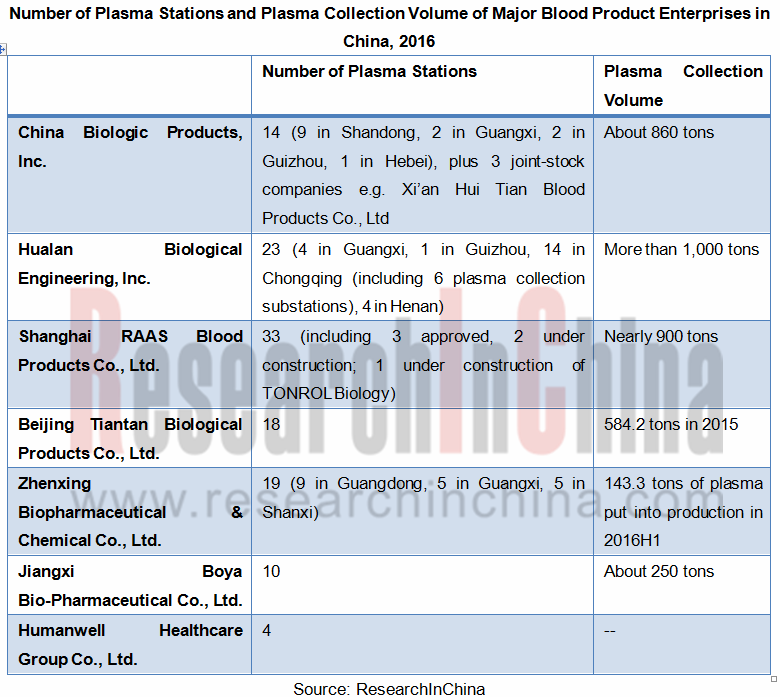
血液制品行业是一个对血浆原料依赖性很大的行业,浆站数量的多少直接影响采浆量的多少,采浆量的多少又直接影响血液制品企业的原料供应。因此,采浆量和浆站数量将决定企业在行业的地位。
目前,中国共有30多家血液制品生产企业,但能维持正常生产的仅20余家。其中以华兰生物、上海莱士和泰邦生物的采浆量相对更高,三者2016年采浆量合计约占总采浆量的39.6%。
《2017-2021年中国血液制品行业研究报告》主要包括以下内容:
 中国血液制品行业发展概况分析,包括发展现状、政策环境、市场供需、市场规模、市场结构及竞争格局分析; 中国血液制品行业发展概况分析,包括发展现状、政策环境、市场供需、市场规模、市场结构及竞争格局分析;
中国血液制品行业8大细分市场分析,包括发展现状、竞争格局以及发展前景分析;
13家主要企业分析,包括经营情况分析、血液制品业务分析等;
总结预测及发展趋势分析。
China’s blood product market size mushroomed in 2016 under the impetus of liberalization of limited-price policy, price rises in varying degrees and lot release volume growth for blood products in 2015, estimated to reach RMB23.8 billion throughout the year, up 16.7% from 2015.
China’s blood product industry will develop at full speed boosted by downstream demand, accompanied by a steady rise in the number of plasma stations and consolidated profit margin improvement of plasma. The market size is expected to hit RMB47.5 billion in 2021.
Main features of blood product industry in China 2016 are shown as below:
1. As plasma supply increases, supply-demand balance can be seen in 2025
China’s plasma collection volume has been increasing over recent years driven by blood product price deregulation and accelerated establishment of new plasma stations. In 2016, 6,964 tons of plasma was collected in China, up 19.8% year on year. Despite continuous growth, plasma collection volume still cannot meet the ever-increasing market demand. In the future, China will see plasma collection volume shooting up propelled by a growing number of plasma collection stations and is expected to achieve balance between plasma supply and demand in 2025.
2. A steady increase in lot release volume of main products
So far, Chinese blood products are still dominated by human albumin and human immunoglobulin for intravenous injection, which take an over 70% blood product market share. In 2016, human albumin and human immunoglobulin (pH4) for intravenous injection registered respective lot release volumes of 39.31 million bottles (10g/bottle) and 10.89 million bottles (2.5g/bottle), up 17.8% and 27.4% respectively year on year.
In addition, lot release volumes of domestic blood products in short supply such as blood coagulation factor VIII, human immunoglobulin and human prothrombin complex also witnessed substantial growth in 2016, respectively 38.0%, 143.8% and 20%.
3. R&D efforts intensified for new products; comprehensive utilization of plasma to be raised
At present, Chinese blood product enterprises can separate a maximum of 11 varieties of blood products from the plasma, 3-4 varieties for general firms, indicating an extremely low rate of comprehensive utilization of plasmas. To solve the problem, Chinese blood product enterprises are accelerating the development of new products, hoping to improve comprehensive utilization of plasma.
Blood coagulation factor VIII, for example, Guizhou Taibang Biological Products Co., Ltd., Jiangxi Boya Bio-Pharmaceutical Co., Ltd., Beijing Tiantan Biological Products Co., Ltd., Zhenxing Biopharmaceutical & Chemical Co., Ltd., Wuhan Zhongyuan Ruide Biological Products Co., Ltd. etc. are actively conducting clinical trials of blood coagulation factor VIII and expected to achieve mass production in next two years.
4 Plasma-oriented pattern continues
Blood product industry relies heavily on plasma materials – the number of plasma stations directly influences plasma collection volume, which then affects raw material supply of blood product enterprises. Therefore, the number of plasma stations and plasma collection volume determine corporate position in industry.
There are over 30 blood product manufacturing enterprises in China, but only more than 20 are able to maintain normal production. Among them, Hualan Biological Engineering,Inc., Shanghai RAAS Blood Products Co., Ltd. and China Biologic Products, Inc. boast relatively high volume of plasma collection, altogether accounting for 39.6% of total plasma collections in 2016.
The report highlights the following:
 Analysis on development of China blood product industry, including status quo, policy environment, market supply & demand, market size, market structure and competition pattern; Analysis on development of China blood product industry, including status quo, policy environment, market supply & demand, market size, market structure and competition pattern;
Analysis on 8 market segments of China blood product industry, including development status, competition pattern and trends;
Analysis on 13 major enterprises, including operation, blood product business, etc.;
Summary & forecast and trends.
第一章 概述
1.1 血液制品定义
1.2 血液制品分类
1.3 重组血液制品
1.4 血液制品产业链
1.5 血液制品特点
第二章 中国血液制品行业发展概况
2.1 发展现状
2.2 政策环境
2.3 市场供需
2.3.1 市场供应
2.3.2 市场需求
2.4 市场规模
2.5 市场结构
2.6 竞争格局
第三章 中国血液制品行业细分市场分析
3.1 人血白蛋白
3.1.1 发展现状
3.1.2 竞争格局
3.1.3 发展前景
3.2 静注人免疫球蛋白(ph4)
3.2.1 发展现状
3.2.2 竞争格局
3.2.3 发展前景
3.3 凝血因子Ⅷ
3.3.1 发展现状
3.3.2 竞争格局
3.3.3 发展前景
3.4 乙肝免疫球蛋白
3.4.1 发展现状
3.4.2 竞争格局
3.5 人免疫球蛋白
3.5.1 发展现状
3.5.2 竞争格局
3.6 人凝血酶原复合物
3.6.1 发展现状
3.6.2 竞争格局
3.7 破伤风免疫球蛋白
3.7.1 发展现状
3.7.2 竞争格局
3.8 狂犬病人免疫球蛋白
3.8.1 发展现状
3.8.2 竞争格局
第四章 主要企业
4.1 泰邦生物集团公司
4.1.1 公司简介
4.1.2 经营情况
4.1.3 营收构成
4.1.4 毛利率
4.1.5 研发与投资
4.1.6 山东泰邦生物制品有限公司
4.1.7 贵州泰邦生物制品有限公司
4.1.8 西安回天血液制品有限责任公司
4.1.9 发展及预测
4.2 华兰生物工程股份有限公司
4.2.1 公司简介
4.2.2 经营情况
4.2.3 营收构成
4.2.4 毛利率
4.2.5 研发与投资
4.2.6 客户情况
4.2.7 血液制品业务
4.2.8 发展及预测
4.3 上海莱士
4.3.1 公司简介
4.3.2 经营情况
4.3.3 营收构成
4.3.4 毛利率
4.3.5 研发与投资
4.3.6 客户情况
4.3.7 血液制品业务
4.3.8 发展及预测
4.4 天坛生物
4.4.1 公司简介
4.4.2 经营情况
4.4.3 营收构成
4.4.4 毛利率
4.4.5 研发与投资
4.4.6 客户情况
4.4.7 血液制品业务
4.4.8 发展及预测
4.5 振兴生化
4.5.1 公司简介
4.5.2 经营情况
4.5.3 营收构成
4.5.4 毛利率
4.5.5 主要客户
4.5.6 研发与投资
4.5.7 血液制品业务
4.5.8 发展及预测
4.6 博雅生物
4.6.1 公司简介
4.6.2 经营情况
4.6.3 营收构成
4.6.4 毛利率
4.6.5 研发与投资
4.6.6 主要客户
4.6.7 血液制品业务
4.6.8 发展及预测
4.7 人福医药
4.7.1 公司简介
4.7.2 经营情况
4.7.3 营收构成
4.7.4 毛利率
4.7.5 研发与投资
4.7.6 血液制品业务
4.7.7 发展及预测
4.8 蜀阳药业
4.8.1 公司简介
4.8.2 血液制品业务
4.9 上海生物制品研究所
4.9.1 公司简介
4.9.2 血液制品业务
4.10 山西康宝生物制品股份有限公司
4.10.1 公司简介
4.10.2 血液制品业务
4.11 绿十字(中国)生物制品有限公司
4.11.1 公司简介
4.11.2 血液制品业务
4.12 沃森生物
4.12.1 公司简介
4.12.2 经营情况
4.12.3 血液制品业务
4.13 深圳卫光生物
4.13.1 公司简介
4.13.2 经营情况
4.13.3 营收构成
4.13.4 毛利率
4.13.5 主要客户
4.13.6 研发与投资
4.13.7 血液制品业务
第五章 总结与预测
5.1 总结预测
5.2 发展趋势
5.2.1 政策鼓励行业发展
5.2.2 行业整合加快,集中度进一步提升
5.2.3 供需缺口和产品消费结构改善利好行业发展
5.2.4 采浆量和浆站数量决定行业地位
5.2.5 血浆综合利用率提升
1 Overview of Blood Products
1.1 Definition
1.2 Classification
1.3 Recombinant Blood Products
1.4 Industry Chain
1.5 Features
2 Development of China Blood Product Industry
2.1 Status Quo
2.2 Policy Environment
2.3 Market Supply and Demand
2.3.1 Supply
2.3.2 Demand
2.4 Market Size
2.5 Market Structure
2.6 Competition Pattern
3 Market Segments of China Blood Product Industry
3.1 Human Albumin
3.1.1 Development Status
3.1.2 Competition Pattern
3.1.3 Prospects
3.2 Human Immunoglobulin (pH4) for Intravenous Injection
3.2.1 Development Status
3.2.2 Competition Pattern
3.2.3 Prospects
3.3 Blood Coagulation Factor VIII
3.3.1 Development Status
3.3.2 Competition Pattern
3.3.3 Prospects
3.4 Hepatitis B Immunoglobulin
3.4.1 Development Status
3.4.2 Competition Pattern
3.5 Human Immunoglobulin
3.5.1 Development Status
3.5.2 Competition Pattern
3.6 Human Prothrombin Complex
3.6.1 Development Status
3.6.2 Competition Pattern
3.7 Tetanus Immunoglobulin
3.7.1 Development Status
3.7.2 Competition Pattern
3.8 Human Rabies Immunoglobulin
3.8.1 Development Status
3.8.2 Competition Pattern
4 Major Enterprises
4.1 China Biologic Products, Inc. (NASDAQ: CBPO)
4.1.1 Profile
4.1.2 Operation
4.1.3 Revenue Structure
4.1.4 Gross Margin
4.1.5 R&D and Investment
4.1.6 Shandong Taibang Biological Products Co., Ltd.
4.1.7 Guizhou Taibang Biological Products Co., Ltd.
4.1.8 Xi'an Huitian Blood Products Co., Ltd.
4.1.9 Development and Forecast
4.2 Hualan Biological Engineering,Inc.
4.2.1 Profile
4.2.2 Operation
4.2.3 Revenue Structure
4.2.4 Gross Margin
4.2.5 R&D and Investment
4.2.6 Customer
4.2.7 Blood Product Business
4.2.8 Development and Forecast
4.3 Shanghai RAAS Blood Products Co., Ltd.
4.3.1 Profile
4.3.2 Operation
4.3.3 Revenue Structure
4.3.4 Gross Margin
4.3.5 R&D and Investment
4.3.6 Customer
4.3.7 Blood Product Business
4.3.8 Development and Forecast
4.4 Beijing Tiantan Biological Products Co., Ltd. (TIANTANBIO)
4.4.1 Profile
4.4.2 Operation
4.4.3 Revenue Structure
4.4.4 Gross Margin
4.4.5 R&D and Investment
4.4.6 Customer
4.4.7 Blood Product Business
4.4.8 Development and Forecast
4.5 Zhenxing Biopharmaceutical & Chemical Co., Ltd.
4.5.1 Profile
4.5.2 Operation
4.5.3 Revenue Structure
4.5.4 Gross Margin
4.5.5 Customer
4.5.6 R&D and Investment
4.5.7 Blood Product Business
4.5.8 Development and Forecast
4.6 Jiangxi Boya Bio-Pharmaceutical Co., Ltd.
4.6.1 Profile
4.6.2 Operation
4.6.3 Revenue Structure
4.6.4 Gross Margin
4.6.5 R&D and Investment
4.6.6 Customer
4.6.7 Blood Product Business
4.6.8 Development and Forecast
4.7 Humanwell Healthcare Group Co., Ltd.
4.7.1 Profile
4.7.2 Operation
4.7.3 Revenue Structure
4.7.4 Gross Margin
4.7.5 R&D and Investment
4.7.6 Blood Product Business
4.7.7 Development and Forecast
4.8 Sichuan Yuanda Shuyang Pharmaceutical Co., Ltd.
4.8.1 Profile
4.8.2 Blood Product Business
4.9 Shanghai Institute of Biological Products Co., Ltd.
4.9.1 Profile
4.9.2 Blood Product Business
4.10 Shanxi Kangbao Biological Product Co., Ltd.
4.10.1 Profile
4.10.2 Blood Product Business
4.11 Green Cross China
4.11.1 Profile
4.11.2 Blood Product Business
4.12 Walvax Biotechnology Co, Ltd.
4.12.1 Profile
4.12.2 Operation
4.12.3 Blood Product Business
4.13 Shenzhen Weiguang Biological Products Co., Ltd.
4.13.1 Profile
4.13.2 Operation
4.13.3 Revenue Structure
4.13.4 Gross Margin
4.13.5 Customer
4.13.6 R&D and Investment
4.13.7 Blood Product Business
5 Summary and Forecast
5.1 Summary and Forecast
5.2 Trends
5.2.1 Policies Encourage Industrial Development
5.2.2 Industrial Consolidation Accelerates, Concentration Further Enhances
5.2.3 Demand-Supply Gap and Product Consumption Structure Improvement are Beneficial to Industrial Development
5.2.4 Plasma Collection Volume and Number of Plasma Stations Determine Position in Industry
5.2.5 Comprehensive Utilization of Plasma Increases
图:血液的基本组成
图:血浆蛋白分离程序
表:血液制品的分类及作用
表:基因重组类血制品与传统血制品对比
表:国内外重组血液制品产品种类及对比
图:血液制品产业链
图:血浆采集与分离的生产工艺耗时
图:血液制品企业与化学制药企业运营成本及费用对比
图:血液制品生产销售周期
表:中国血液制品行业发展历程
表:2014-2016年中国主要血液制品批签发量
表:1989-2016年中国血液制品主要政策
表:中国与欧美国家人均献浆频率及采浆量对比
表:中美采浆现状对比
表:2015年中国与美国公众献浆接受度对比
图:2008-2016年中国采浆量及同比增长率
图:2008-2016年中国单采血浆站数量及同比增长率
表:2014-2016年中国血液制品主要企业浆站获批情况
图:2015-2025年中国血浆供需对比
表:中国主要血液制品价格变化
图:2010-2016年中国血液制品行业市场规模
表:2014-2016年中国血液制品产品结构(按批签发量计)
表:2016年中国主要血液制品企业血浆站数量及投浆量
表:中国主要血液制品生产企业主要产品
图:2013-2016年中国主要血液制品企业营业收入
图:2013-2016年中国主要血液制品企业净利润
图:2013-2016年中国主要血液制品企业研发支出
图:2013-2016年中国主要血液制品企业血液制品业务收入对比
图:2016年中国血液制品行业市场份额(分企业)
图:2015年中国血液制品行业市场份额(分企业)
图:2010-2016年中国人血白蛋白批签发量及同比增长率
图:2007-2016年中国人血白蛋白国产与进品比例(按批签发量计)
图:2016年中国人血白蛋白市场份额(按批签发量)
图:2013-2016年中国人血白蛋白主要企业人血白蛋白销售收入
图:2010-2016年中国静注人免疫球蛋白批签发量
图:2016年中国静丙(ph4)市场份额(按批签发量)
图:2013-2016年中国静丙(ph4)主要企业静丙(ph4)销售收入
图:2010-2016年中国凝血因子Ⅷ批签发量
图:2016年中国凝血因子Ⅷ市场份额(按批签发量)
图:2010-2016年中国乙肝免疫球蛋白批签发量
图:2016年中国乙肝免疫球蛋白市场份额(按批签发量)
图:2010-2016年中国人免疫球蛋白批签发量
图:2016年中国人免疫球蛋白市场份额(按批签发量)
图:2010-2016年中国人凝血酶原复合物批签发量
图:2016中国人凝血酶原复合物市场份额(按批签发量)
图:2010-2016年中国破伤风免疫球蛋白批签发量
图:2016年中国破伤风免疫球蛋白市场份额(按批签发量)
图:2010-2016年中国狂犬病人免疫球蛋白批签发量
图:2010-2016年中国狂犬病疫苗批签发量
图:2016年中国狂犬病人免疫球蛋白市场份额(按批签发量)
表:CBPO产品线
图:2016年CBPO股权结构
图:2011-2016年CBPO营业收入及营业利润
表:2015-2016年CBPO血液制品批签发量
图:2011-2016年CBPO营业收入(分产品)
图:2011-2016年CBPO营业收入构成(分产品)
图:2016年CBPO市场份额(分产品)
图:2011-2016年CBPO毛利率
图:2011-2016年CBPO研发投入及占总营收比重
图:截至2016年底CBPO在研产品及研发进度
表:山东泰邦股权结构
表:截至2017年3月山东泰邦主要单采血浆站
表:截至2017年3月贵州泰邦主要单采血浆站
表:西安回天股权结构
表:2008-2014年西安回天血液制品批签发量
表:截至2017年3月西安回天主要单采血浆站
图:2016-2021年CBPO营业收入及净利润
图:2013-2016年华兰生物营业收入及净利润
图:2013-2016年华兰生物营业收入(分产品)
图:2013-2016年华兰生物营业收入构成(分产品)
图:2013-2016年华兰生物血液制品毛利率(分产品)
图:2013-2016年华兰生物研发支出及占总营收比重
图:2013-2016年华兰生物前五名客户合计销售金额及占销售总额比重
表:华兰生物血液制品各类及规格
图:2013-2016年华兰生物血液制品产销及库存量
图:2013-2016年华兰生物血液制品营业收入
表:2015-2016年华兰生物血液制品批签发量
图:2016-2021E华兰生物营业收入及净利润
图:2013-2016年上海莱士营业收入及净利润
表:2013-2016年上海莱士营业收入(分产品)
图:2013-2016年上海莱士营业收入(分地区)
图:2013-2016年上海莱士营业收入构成(分地区)
图:2013-2016年上海莱士毛利率(分产品)
图:2013-2016年上海莱士研发投入
图:2013-2016年上海莱士前五名客户销售额及占总销售额比重
表:上海莱士及下属子公司可生产的血液制品
图:2013-2016年上海莱士血液制品产销及库存量
表:2015-2016年上海莱士血液制品批签发量
图:2016-2021E上海莱士营业收入及净利润
图:2013-2016年天坛生物营业收入及净利润
图:2013-2016年天坛生物营业收入(分产品)
图:2013-2016年天坛生物营业收入构成(分产品)
图:2013-2016年天坛生物营业收入(分地区)
图:2013-2016年天坛生物营业收入构成(分地区)
图:2013-2016年天坛生物毛利率(分产品)
图:2013-2016年天坛生物研发支出及占总营收比重
表:截至2015年底天坛生物主要研发项目基本情况
图:2012-2015年天坛生物前五名客户销售收入及占总营收比重
表:截至2017年3月成都蓉生主要单采血浆站
图:2015-2016年天坛生物主要血液制品批签发量
图:2016-2021E天坛生物营业收入及净利润
图:2013-2016年振兴生化营业收入及净利润
图:2013-2016年振兴生化营业收入(分产品)
图:2013-2016年振兴生化营业收入构成(分产品)
图:2013-2016年振兴生化毛利率
表:2013-2015年振兴生化前五名客户销售额
表:截至2015年底振兴生化各项目研发进展情况
图:2013-2016年振兴生化研发支出及占总营收比重
表:2016年振兴生化非公开发行A股股票募集资金用途
表:截至2017年3月双林生物单采血浆站分布
图:2010-2016年双林生物投浆量
图:2013-2015年振兴生物血液制品产销及库存量
表:2015-2016年振兴生化血液制品批签发量
图:2016-2021E振兴生化营业收入及净利润
图:2013-2016年博雅生物营业收入及净利润
图:2013-2016年博雅生物营业收入(分业务)
图:2013-2016年博雅生物营业收入构成(分业务)
表:2015-2016年博雅生物营业收入(分产品)
表:2015-2016年博雅生物营业收入(分地区)
图:2013-2016年博雅生物毛利率(分业务)
图:2013-2016年博雅生物主要产品毛利率
图:2013-2016年博雅生物研发支出
表:2017年博雅生物新获专利情况
图:2013-2016年博雅生物前五名客户销售金额
图:2013-2016年博雅生物血液制品销售额及占总营收比重
表:2015-2016年博雅生物血液制品批签发量
图:2016-2021E博雅生物营业收入及净利润
图:2013-2016年人福医药营业收入及净利润
图:2014-2016年人福医药营业收入(分产品)
图:2014-2016年人福医药营业收入构成(分产品)
图:2014-2016年人福医药毛利率(分产品)
图:2013-2016年人福医药研发支出及占总营收比重
图:2014-2016年人福医药血液制品营业收入及占总营收比重
表:2014-2016年中原瑞德财务数据
图:2016-2021E人福医药营业收入及净利润
图:蜀阳药业发展历程
表:蜀阳药业血液制品及规格
表:截至2017年3月蜀阳药业血浆站分布
表:截至2017年3月上海所单采血浆站分布
表:上海所主要血液制品产品及规格
表:截至2017年3月康宝生物主要单采血浆站
表:截至2017年3月绿十字中国单采血浆站分布
表:绿十字中国主要血液制品产品规格
图:2013-2016年沃森生物营业收入及利润总额
表:2015-2016年大安制药财务指标
表:截至2017年3月大安制药主要单采血浆站
表:2016年广东卫伦财务指标
表:截至2017年3月广东卫伦单采血浆站分布
表:2012-2015年深圳卫光营业收入和营业利润
表:2012-2015年深圳卫光(分产品)产能、产销量
表:2012-2015年深圳卫光(分产品)收入及占比(单位:百万元
表:2012-2015年深圳卫光(分产品)收入及占比
表:2012-2015年深圳卫光(分产品)毛利率
表:2012-2015年深圳卫光前五客户名称、收入贡献及占比
图:2012-2015年深圳卫光研发投入及占营业收入比重
表:截止2015年底深圳卫光部分在研产品及进度
表:深圳卫光募投项目
表:截至2017年3月深圳卫光单采血浆站分布
图:深圳卫光主要产品
表:深圳卫光血液制品产品及规格
表:2012-2015年深圳卫光采浆量和投浆量
图:2016-2021E中国血液制品行业市场规模
表:国外血液制品巨头并购案例
表:2008-2016年中国血液制品行业并购案例
Basic Components of Blood
Separation Procedure of Plasma Proteins
Classification and Function of Blood Products
Comparison of Gene Recombinant Blood Products and Traditional Blood Products
Types and Comparison of Domestic and Foreign Blood Products
Blood Product Industry Chain
Time Consumption of Plasma Collection and Separation Process
Comparison of Blood Product Enterprises and Chemical & Pharmaceutical Enterprises in Operating Costs and Expenses
Production & Sales Cycle of Blood Products
Development History of China Blood Product Industry
Lot Release Volume of Major Blood Products in China, 2014-2016
Main Policies on China Blood Product Industry, 1989-2016
Per Capita Frequency of Plasma Donation and Plasma Collection Volume in China vs. Occident
Plasma Collection in China vs. USA
Public Acceptance of Plasma Donation in China vs. USA, 2015
Plasma Collection Volume and YoY Growth Rate in China, 2008-2016
Number of Plasma Collection Stations and YoY Growth Rate in China, 2008-2016
Plasma Station Approval of Major Blood Product Enterprises in China, 2014-2016
Plasma Supply and Demand in China, 2015-2025E
Blood Product Price Changes in China
Market Size of China Blood Product Industry, 2010-2016
Blood Product Structure in China (by Lot Release Volume), 2014-2016
Number of Plasma Stations and Production-use Plasma Volume of Major Blood Product Enterprises in China, 2016
Main Products of Major Blood Product Manufacturing Enterprises in China
Revenue of Major Blood Product Enterprises in China, 2013-2016
Net Income of Major Blood Product Enterprises in China, 2013-2016
R&D Expenditures of Major Blood Product Enterprises in China, 2013-2016
Comparison of Blood Product Revenue between Major Blood Product Enterprises in China, 2013-2016
Market Share of China Blood Product Industry (by Enterprise), 2016
Market Share of China Blood Product Industry (by Enterprise), 2015
Lot Release Volume and YoY Growth Rate of Human Albumin in China, 2010-2016
Proportion of Domestic and Imported Human Albumin in China (by Lot Release Volume), 2007-2016
Market Share of Human Albumin in China (by Lot Release Volume), 2016
Human Albumin Sales of Major Human Albumin Enterprises in China, 2013-2016
Lot Release Volume of Human Immunoglobulin for Intravenous Injection in China, 2010-2016
Market Share of Human Immunoglobulin (pH4) for Intravenous Injection in China (by Lot Release Volume), 2016
Human Immunoglobulin (pH4) for Intravenous Injection Sales of Major Human Immunoglobulin (pH4) for Intravenous Injection Enterprises in China, 2013-2016
Lot Release Volume of Blood Coagulation Factor VIII in China, 2010-2016
Market Share of Blood Coagulation Factor VIII in China (by Lot Release Volume), 2016
Lot Release Volume of Hepatitis B Immunoglobulin in China, 2010-2016
Market Share of Hepatitis B Immunoglobulin in China (by Lot Release Volume), 2016
Lot Release Volume of Human Immunoglobulin in China, 2010-2016
Market Share of Human Immunoglobulin in China (by Lot Release Volume), 2016
Lot Release Volume of Human Prothrombin Complex in China, 2010-2016
Market Share of Human Prothrombin Complex in China (by Lot Release Volume), 2016
Lot Release Volume of Tetanus Immunoglobulin in China, 2010-2016
Market Share of Tetanus Immunoglobulin in China (by Lot Release Volume), 2016
Lot Release Volume of Human Rabies Immunoglobulin in China, 2010-2016
Lot Release Volume of Rabies Vaccine in China, 2010-2016
Market Share of Human Rabies Immunoglobulin in China (by Lot Release Volume), 2016
Product Line of CBPO
Ownership Structure of CBPO, 2016
Revenue and Operating Income of CBPO, 2011-2016
Lot Release Volume of Blood Products of CBPO, 2015-2016
Revenue Breakdown of CBPO (by Product), 2011-2016
Revenue Structure of CBPO (by Product), 2011-2016
Market Share of CBPO (by Product), 2016
Gross Margin of CBPO, 2011-2016
R&D Costs and % of Total Revenue of CBPO, 2011-2016
CBPO’s Products under Research and R&D Process by the end of 2016
Ownership Structure of Shandong Taibang Biological Products
Main Plasma Collection Stations of Shandong Taibang Biological Products as of Mar 2017
Main Plasma Collection Stations of Guizhou Taibang Biological Products as of Mar 2017
Ownership Structure of Xi'an Huitian Blood Products
Lot Release Volume of Blood Products of Xi'an Huitian Blood Products, 2008-2014
Main Plasma Collection Stations of Xi'an Huitian Blood Products as of Mar 2017
Revenue and Net Income of CBPO, 2016-2021E
Revenue and Net Income of Hualan Biological Engineering, 2013-2016
Revenue Breakdown of Hualan Biological Engineering (by Product), 2013-2016
Revenue Structure of Hualan Biological Engineering (by Product), 2013-2016
Gross Margin of Blood Products of Hualan Biological Engineering (by Product), 2013-2016
R&D Costs and % of Total Revenue of Hualan Biological Engineering, 2013-2016
Hualan Biological Engineering’s Sales from Top 5 Customers and % of Total Sales, 2013-2016
Category and Specification of Blood Products of Hualan Biological Engineering
Output, Sales Volume and Inventory of Blood Products of Hualan Biological Engineering, 2013-2016
Revenue of Blood Products of Hualan Biological Engineering, 2013-2016
Lot Release Volume of Blood Products of Hualan Biological Engineering, 2015-2016
Revenue and Net Income of Hualan Biological Engineering, 2016-2021E
Revenue and Net Income of Shanghai RAAS Blood Products, 2013-2016
Revenue Breakdown of Shanghai RAAS Blood Products (by Product), 2013-2016
Revenue Breakdown of Shanghai RAAS Blood Products (by Region), 2013-2016
Revenue Structure of Shanghai RAAS Blood Products (by Region), 2013-2016
Gross Margin of Shanghai RAAS Blood Products (by Product), 2013-2016
R&D Costs of Shanghai RAAS Blood Products, 2013-2016
Shanghai RAAS Blood Products’ Sales from Top 5 Customers and % of Total Sales, 2013-2016
Blood Products of Shanghai RAAS Blood Products and Its Subsidiaries
Output, Sales Volume and Inventory of Blood Products of Shanghai RAAS Blood Products, 2013-2016
Lot Release Volume of Blood Products of Shanghai RAAS Blood Products, 2015-2016
Revenue and Net Income of Shanghai RAAS Blood Products, 2016-2021E
Revenue and Net Income of TIANTANBIO, 2013-2016
Revenue Breakdown of TIANTANBIO (by Product), 2013-2016
Revenue Structure of TIANTANBIO (by Product), 2013-2016
Revenue Breakdown of TIANTANBIO (by Region), 2013-2016
Revenue Structure of TIANTANBIO (by Region), 2013-2016
Gross Margin of TIANTANBIO (by Product), 2013-2016
R&D Costs and % of Total Revenue of TIANTANBIO, 2013-2016
Basic Situation of Major R&D Projects of TIANTANBIO by the End of 2015
TIANTANBIO’s Sales from Top 5 Customers and % of Total Revenue, 2012-2015
Main Plasma Collection Stations of Chengdu Rongsheng Pharmaceuticals as of Mar 2017
Lot Release Volume of Main Blood Products of TIANTANBIO, 2015-2016
Revenue and Net Income of TIANTANBIO, 2016-2021E
Revenue and Net Income of Zhenxing Biopharmaceutical & Chemical, 2013-2016
Revenue Breakdown of Zhenxing Biopharmaceutical & Chemical (by Product), 2013-2016
Revenue Structure of Zhenxing Biopharmaceutical & Chemical (by Product), 2013-2016
Gross Margin of Zhenxing Biopharmaceutical & Chemical, 2013-2016
Zhenxing Biopharmaceutical & Chemical’s Sales from Top 5 Customers, 2013-2015
R&D Progress of Projects of Zhenxing Biopharmaceutical & Chemical by the End of 2015
R&D Costs and % of Total Revenue of Zhenxing Biopharmaceutical & Chemical, 2013-2016
Use of Funds Raised by Zhenxing Biopharmaceutical & Chemical through Private Issuing of A Shares, 2016
Distribution of Plasma Collection Stations of Guangdong Shuanglin Bio-Pharmacy as of Mar 2017
Production-use Plasma Volume of Guangdong Shuanglin Bio-Pharmacy, 2010-2016
Output, Sales Volume and Inventory of Blood Products of Zhenxing Biopharmaceutical & Chemical, 2013-2015
Lot Release Volume of Blood Products of Zhenxing Biopharmaceutical & Chemical, 2015-2016
Revenue and Net Income of Zhenxing Biopharmaceutical & Chemical, 2016-2021E
Revenue and Net Income of Jiangxi Boya Bio-Pharmaceutical, 2013-2016
Revenue Breakdown of Jiangxi Boya Bio-Pharmaceutical (by Business), 2013-2016
Revenue Structure of Jiangxi Boya Bio-Pharmaceutical (by Business), 2013-2016
Revenue Breakdown of Jiangxi Boya Bio-Pharmaceutical (by Product), 2015-2016
Revenue Breakdown of Jiangxi Boya Bio-Pharmaceutical (by Region), 2015-2016
Gross Margin of Jiangxi Boya Bio-Pharmaceutical (by Business), 2013-2016
Gross Margin of Main Products of Jiangxi Boya Bio-Pharmaceutical, 2013-2016
R&D Costs of Jiangxi Boya Bio-Pharmaceutical, 2013-2016
New Patents of Jiangxi Boya Bio-Pharmaceutical, 2017
Jiangxi Boya Bio-Pharmaceutical’s Sales from Top 5 Customers, 2013-2016
Jiangxi Boya Bio-Pharmaceutical’s Sales from Blood Products and % of Total Revenue, 2013-2016
Lot Release Volume of Blood Products of Jiangxi Boya Bio-Pharmaceutical, 2015-2016
Revenue and Net Income of Jiangxi Boya Bio-Pharmaceutical, 2016-2021E
Revenue and Net Income of Humanwell Healthcare Group, 2013-2016
Revenue Breakdown of Humanwell Healthcare Group (by Product), 2014-2016
Revenue Structure of Humanwell Healthcare Group (by Product), 2014-2016
Gross Margin of Humanwell Healthcare Group (by Product), 2014-2016
R&D Costs and % of Total Revenue of Humanwell Healthcare Group, 2013-2016
Humanwell Healthcare Group’s Revenue from Blood Products and % of Total Revenue, 2014-2016
Financial Data of Wuhan Zhongyuan Ruide Biological Products, 2014-2016
Revenue and Net Income of Humanwell Healthcare Group, 2016-2021E
Development History of Sichuan Yuanda Shuyang Pharmaceutical
Specification of Blood Products of Sichuan Yuanda Shuyang Pharmaceutical
Distribution of Plasma Stations of Sichuan Yuanda Shuyang Pharmaceutical as of Mar 2017
Distribution of Plasma Collection Stations of Shanghai Institute of Biological Products as of Mar 2017
Specification of Main Blood Products of Shanghai Institute of Biological Products
Main Plasma Collection Stations of Shanxi Kangbao Biological Product as of Mar 2017
Distribution of Plasma Collection Stations of Green Cross China as of Mar 2017
Specification of Main Blood Products of Green Cross China
Revenue and Total Profit of Walvax Biotechnology, 2013-2016
Financial Indicators of Hebei Da'an Pharmaceutical, 2015-2016
Main Plasma Collection Stations of Hebei Da'an Pharmaceutical as of Mar 2017
Financial Indicators of Guangdong Weilun Biological Pharmaceutical, 2016
Distribution of Plasma Collection Stations of Guangdong Weilun Biological Pharmaceutical as of Mar 2017
Revenue and Operating Income of Shenzhen Weiguang Biological Products, 2012-2015
Capacity, Output and Sales Volume of Shenzhen Weiguang Biological Products (by Product), 2012-2015
Revenue Breakdown and Structure of Shenzhen Weiguang Biological Products (by Product), 2012-2015 (unit: RMB mln)
Revenue Breakdown and Structure of Shenzhen Weiguang Biological Products (by Product), 2012-2015
Gross Margin of Shenzhen Weiguang Biological Products (by Product), 2012-2015
Name List and Revenue Contribution of Shenzhen Weiguang Biological Products’ Top 5 Customers, 2012-2015
R&D Costs and % of Total Revenue of Shenzhen Weiguang Biological Products, 2012-2015
Shenzhen Weiguang Biological Products’ Products under Research and R&D Process by the end of 2015
Fundraising Projects of Shenzhen Weiguang Biological Products
Distribution of Plasma Collection Stations of Shenzhen Weiguang Biological Products as of Mar 2017
Main Products of Shenzhen Weiguang Biological Products
Specification of Blood Products of Shenzhen Weiguang Biological Products
Plasma Collection Volume and Production-use Plasma Volume of Shenzhen Weiguang Biological Products, 2012-2015
Market Size of China Blood Product Industry, 2016-2021E
Merger & Acquisition Cases of Foreign Blood Product Giants
Merger & Acquisition Cases of China Blood Product Industry, 2008-2016
如果这份报告不能满足您的要求,我们还可以为您定制报告,请 留言说明您的详细需求。
|