|
|
|
报告导航:研究报告—
制造业—化工
|
|
2017-2021年全球及中国活性炭行业研究报告 |
 |
字数:4.0万 |
页数:132 |
图表数:146 |
|
中文电子版:9500元 |
中文纸版:4750元 |
中文(电子+纸)版:10000元 |
|
英文电子版:2400美元 |
英文纸版:2600美元 |
英文(电子+纸)版:2700美元 |
|
编号:ZHP060
|
发布日期:2017-06 |
附件:下载 |
 |
|
|
2016年,全球活性炭需求量约165.0万吨,同比增长6.7%;2012-2016年的年均复合增长率为6.3%。由于公众对于空气及水污染会对健康造成危害的意识越来越强,使得全球对活性炭的需求持续增长。预计2021年全球活性炭需求量接近210.0万吨。
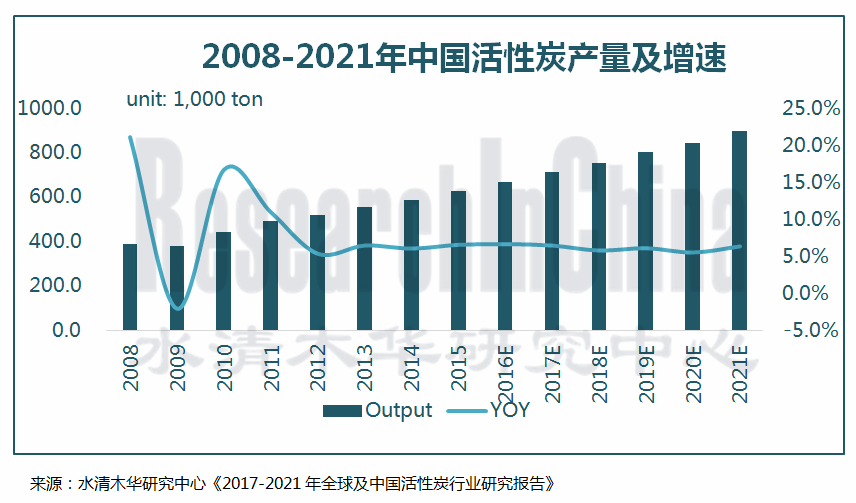
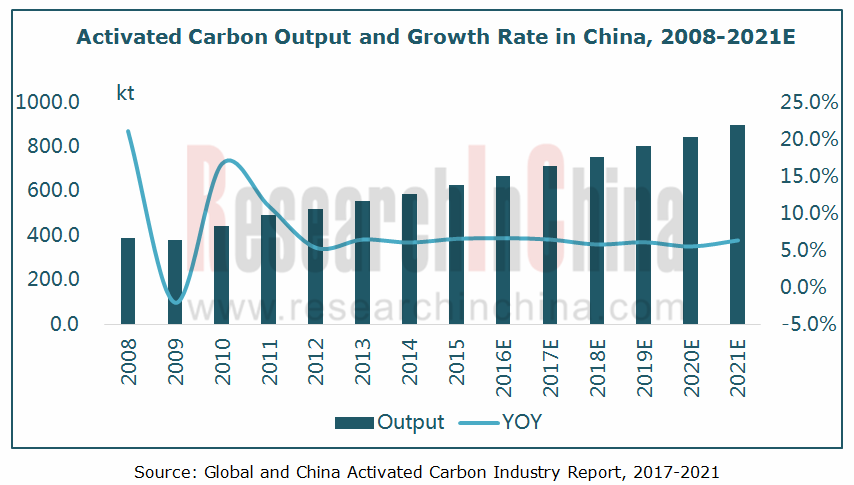
中国是全球仅次于美国的活性炭消费大国,2016年需求量在44万吨左右,全球占比约26.7%。由于中国经济尚处于快速发展阶段,活性炭在工业、食品饮料、污水处理等领域的应用将继续增长,预计2021年中国活性炭需求量接近60.0万吨。此外,中国还是全球活性炭生产大国,2016年产量约67.0万吨,预计2021年接近90.0万吨。
活性炭按材质可分为木质活性炭、煤质活性炭、椰壳活性炭、果壳活性炭等。2016年中国煤质活性炭产量约43.0万吨,木质活性炭产量在20.0万吨以上。未来,受环保及煤炭行业供给侧改革的影响,煤质活性炭的产量将出现下滑;而木质活性炭、椰壳活性炭等产品的产量将稳步提升。
价格方面:在各细分产品中,椰壳活性炭价格最高,在10,000元/吨以上(果壳活性炭7,000元/吨左右、煤质活性炭5,000元/吨左右)。2016年7月份以后,受椰壳活性炭企业供给能力提升,市场竞争不断激烈化的影响,椰壳活性炭价格开始呈现下滑趋势。
竞争格局方面:中国活性炭生产企业众多,但年产能达到万吨规模的屈指可数。2016年,中国木质活性炭领域的龙头企业是元力股份,市场占比在20%以上;煤质活性炭领域的领军为金鼎活性炭,市场份额在15%以上。
未来中国活性炭市场主要呈现以下几个特点:
一、活性炭再生市场前景好。主要因为:1)吸附失效的废炭若处置不当,将造成二次污染;2)焚烧处理的成本+购买新炭的成本要远远高于活性炭再生的价格;3)再生活性炭的二氧化碳排放量只是生产新活性炭的1/5。
二、椰壳活性炭市场需求不断增长。主要因为环境污染日益严重,使得活性炭在空气净化和水体净化领域的应用越来越多,但由于资源和环保问题,煤质碳的应用需求呈下跌趋势,从而为椰壳活性炭的增长提供了一定的空间。
三、活性炭在环境保护领域的应用将越来越多,典型的应用有:有机溶剂回收、脱硫脱硝、有机蒸汽的吸附浓缩及催化燃烧、污水处理和深度净化等。
水清木华研究中心《2017-2021年全球及中国活性炭行业研究报告》着重研究了以下内容:
 活性炭产业的定义、分类、销售模式、产业链等情况; 活性炭产业的定义、分类、销售模式、产业链等情况;
全球活性炭发展概述、市场规模、市场结构、主要国家市场规模等情况;
中国活性炭发展概述、发展环境、市场现状、市场结构、进出口、竞争格局、发展趋势等情况;
活性炭上游产业(林木、化学活化剂、煤炭等)市场现状等情况;
活性炭应用市场(水处理、食品饮料、医药、汽车、化工/冶金等)市场规模、市场应用现状等情况;
国外6家、中国19家活性炭相关企业的经营情况、活性炭业务等情况。
Global demand for activated carbon was about 1.65 million tons in 2016, up 6.7% from a year ago, and recorded a CAGR of 6.3% during 2012-2016. As the public become increasingly aware of the harm caused by air and water pollution to health, the demand for activated carbon all over the world will continue to increase, approaching an estimated 2.10 million tons in 2021.
China, the world’s second largest consumer of activated carbon just behind the United States, needed about 440,000 tons in 2016, accounting for 26.7% of the global total. Still in the stage of rapid development, the country will witness a continued increase in the application of activated carbon in industry, food & beverage, and sewage treatment with the demand for activated carbon nearing an estimated 600,000 tons in 2021. Meanwhile, the country is also a big activated carbon producer (about 670,000 tons in 2016 and close to 900,000 tons as predicted in 2021).
Activated carbon, according to the material, can be divided into wood-based, coal-based, coconut shell-based, and nutshell-based ones. China produced about 430,000 tons of coal-based activated carbon and over 200,000 tons of wood-based activated carbon in 2016. Due to environmental protection and supply-side reform in the coal industry, the output of coal-based activated carbon will decline, while that of wood-based and coconut shell-based activated carbons will rise steadily.
Price: coconut shell-based activated carbon commands the highest price, above RMB10,000/t, compared with around RMB7,000/t for nutshell-based activated carbon and RMB5,000/t for coal-based activated carbon). The price of coconut shell-based activated carbon has begun falling since Jul 2016 because of enhanced supply capacity of coconut shell activated carbon enterprises and fiercer market competition.
Competitive landscape: among a large number of activated carbon producers in China, only a few have annual capacity of more than 10,000 tons. In 2016, Fujian Yuanli Active Carbon was the champion in the wood-based activated carbon field with a market share of over 20%, while Datong Coal Jinding Activated Carbon took the lead in the coal-based activated carbon field with a market share of over 15%.
The Chinese activated carbon market will feature the following:
I. Good prospects for activated carbon regeneration market, largely because: 1) mishandling of ineffective waste carbon will cause secondary pollution; 2) the costs of incineration and buying new carbon are far higher than that of activated carbon regeneration; 3) regenerated activated carbon produces only one-fifth of the carbon dioxide that the new activated carbon produces.
2. Market demand for coconut shell-based activated carbon continues to grow. Ever-growing environmental pollution increase the application of activated carbon in air and water purification fields. However, due to insufficient resources and stringent environmental protection, the demand for coal-based activated carbon trends down and thus provides certain space for growth in coconut shell-based activated carbon.
3. The application of activated carbon in environmental protection field will expand, typically, recovery of organic solvents, desulfurization & denitrification, adsorption & concentration and catalytic combustion of organic vapors, sewage treatment, deep purification, etc.
Global and China Activated Carbon Industry Report, 2017-2021 underlines the followings:
 Activated carbon industry (definition, classification, sales model, industry chain, etc.); Activated carbon industry (definition, classification, sales model, industry chain, etc.);
Global activated carbon industry (overview, market size/structure, market size in major countries, etc.);
China’s activated carbon industry (overview, development environment, market status, market structure, imports/exports, competitive landscape, development trends, etc.);
Main upstream sectors (wood cutting/processing, chemical activator, coal, etc.);
Main applications (water treatment, food & beverage, pharmaceuticals, automobile, chemical/metallurgy, etc.) (market size, product application, etc.);
Six foreign and nineteen Chinese activated carbon enterprises (operation, activated carbon business, etc.).
第一章 活性炭行业概述
1.1 定义
1.2 分类
1.3 应用领域及销售模式
1.4 产业链
第二章 全球活性炭行业发展概况
2.1 发展概述
2.2 市场规模
2.3 市场结构
2.4 主要国家地区
2.4.1 美国
2.4.2 日本
2.4.3 俄罗斯
2.4.4 西欧
2.4.5 亚洲地区
第三章 中国活性炭行业发展概况
3.1 发展概述
3.2 发展环境
3.2.1 监管体制
3.2.2 行业政策
3.2.3 贸易政策
3.3 市场规模
3.3.1 产销
3.3.2 专利
3.3.3 价格
3.4 市场结构
3.5 进出口
3.5.1 进口
3.5.2 出口
3.6 竞争格局
3.6.1 区域格局
3.6.2 企业格局
3.7 发展趋势
3.7.1 木质活性炭需求量持续增长
3.7.2 产品质量提高
3.7.3 活性炭再生市场前景较好
3.7.4 椰壳活性炭和果壳活性炭市场需求不断增长
3.7.5 活性炭在环境保护领域的应用将越来越多
第四章 活性炭主要上游产业现状
4.1 林木采伐、加工行业
4.1.1 产值
4.1.2 产量
4.2 磷酸、氯化锌等化学活化剂
4.3 煤炭行业
4.3.1 市场规模
4.3.2 结构
4.3.3 价格
4.3.4 进出口
第五章 活性炭主要下游应用市场现状
5.1 水处理
5.1.1 活性炭在水处理行业的应用
5.1.2 水处理行业现状
5.2 食品饮料
5.2.1 活性炭在食品饮料行业的应用
5.2.2 食品饮料行业现状
5.3 医药
5.3.1 活性炭在医药行业的应用
5.3.2 医药产业现状
5.4 汽车
5.4.1 活性炭在汽车行业的应用
5.4.2 汽车产业现状
5.5 化工、冶金
第六章 全球主要活性炭企业
6.1 Calgon
6.1.1 简介
6.1.2 经营情况
6.1.3 收入结构
6.1.4 毛利率
6.1.5 研发投入
6.1.6 在华发展
6.1.7 活性炭业务
6.2 Cabot
6.2.1 简介
6.2.2 经营情况
6.2.3 收入结构
6.2.4 毛利率
6.2.5 活性炭业务
6.3 WestRock
6.3.1 简介
6.3.2 经营情况
6.3.3 收入结构
6.3.4 毛利率
6.3.5 活性炭业务
6.4 可乐丽
6.4.1 公司简介
6.4.2 在华业务
6.5 大阪燃气化学集团
6.5.1 公司简介
6.5.2 大阪燃气化学 (OGC)
6.5.3 日本环境化学(JEC)
6.6 CECA
第七章 中国主要活性炭企业
7.1 元力股份
7.1.1 简介
7.1.2 经营情况
7.1.3 收入结构
7.1.4 毛利率
7.1.5 研发投入
7.1.6 客户及供应商
7.1.7 产量及销量
7.1.8 活性炭业务
7.2 福建鑫森炭业
7.2.1 简介
7.2.2 经营情况
7.2.3 发展动态
7.3 芝星炭业
7.3.1 简介
7.3.2 经营情况
7.3.3 R & D
7.3.4 主要客户
7.3.5 发展动态
7.4 江苏竹溪
7.4.1 简介
7.4.2 活性炭业务
7.5上海兴长活性炭有限公司
7.5.1公司简介
7.5.2活性炭业务
7.6江苏浦士达环保科技股份有限公司
7.6.1 公司简介
7.6.2 经营情况
7.6.3 主要客户及供应商
7.7 其他
7.7.1赤峰中林中天化学工业
7.7.2金湖炭素
7.7.3大同机车煤化有限责任公司
7.7.4衢州市云合炭业有限公司
7.7.5杭州恒兴活性炭有限公司
7.7.6贵州黔闽活性炭有限公司
第八章 中国煤质活性炭主要企业
8.1 宁夏华辉活性炭股份有限公司
8.1.1 公司简介
8.1.2 经营情况
8.1.3 活性炭业务
8.2 大同市云光活性炭有限责任公司
8.2.1 公司简介
8.2.2 活性炭业务
8.3 山西新华化工有限责任公司
8.3.1 公司简介
8.3.2 山西新华活性炭有限公司
8.3.3 宁夏广华奇思活性炭有限公司
8.4 内蒙古太西煤集团股份有限公司
8.4.1 公司简介
8.4.2 经营情况
8.4.3 活性炭业务
8.5 大同煤业金鼎活性炭有限公司
8.5.1 公司简介
8.5.2 活性炭业务
8.6 其他
8.6.1 山西华青活性炭集团股份有限公司
8.6.2 怀仁环宇净化材料有限责任公司
1 Overview of Activated Carbon Industry
1.1 Definition
1.2 Classification
1.3 Application and Sales Model
1.4 Industry Chain
2 Global Activated Carbon Industry
2.1 Overview
2.2 Market Size
2.3 Market Structure
2.4 Major Countries/Regions
2.4.1 USA
2.4.2 Japan
2.4.3 Russia
2.4.4 Western Europe
2.4.5 Asia
3 Activated Carbon Industry in China
3.1 Overview
3.2 Development Environment
3.2.1 Regulatory System
3.2.2 Industry Policy
3.2.3 Trade Policy
3.3 Market Size
3.3.1 Output/Sales
3.3.2 Patent
3.3.3 Price
3.4 Market Structure
3.5 Imports/Exports
3.5.1 Imports
3.5.2 Exports
3.6 Competitive Landscape
3.6.1 Regional
3.6.2 Enterprise
3.7 Development Trends
3.7.1 Demand for Wood-based Activated Carbon Ascends
3.7.2 Product Quality Gets Improved
3.7.3 The Activated Carbon Regeneration Market Enjoys Bright Prospects
3.7.4 The Market Demand for Coconut Shell-based Activated Carbon and Nut Shell-based Activated Carbon Keeps Growing
3.7.5 Activated Carbon Finds the Growing Application in the Environmental Protection Field
4 Main Upstream Sectors of Activated Carbon
4.1 Wood Cutting & Processing Industry
4.1.1 Output Value
4.1.2 Output
4.2 Chemical Activators (Phosphoric Acid, Zinc Chloride, etc.)
4.3 Coal Industry
4.3.1 Market Size
4.3.2 Structure
4.3.3 Price
4.3.4 Import & Export
5 Main Applications of Activated Carbon
5.1 Water Treatment Sector
5.1.1 Application of Activated Carbon in Water Treatment
5.1.2 Status Quo of Water Treatment Sector
5.2 Food & Beverage Sector
5.2.1 Application of Activated Carbon in Food & Beverage
5.2.2 Status Quo of Food & Beverage Sector
5.3 Pharmaceuticals Sector
5.3.1 Application of Activated Carbon in Pharmaceuticals
5.3.2 Status Quo of Pharmaceuticals Sector
5.4 Automobile Sector
5.4.1 Application of Activated Carbon in Automobile
5.4.2 Status Quo of Automobile Sector
5.5 Chemical and Metallurgy Sectors
6. Leading Activated Carbon Companies Worldwide
6.1 Calgon
6.1.1 Profile
6.1.2 Operation
6.1.3 Revenue Structure
6.1.4 Gross Margin
6.1.5 R & D and Investment
6.1.6 Development in China
6.1.7 Activated Carbon Business
6.2 Cabot
6.2.1 Profile
6.2.2 Operation
6.2.3 Revenue Structure
6.2.4 Gross Margin
6.2.5 Activated Carbon Business
6.3 WestRock
6.3.1 Profile
6.3.2 Operation
6.3.3 Revenue Structure
6.3.4 Gross Margin
6.3.5 Activated Carbon Business
6.4 Kuraray
6.4.1 Profile
6.4.2 Development in China
6.5 Osaka Gas Chemicals Group
6.5.1 Profile
6.5.2 Osaka Gas Chemicals (OGC)
6.5.3 Japan EnviroChemicals (JEC)
6.6 CECA
7. Leading Wooden Activated Carbon Enterprises in China
7.1 Fujian Yuanli Active Carbon
7.1.1 Profile
7.1.2 Operation
7.1.3 Revenue Structure
7.1.4 Gross Margin
7.1.5 R & D and Investment
7.1.6 Customers and Suppliers
7.1.7 Production and Sales
7.1.8 Activated Carbon Business
7.2 Fujian Xinsen Carbon
7.2.1 Profile
7.2.2 Operation
7.2.3 Development
7.3 Fujian Zhixing Activated Carbon
7.3.1 Profile
7.3.2 Operation
7.3.3 R & D
7.3.4 Major Customers
7.3.5 Development
7.4 Jiangsu Zhuxi Activated Carbon
7.4.1 Profile
7.4.2 Activated Carbon Business
7.5 Shanghai Xingchang Activated Carbon
7.5.1 Profile
7.5.2 Activated Carbon Business
7.6 Jiangsu Purestar EP Technology
7.6.1 Profile
7.6.2 Operation
7.6.3 Major Customers and Suppliers
7.7 Others
7.7.1 Chifeng Zhonglin Zhongtian Chemical Industry
7.7.2 Golden Lake Carbon
7.7.3 Datong Locomotive Coal
7.7.4 QuzhouYunhe Carbon
7.7.5 Hangzhou Hengxing Activated Carbon
7.7.6 Guizhou Qianmin Activated Carbon
8 Major Coaly Activated Carbon Enterprises in China
8.1 Ningxia Huahui Activated Carbon
8.1.1 Profile
8.1.2 Operation
8.1.3 Activated Carbon Business
8.2 Datong Municipal Yunguang Activated Carbon
8.2.1 Profile
8.2.2 Activated Carbon Business
8.3 Shanxi Xinhua Chemical
8.3.1 Profile
8.3.2 Shanxi Xinhua Activated Carbon
8.3.3 Ningxia Guanghua-Cherishmet Activated Carbon
8.4 Inner Mongolia Taixi Coal Group
8.4.1 Profile
8.4.2 Operation
8.4.3 Activated Carbon Business
8.5 Datong Coal Jinding Activated Carbon
8.5.1 Profile
8.5.2 Activated Carbon Business
8.6 Others
8.6.1 Shanxi Huaqing Activated Carbon Group
8.6.2 Huairen Huanyu Purification Materials
表:活性炭分类及简介
表:木制活性炭和煤质活性炭的区别
图:活性炭应用及销售模式
图:活性炭产业链
表:全球活性炭发展历程
图:2008-2021年全球活性炭需求及同比增长
图:2012-2021全球活性炭市场规模
图:2016年全球活性炭需求结构
图:2016及2021年全球活性炭需求结构(按终端应用)
图:2016年全球活性炭应用结构
图:2016年全球活性炭(分产品)需求结构
图:2014-2021年美国活性炭需求量
图:2016年美国活性炭按应用分需求结构
图:2005-2021年日本活性炭需求量
图:2016年日本活性炭按应用分需求结构
图:2012-2021年俄罗斯活性炭产量
图:2016年西欧活性炭按应用分需求结构
图:中国主要活性炭生产区域分布
表:中国部分现行国家标准对活性炭质量的要求
表:2003-2017年中国活性炭行业相关政策
表:2017美国对华活性炭反倾销幅度修订结果
图:2008-2021中国活性炭产量及增速
图:2010-2021中国活性炭表观消费量
图:2004-2017中国活性炭专利申请数量
图:2017年中国主要活性炭价格走势
图:2015-2017年中国椰壳活性炭价格走势
图:2016/2021年中国活性炭产量结构
图:2016/2021年中国活性炭应用结构
图:2010-2017年中国木质活性炭进口量及进口金额
表:2016年中国木质活性炭进口量前十的国家地区及进口金额
图:2010-2017年中国其他活性炭进口量及进口金额
表:2016年中国其他活性炭进口量前十的国家地区及进口金额
图:2010-2017年中国木质活性炭出口量及出口金额
表:2016年中国木质活性炭出口前十的国家地区及出口金额
图:2010-2017年中国其他活性炭出口量及出口金额
表:2016年中国其他活性炭出口前十的国家地区及出口金额
图:2016年中国木质活性炭(分地区)产能构成
图:2016年中国木质活性炭(分企业)产能结构
图:2016年中国煤质活性炭(分企业)产能占比
图:2008-2021年中国林业总产值及同比增长率
图:2008-2021年中国木材产量及同比增长率
图:2008-2021中国原木产量及同比增长率
图:2008-2017年中国原木进口量及进口金额
图:2015-2017年中国磷酸(85%工业级)价格走势
图:中国无烟煤储量分布
图:2009-2017年中国无烟煤产量及同比增长率
图:2009-2017年中国无烟煤表观消费量
图:2015年中国无烟煤(分地区)产量构成
图:2010-2016年中国动力煤价格走势
图:2010-2016年中国无烟煤价格走势
图:2016-2017年中国无烟煤平均价格增长幅度
图:2009-2016年中国无烟煤进口量
图:2009-2016年中国无烟煤出口量
表:中国活性炭应用历程
表:中国水处理用活性炭标准
图:2014-2021年中国水处理行业活性炭用量
图:2008-2017年中国人均用水量及同比增长率
图:2008-2017年中国瓶(罐)装饮用水产量及同比增长率
图:2008-2017年中国生活污水及工业废水排放量
图:2014-2021年中国食品饮料行业活性炭用量
表:2010-2021年中国发酵工业(分产品)活性炭需求量
图:2008-2017中国淀粉糖产量及同比增长率
图:2008-2017年中国食糖产量及同比增长率
图:2008-2017年中国碳酸饮料产量及同比增长率
表:活性炭在制药领域的应用
图:2014-2021年中国医药行业活性炭用量
图:2011-2015年全球主要国家医药产业年均复合增长率
图:2014-2021年中国医药行业产值及同比增长
图:2015-2021年中国汽车行业活性炭用量
图:2005-2017年全球乘用车销量
图:2005-2017年全球商用车销量
图:2016年全球主要国家汽车销量
图:2014-2016年中国汽车销量变化
图:2014-2016年中国乘用车(分国别)销量构成
图:2015-2016年中国汽车市场竞争格局
图:2010-2016年Calgon收入及净利润
图:2010-2016年Calgon按部门分收入
图:2010-2016年Calgon按地域分收入
图:2010-2016年Calgon毛利率
图:2010-2016年Calgon研发投入及占总收入占比
图:2010-2016年Calgon资本支出及同比增长
图:2010-2016年Calgon中国区收入及总收入占比
图:Calgon主要产品
图:Cabot全球布局
图:2010-2017财年Cabot收入及净利润
图:2015-2017财年Cabot分部门收入
图:2011-2016财年Cabot分地域收入
图:2011-2017财年Cabot毛利率
图:2011-2016财年Cabot活性炭收入及同比增长
图:Cabot主要产品
图:WestRock全球布局
表:2012-2016财年WestRock经营情况
表:2014-2016财年WestRock(分产品)营业收入
图:2014-2016财年WestRock毛利率水平
图:2014-2016年Ingevity营收结构
图:Kuraray子公司
图:Kuraray活性炭生产研发基地
图:Osaka Gas Chemicals Group全球布局
图:Japan EnviroChemicals活性炭生产基地布局及简介
图:2017年元力股份股权结构
表:元力股份子公司
图:2010-2017年元力股份收入及净利润
图:2015-2016年元力股份(分产品)营收构成
图:2010-2016年元力股份分地区收入
图:2010-2016年元力股份毛利率
图:2010-2016年元力股份分地区毛利率
图:2010-2016年元力股份研发投入及总收入占比
表:2016年元力股份主要研发项目
图:2010-2016年元力股份前5名客户收入
图:2010-2016年元力股份前5名供应商采购金额
图:2010-2016年元力股份活性炭产量,销量及库存
图:元力股份主要产品
图:福建鑫森炭业产品产能
图:福建鑫森炭业活性炭应用
图:2016年芝星炭业股权结构
图:2013-2016年芝星炭业收入及总利润
图:2013-2016年芝星炭业毛利率
表:2013-2016年芝星炭业总资产及负债
图:2015-2016年芝星炭业(分产品)营收构成
图:2015-2016年芝星炭业(分地区)营收构成
图:2015-2016年芝星炭业研发投入及占比
表:2016年芝星炭业主要客户销售额及占比
表:江苏竹溪5万吨/年活性炭深度加工项目规划
表:江苏竹溪主要活性炭产品特性
图:2016年浦士达股权结构
图:2014-2016年浦士达营业收入及毛利率
图:2014-2016年浦士达(分产品)营业收入结构
表:2016年浦士达前五大客户销售额及占比
表:2016年浦士达前五大供应商采购额及占比
图:2016年宁夏华辉股权结构
表:2011-2016年宁夏华辉主要经营指标
图:2014-2016年宁夏华辉(分地区)活性炭业务收入结构
表:宁夏华辉主要海外活性炭客户
表:云光活性炭主要客户
图:2015-2016年新华化工主要经营指标
表:新华活性炭公司主要生产线及其产能
图:2010-2016太西煤集团营业收入
图:2010-2014年太西煤集团活性炭产销量
图:金鼎活性炭水处理用活性炭生产流程
图:金鼎活性炭压块破碎活性炭生产流程
图:金鼎活性炭脱硫脱硝活性炭生产流程
图:2015-2016年金鼎活性炭销售收入及毛利率
图:2013-2016年华青股份营业收入及净利润
图:2015-2016年华青股份(分地区)营收构成
表:2016年华青股份前五大客户销售额及占比
表:2016年华青股份前五大客户销售额及占比
Classification and Brief Introduction of Activated Carbon
Difference between Wood-based Activated Carbon and Coal-based Activated Carbon
Application and Sales Model of Activated Carbon
Activated Carbon Industry Chain
History of Global Activated Carbon Development
Global Demand for Activated Carbon and YoY Growth, 2008-2021E
Global Activated Carbon Market Size, 2012-2021E
Global Activated Carbon Demand Structure, 2016
Global Activated Carbon Demand Structure by Terminal Application, 2016/2021E
Global Activated Carbon Application Structure, 2016
Global Activated Carbon Demand Structure (by Product), 2016
Activated Carbon Demand in United States, 2014-2021E
Activated Carbon Demand Structure in United States by Application, 2016
Activated Carbon Demand in Japan, 2005-2021E
Activated Carbon Demand Structure in Japan by Application, 2016
Activated Carbon Output in Russia, 2012-2021E
Activated Carbon Demand Structure in Western Europe by Application, 2016
Distribution of Main Activated Carbon Production Areas in China
Requirements on Quality of Activated Carbon in Some Current National Standards in China
Policies on Activated Carbon Industry in China, 2003-2017
Revised Results of United States on Anti-dumping of China’s Activated Carbon, 2017
Activated Carbon Output and YoY Growth in China, 2008-2021E
Apparent Consumption of Activated Carbon in China, 2010-2021E
Number of Patent Filings for Activated Carbon in China, 2004-2017
Price Trend of Main Activated Carbons in China, 2017
Price Trend of Coconut Shell-based Activated Carbon in China, 2015-2017
Activated Carbon Output Structure in China, 2016/2021E
Activated Carbon Application Structure in China, 2016/2021E
Import Volume and Value of Wood-based Activated Carbon in China, 2010-2017
Top 10 Origins (Countries/Regions) of Wood-based Activated Carbon Imports in China, 2016
Import Volume and Value of Other Activated Carbons in China, 2010-2017
Top 10 Origins (Countries/Regions) of Other Activated Carbon Imports in China, 2016
Export Volume and Value of Wood-based Activated Carbon in China, 2010-2017
Top 10 Destinations (Countries/Regions) of Exports of Wood-based Activated Carbon from China, 2016
Export Volume and Value of Other Activated Carbons in China, 2010-2017
Top 10 Destinations (Countries/Regions) of Exports of Other Activated Carbons from China, 2016
Capacity Structure of Wood-based Activated Carbon in China (by Region), 2016
Capacity Structure of Wood-based Activated Carbon in China (by Enterprise), 2016
Capacity Structure of Coal-based Activated Carbon in China (by Enterprise), 2016
Total Output Value of Forestry and YoY Growth in China, 2008-2021E
Timber Output and YoY Growth in China, 2008-2021E
Log Output and YoY Growth in China, 2008-2021E
Import Volume and Value of Log in China, 2008-2017
Price Trend of Phosphoric Acid (85% Industrial Grade) in China, 2015-2017
Distribution of Anthracite Reserves in China
Anthracite Output and YoY Growth in China, 2009-2017
Apparent Consumption of Anthracite in China, 2009-2017
Anthracite Output Structure in China (by Region), 2015
Price Trend of Thermal Coal in China, 2010-2016
Price Trend of Anthracite in China, 2010-2016
YoY Growth in Average Price of Anthracite in China, 2016-2017
Import Volume of Anthracite in China, 2009-2016
Export Volume of Anthracite in China, 2009-2016
History of Activated Carbon Application in China
Standards for Activated Carbon for Water Treatment in China
Activated Carbon Consumption in Water Treatment Industry in China, 2014-2021E
Water Consumption Per Capita and YoY Growth in China, 2008-2017
Bottled/Canned Drinking Water Output and YoY Growth in China, 2008-2017
Discharge Volume of Sanitary Sewage and Industrial Wastewater, 2008-2017
Activated Carbon Consumption in Food and Beverage Industry in China, 2014-2021E
Demand for Activated Carbon from Fermentation Industry in China (by Product), 2010-2021E
Starch Sugar Output and YoY Growth in China, 2008-2017
Sugar Output and YoY Growth in China, 2008-2017
Carbonated Beverage Output and YoY Growth in China, 2008-2017
Activated Carbon Application in Pharmaceuticals
Activated Carbon Consumption in Pharmaceutical Industry in China, 2014-2021E
CAGR of Pharmaceutical Industry in Major Countries, 2011-2015
Output Value and YoY Growth of Pharmaceutical Industry in China, 2014-2021E
Activated Carbon Consumption in Automotive Industry in China, 2015-2021E
Global Passenger Car Sales, 2005-2017
Global Commercial Vehicle Sales, 2005-2017
Automobile Sales of Major Countries, 2016
Changes in China’s Automobile Sales, 2014-2016
Sales Structure of Passenger Cars in China (by Country), 2014-2016
Competitive Pattern of Automobile Market in China, 2015-2016
Calgon's Revenue and Net Income, 2010-2016
Calgon's Revenue (by Division), 2010-2016
Calgon's Revenue (by Region), 2010-2016
Calgon's Gross Margin, 2011-2016
Calgon's R&D Costs and% of Total Revenue, 2010-2016
Calgon's Capital Expenditure and YoY Growth, 2010-2016
Calgon's Revenue in China, YoY Growth and % of Total Revenue, 2010-2016
Main Products of Calgon
Global Presence of Calgon
Revenue and Net Income of Cabot, FY2010-FY2017
Revenue of Cabot (by Segment), FY2015-FY2017
Revenue of Cabot (by Region), FY2011-FY2016
Gross Margin of Cabot, FY2011-FY2017
Activated Carbon Revenue, YoY Growth and % of Total Revenue of Cabot, FY2011-FY2016
Main Products of Cabot
Global Presence of WestRock
WestRock’s Operation, FY2012-FY2016
WestRock’s Revenue (by Product), FY2014-FY2016
WestRock’s Gross Margin, FY2014-FY2016
Ingevity’s Revenue Structure, FY2014-FY2016
Kuraray’s Subsidiaries
Kuraray’s Activated Carbon Production and R&D Bases
Global Presence of Osaka Gas Chemicals Group
Layout and Information of Activated Carbon Production Plants of Japan Enviro Chemicals
Equity Structure of Fujian Yuanli Active Carbon, 2017
Subsidiaries of Fujian Yuanli Active Carbon
Revenue and Net Income of Fujian Yuanli Active Carbon, 2010-2017
Revenue Structure of Fujian Yuanli Active Carbon (by Product), 2015-2016
Revenue of Fujian Yuanli Active Carbon (by Region), 2010-2016
Gross Margin of Fujian Yuanli Active Carbon, 2010-2016
Gross Margin of Fujian Yuanli Active Carbon (by Region), 2010-2016
R&D Costs and % of Total Revenue of Fujian Yuanli Active Carbon, 2010-2016
Main R&D Projects of Fujian Yuanli Active Carbon, 2016
Revenue from Top 5 Clients and % of Total Revenue of Fujian Yuanli Active Carbon, 2010-2016
Procurement from Top 5 Suppliers and % of Total Procurement of Fujian Yuanli Active Carbon, 2010-2016
Activated Carbon Output, Sales Volume and Inventory of Fujian Yuanli Active Carbon, 2011-2016
Main Products of Fujian Yuanli Active Carbon
Capacity of Fujian Xinsen Carbon (by Product)
Activated Carbon Applications of Fujian Xinsen Carbon
Equity Structure of Fujian Zhixing Activated Carbon, 2016
Revenue and Total Profits of Fujian Zhixing Activated Carbon, 2013-2016
Gross Margin of Fujian Zhixing Activated Carbon, 2013-2016
Total Assets and Total Liabilities of Fujian Zhixing Activated Carbon, 2013-2016
Revenue Structure of Fujian Zhixing Activated Carbon (by Product), 2015-2016
Revenue Structure of Fujian Zhixing Activated Carbon (by Region), 2015-2016
R&D Costs and % of Total Revenue of Fujian Zhixing Activated Carbon, 2015-2016
Revenue from Top 5 Clients and % of Total Revenue of Fujian Zhixing Activated Carbon, 2016
50 kt/a Activated Carbon Deep (Fine) Processing Project Planning of Jiangsu Zhuxi Activated Carbon
Properties of Main Activated Carbon Products of Jiangsu Zhuxi Activated Carbon
Equity Structure of Jiangsu Purestar EP Technology, 2016
Revenue and Gross Margin of Jiangsu Purestar EP Technology, 2014-2016
Revenue Structure of Jiangsu Purestar EP Technology (by Product), 2014-2016
Revenue from Top 5 Clients and % of Total Revenue of Jiangsu Purestar EP Technology, 2016
Procurement from Top 5 Suppliers and % of Total Procurement of Jiangsu Purestar EP Technology, 2016
Equity Structure of Ningxia Huahui Activated Carbon, 2016
Main Financial Indices of Ningxia Huahui Activated Carbon, 2011-2016
Revenue Structure of Activated Carbon Business of Ningxia Huahui Activated Carbon (by Region), 2014-2016
Main Overseas Activated Carbon Clients of Ningxia Huahui Activated Carbon
Main Clients of Datong Municipal Yunguang Activated Carbon
Main Financial Indices of Shanxi Xinhua Chemical, 2015-2016
Main Production Lines and Capacity of Shanxi Xinhua Activated Carbon
Revenue of Inner Mongolia Taixi Coal Group, 2010-2016
Activated Carbon Output and Sales Volume of Inner Mongolia Taixi Coal Group, 2010-2014
Production Process of Activated Carbon for Water Treatment of Datong Coal Jinding Activated Carbon
Production Process of Activated Carbon Briquettes of Datong Coal Jinding Activated Carbon
Production Process of Activated Carbon for Desulfurization and Denitrification of Datong Coal Jinding Activated Carbon
Revenue and Gross Margin of Datong Coal Jinding Activated Carbon, 2015-2016
Revenue and Net Income of Shanxi Huaqing Activated Carbon Group, 2013-2016
Revenue Structure of Shanxi Huaqing Activated Carbon Group (by Region), 2015-2016
Revenue from Top 5 Clients and % of Total Revenue of Shanxi Huaqing Activated Carbon Group, 2016
Procurement from Top 5 Suppliers and % of Total Procurement of Shanxi Huaqing Activated Carbon Group, 2016
如果这份报告不能满足您的要求,我们还可以为您定制报告,请 留言说明您的详细需求。
|