|
|
|
报告导航:研究报告—
制造业—化工
|
|
2017-2021年中国聚醚单体产业链研究报告 |
 |
字数:2.7万 |
页数:120 |
图表数:151 |
|
中文电子版:10000元 |
中文纸版:5000元 |
中文(电子+纸)版:10500元 |
|
英文电子版:2500美元 |
英文纸版:2700美元 |
英文(电子+纸)版:2800美元 |
|
编号:CYH064
|
发布日期:2017-07 |
附件:下载 |
 |
|
|
聚醚单体是由环氧乙烷和其他单体加聚而成,主要用于合成聚羧酸减水剂。2016年,中国聚羧酸减水剂消费量约594万吨,同比增长8.0%。“十三五”期间,在中国经济和铁路、房地产等基建工程发展的带动下,聚羧酸减水剂消费量将继续保持增长,至2021年其消费量有望达至855.6万吨。
受此拉动,2016年,中国聚羧酸减水剂用聚醚单体需求量同比增长8.1%至108.1万吨。2017-2021年其需求量有望保持年均10%的速度增长,至2021年达到170万吨。
按生产工艺,聚醚单体分为聚乙二醇单甲醚(MPEG)、烯丙基聚氧乙烯醚(APEG)、甲基烯基聚氧乙烯醚(TPEG)和异丁烯醇聚氧乙烯醚(HPEG)等。其中,TPEG+HPEG产品市场占有率最高,2016年约占96%,在市场对聚醚单体产品功能性要求更加严格的背景下,HPEG、TPEG等产品市场占有率将进一步提高,2021年有望提升至98%左右。
价格方面,聚醚单体整体价格涨跌与核心原料环氧乙烷相关性较强,2016年中国环氧乙烷行业价格在市场回暖的推动下,略有回升,同时聚醚单体整体价格在2015年触底后,自2016年3月波动上升,2017年价格仍将呈现微幅上升的趋势。
地区分布方面,受环氧乙烷分布影响,江苏省是中国聚醚单体产需最大的省份,2016年其产、需量分别占中国总产、需量的19.2%和9.8%。
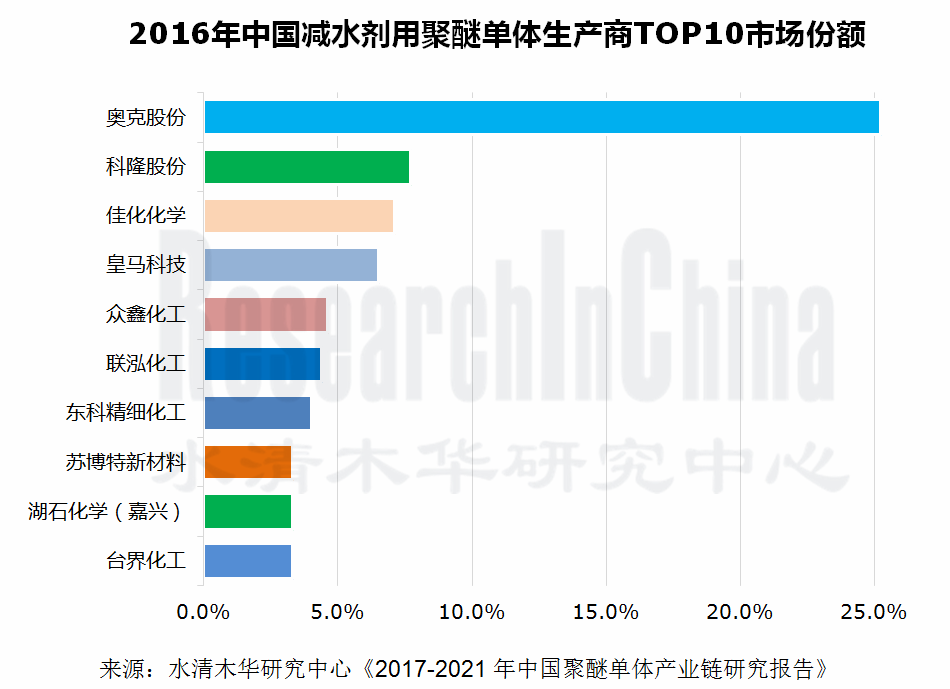
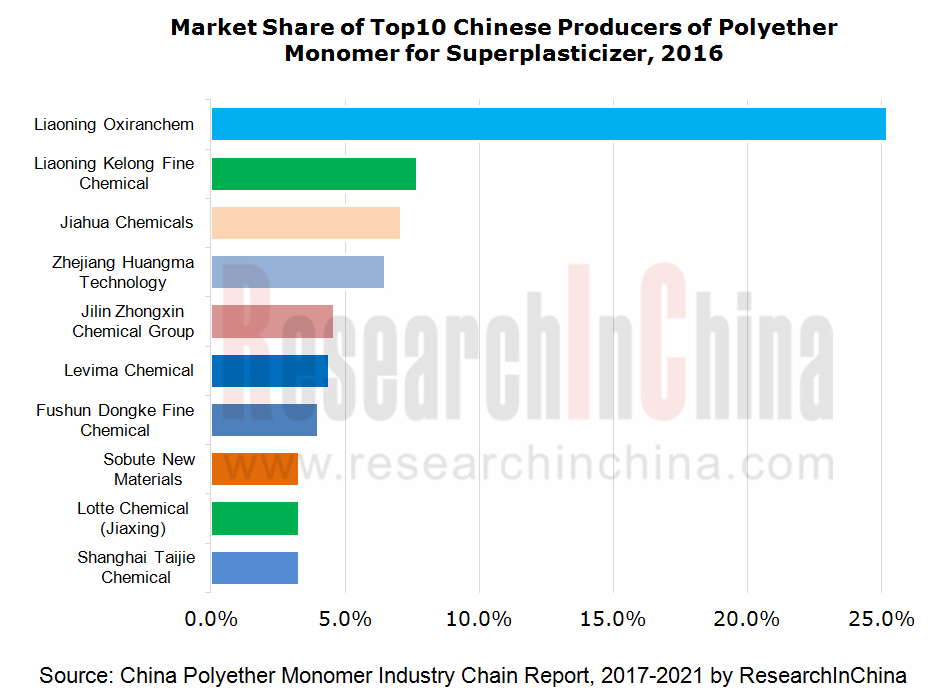
企业格局方面,受上游环氧乙烷只能短距离运输等限制,中国聚醚单体生产商主要集中在华东等地区,且市场集中度相对较高。2016年,奥克股份、科隆股份、佳化化学、皇马科技和上海台界等前10大聚醚单体生产商市场份额合计达69.3%(按产量)。其中奥克股份是中国最大的聚醚单体供应商,2016年产量达34.7万吨,市场份额达25.2%。近年来,公司依然积极扩张上下游产品的生产能力,以提升企业竞争力。2017年6月,公司收购了四川石达化学公司,新增20万吨/年环氧乙烷衍生精细化学品生产能力。
水清木华研究中心《2017-2021年中国聚醚单体产业链研究报告》着重研究了以下内容:
 中国聚醚单体行业发展现状、市场供需、地区结构、进出口、竞争格局、价格及发展趋势等; 中国聚醚单体行业发展现状、市场供需、地区结构、进出口、竞争格局、价格及发展趋势等;
环氧乙烷、甲醇、丙烯酸等聚醚单体上游原材料市场供需、竞争格局、价格分析等;
聚羧酸减水剂、表面活性剂等聚醚单体主要下游行业市场供需、进出口、竞争格局、价格分析等;
全球及中国9家主要聚醚单体生产企业经营情况、聚醚单体业务及发展前景等;
中国4家聚羧酸减水剂企业经营情况、减水剂业务及发展前景等。
Polyether monomers, made from ethylene oxide and other monomers, are primarily used for synthesis of polycarboxylate superplasticizer. China consumed about 5.94 million tons of polycarboxylate superplasticizer in 2016, up 8.0% over the previous year. Driven by the economic growth and infrastructure projects (railway, real estate, etc.), polycarboxylate superplasticizer consumption will continue to grow during the 13th Five-Year Plan period (2016-2020), hitting an estimated 8.556 million tons in 2021.
Because of this, the country’s demand for the polyether monomer for polycarboxylate superplasticizer rose by 8.1% from a year ago to 1.081 million tons in 2016, and is expected to maintain an AAGR of 10% during 2017-2021, reaching 1.70 million tons in 2021.
By production process, polyether monomers can be divided into methoxy polyethylene glycol (MPEG), allyloxy polyethylene glycol (APEG), tresylated polyethylene glycol (TPEG), and isobutylene alcohol polyoxyethylene ether (HPEG). TPEG + HPEG hold the highest market share, approximately 96% in 2016 and expected to increase to around 98% in 2021 against the backdrop of stricter requirements on the functionality of polyether monomers.
Closely linked with core raw material- ethylene oxide, the prices of polyether monomers has increased amid volatilities since Mar 2016 and still sustained the momentum of slight rise in 2017 after touching bottom in 2015, as the prices of ethylene oxide picked up in 2016 along with market recovery.
Affected by the distribution of ethylene oxide, Jiangsu is the largest producer and consumer of polyether monomers in China, accounting for 19.2% and 9.8% of the country’s total output and demand in 2016, respectively.
As the upstream raw material- ethylene oxide can only be transported within short range, the majority of Chinese polyether monomer producers are located in East China and the market is highly concentrated. The top10 polyether monomer producers such as Liaoning Oxiranchem, Liaoning Kelong Fine Chemical, Jiahua Chemicals, Zhejiang Huangma Technology, and Shanghai Taijie Chemical seized a combined 69.3% market share by output. Liaoning Oxiranchem is the largest polyether monomer maker in China with an output of 347,000 tons and a 25.2% market share in 2016. The company has been committed to expanding production capacity of upstream and downstream products so as to sharpen its competitiveness in recent years. It acquired Sichuan Sedar Chemical in Jun 2017, adding capacity of 200,000 t/a ethylene oxide-derived fine chemicals.
China Polyether Monomer Industry Chain Report, 2017-2021 highlights the following:
 Polyether monomer industry in China (status quo, market supply & demand, regional structure, import & export, competitive landscape, prices, development trends, etc.); Polyether monomer industry in China (status quo, market supply & demand, regional structure, import & export, competitive landscape, prices, development trends, etc.);
Markets for upstream raw materials (ethylene oxide, methanol, and acrylic acid) (supply & demand, competitive landscape, prices, etc.);
Main downstream industries (polycarboxylate superplasticizer, surfactant) (market supply & demand, import & export, competitive landscape, prices, etc.);
Nine major global and Chinese polyether monomer producers (operation, polyether monomer business, development prospects, etc.);
Four Chinese polycarboxylate superplasticizer enterprises (operation, superplasticizer business, development prospects, etc.)
第一章 聚醚单体概述
1.1分类及应用
1.2 产业链
第二章 中国聚醚单体发展概况
2.1 发展现状
2.2 进出口
2.3 地区结构
2.4 竞争格局
2.5 市场价格
2.6 发展趋势
第三章 中国聚醚单体上游发展对其影响
3.1 环氧乙烷(EO)
3.1.1 市场供需
3.1.2 竞争格局
3.1.3 市场价格
3.2 甲醇
3.2.1 市场供需
3.2.2 市场价格
3.2.3 主要企业
3.3 丙烯酸
3.3.1 市场需求
3.3.2 竞争格局
3.3.3 市场价格
3.4 烯醇
第四章 中国聚醚单体下游发展对其影响
4.1 聚羧酸减水剂
4.1.1 市场供需
4.1.3 竞争格局
4.1.4 市场价格
4.2 非离子表面活性剂
4.2.1 供给
4.2.2 需求
4.2.3 进出口
第五章 国外主要聚醚单体企业
5.1 陶氏化学(DOW)
5.1.1 公司简介
5.1.2 经营情况
5.1.3 高性能材料及化学品部门经营情况
5.1.4 聚醚单体业务
5.1.5 在华发展
5.2 科莱恩(Clariant)
5.2.1 公司简介
5.2.2 经营情况
5.2.3 聚醚单体业务
5.2.4 在华发展
5.3 Lotte Chemical Corporation
5.3.1 公司简介
5.3.2 经营情况
5.3.3 聚醚单体业务
5.3.4 在华业务
第六章 中国主要聚醚单体企业
6.1 奥克股份
6.1.1 公司简介
6.1.2 经营情况
6.1.3 研发
6.1.4 聚醚单体业务
6.1.5 发展战略
6.2 科隆股份
6.2.1 公司简介
6.2.2 经营情况
6.2.3 研发
6.2.4 聚醚单体和减水剂业务
6.3 皇马科技
6.3.1 公司简介
6.3.2 经营情况
6.3.3 聚醚单体业务
6.3.3 研发
6.4 上海台界
6.4.1 公司简介
6.4.2 聚醚单体业务
6.5 佳化化学
6.5.1 公司简介
6.5.2 经营状况
6.5.3 研发
6.5.4 聚醚单体业务
6.6 南京威尔
6.6.1 公司简介
6.6.2 聚醚单体业务
第七章 中国主要聚羧酸系减水剂企业
7.1 江苏苏博特
7.1.1 公司简介
7.1.2 减水剂业务
7.2 建研集团
7.2.1 公司简介
7.2.2 经营情况
7.2.3 研发
7.2.4 减水剂业务
7.3 华伟银凯
7.3.1 公司简介
7.3.2 经营情况
7.3.4 减水剂业务
7.4 山西凯迪
7.4.1 公司简介
7.4.2 减水剂业务
1 Overview of Polyether Monomer
1.1 Classification and Application
1.2 Industry Chain
2. Development of Polyether Monomer in China
2.1 Status Quo
2.2 Import & Export
2.3 Regional Structure
2.4 Competitive Landscape
2.5 Market Price
2.6 Development Trends
3 Influence of Upstream Sectors’ Development on Polyether Monomer in China 3.1 Ethylene Oxide (EO)
3.1.1 Market Supply & Demand
3.1.2 Competitive Landscape
3.1.3 Market Price
3.2 Methanol
3.2.1 Market Supply & Demand
3.2.2 Market Price
3.2.3 Major Enterprises
3.3 Acrylic Acid
3.3.1 Market Demand
3.3.2 Competitive Landscape
3.3.3 Market Price
3.4 Enol
4 Influence of Downstream Sectors’ Development on Polyether Monomer in China
4.1 Polycarboxylate Superplasticizer
4.1.1 Market Supply & Demand
4.1.2 Competitive Landscape
4.1.3 Market Price
4.2 Nonionic Surfactant
4.2.1 Supply
4.2.2 Demand
4.2.3 Import & Export
5 Major Foreign Polyether Monomer Companies
5.1 Dow Chemical
5.1.1 Profile
5.1.2 Operation
5.1.3 Operation of Performance Materials & Chemicals Segment
5.1.4 Polyether Monomer Business
5.1.5 Development in China
5.2 Clariant
5.2.1 Profile
5.2.2 Operation
5.2.3 Polyether Monomer Business
5.2.4 Development in China
5.3 Lotte Chemical Corporation
5.3.1 Profile
5.3.2 Operation
5.3.3 Polyether Monomer Business
5.3.4 Business in China
6 Major Chinese Polyether Monomer Enterprises
6.1 Liaoning Oxiranchem
6.1.1 Profile
6.1.2 Operation
6.1.3 R&D
6.1.4 Polyether Monomer Business
6.1.5 Development Strategy
6.2 Liaoning Kelong Fine Chemical
6.2.1 Profile
6.2.2 Operation
6.2.3 R&D
6.2.4 Polyether Monomer and Superplasticizer Business
6.3 Zhejiang Huangma Technology
6.3.1 Profile
6.3.2 Operation
6.3.3 Polyether Monomer Business
6.3.4 R&D
6.4 Shanghai Taijie Chemical
6.4.1 Profile
6.4.2 Polyether Monomer Business
6.5 Jiahua Chemicals
6.5.1 Profile
6.5.2 Operation
6.5.3 R&D
6.5.4 Polyether Monomer Business
6.6 Nanjing Well Chemical
6.6.1 Profile
6.6.2 Polyether Monomer Business
7 Major Chinese Polycarboxylate Superplasticizer Enterprises
7.1 Jiangsu Sobute New Materials
7.1.1 Profile
7.1.2 Superplasticizer Business
7.2 Xiamen Academy of Building Research Group
7.2.1 Profile
7.2.2 Operation
7.2.3 R&D
7.2.4 Superplasticizer Business
7.3 Shandong Huawei Yin Kai Building Materials
7.3.1 Profile
7.3.2 Operation
7.3.3 Superplasticizer Business
7.4 Shanxi Kaidi Building Materials
7.4.1 Profile
7.4.2 Superplasticizer Business
表:各类聚醚单体在减水剂领域的优劣比较
图:聚醚单体(MPEG/TPEG/APEG)产业链
图:聚醚单体结构发展历程
图:2010-2016年中国三大聚醚单体在聚羧酸减水剂市场占比
图:2009-2016年中国减水剂用聚醚单体量
表:2009-2017年中国减水剂用聚醚单体进出口量
图:2016年中国减水剂用聚醚单体(分地区)需求量构成
表:2016年中国聚醚单体(分省市)需求量及占比
图:2016年中国减水剂用聚醚单体(分省市)产量构成
图:2016年中国减水剂用聚醚单体生产商TOP10市场份额(按产量)
表:2016年中国减水剂用聚醚单体生产商TOP35及产量
图:2011-2017年中国聚醚单体价格走势
图:2013-2017年中国聚醚单体APEG价格走势
图:2013-2017年中国聚醚单体TPEG(4C)价格走势
图:2013-2016年中国聚醚单体TPEG(5C)价格走势
图:2013-2016年中国聚醚单体MPEG价格走势
图:2017-2021年中国减水剂用聚醚单体量
图:2021年中国三大减水剂用聚醚单体市场份额
图:2012-2021年中国环氧乙烷和商品环氧乙烷产量
图:2016年中国商品环氧乙烷(分地区)产能构成
表:截至2016年底中国环氧乙烷和商品环氧乙烷(分企业)产能
图:2011/2016/2021年中国环氧乙烷(分产品)需求结构
图:2016年中国环氧乙烷市场竞争格局
图:2016年中国商品环氧乙烷市场竞争格局
图:2006-2017年中国环氧乙烷市场平均价格
图:2010-2017年中国甲醇产能
图:2016年中国甲醇(分原材料)产能占比
图:2014-2016年中国甲醇装置开工率
图:2010-2017年中国甲醇产量
表:2010-2021年中国甲醇供需平衡表
图:2016年中国主要地区甲醇价格走势
图:2016年甲醇期货活跃合约收盘价格
表:2016年中国甲醇企业TOP20(按产量)
表:2016年中国丙烯酸及酯暂停生产企业
表:2008-2021年中国丙烯酸供需分析
表:截至2017年6月底中国丙烯酸及酯(分企业/分产品)产能
图:2013-2016年中国丙烯酸及酯价格走势
图:2016-2017年中国丙烯酸价格
图:减水剂合成工艺
表:2011-2017年中国减水剂(分产品)产量
图:2007-2017年中国聚羧酸减水剂消费量及增长率
图:2006-2017年中国聚羧酸减水剂市场占有率(按消费量)
表:2016年中国TOP10聚羧酸减水剂生产企业销量与产能
表:2016年中国TOP10生产商聚羧酸减水剂销售额、单价和市场占有率
表:2016年中国聚羧酸减水剂出口企业TOP10
图:2010-2021年中国表面活性剂产量及增速
图:2016年中国表面活性剂(分产品)产量构成
图:2010-2021年中国非离子表面活性剂产量及增速
图:2016年中国非离子表面活性剂(分产品)产量构成
图:2010-2021年中国非离子表面活性剂表观消费量
图:2009-2016年中国非离子表面活性剂进出口量
图:2009-2016年中国非离子表面活性剂进出口单价
图:2016年中国非离子表面活性剂(分国家)进口量构成
图:2016年中国非离子表面活性剂(分地区)出口量构成
图:陶氏与杜邦合并
图:2017-2022年陶氏化学发展战略
图:2011-2017年陶氏化学销售收入与净利润
图:2014-2017年美国陶氏化学(分部门)销售额占比
图:2012-2017年陶氏化学高性能材料及化学品部门销售额及EBITDA
图:2016年陶氏化学高性能材料及化学品部门(分业务/分地区)销售额构成
图:2017Q1年陶氏化学高性能材料及化学品部门业务发展情况
图:2016年陶氏化学高性能材料及化学品部门(分产品)销售额占比
图:2011-2017年科莱恩销售收入与净利润
图:2016年科莱恩(分货币)销售额构成
图:2016年科莱恩(分地区)销售额及同比增长
表:科莱恩分部业务简介
图:2013-2017年科莱恩(分业务)销售额占比
图:2012-2017年科莱恩Care Chemicals销售收入及EBITDA
图:2012-2017年科莱恩Natural Resources销售收入及EBITDA
表:2017年克莱恩在华主要子公司
表:2017年克莱恩在华主要子公司业务
图:Lotte公司主要子公司分布
图:Lotte公司全球布局
图:2011-2017年Lotte销售收入与净利润
图:2016年Lotte(分地区)销售额
表:Lotte业务部门及主要产品
图:2016年Lotte(分业务)销售收入占比
图:2017年Lotte主营产品及产能
表:2017年Lotte在建项目情况
表:2017年Lotte在华主要子公司
图:2011-2017年奥克股份营业收入与净利润
图:2013-2016年奥克股份(分产品)主营业务收入
图:2013-2016年奥克股份(分产品)营业收入构成
图:2012-2016年奥克股份(分地区)主营业务收入
图:2012-2016年奥克股份(分地区)营业收入占比
图:2011-2016年奥克股份(分产品)毛利率
图:2013-2016年奥克股份研发投入及占比
图:奥克股份业务定位图
图:2011-2016年奥克股份聚醚单体产销量
表:2016年奥克股聚醚单体相关业务子公司介绍
表:2016年奥克股份环氧乙烷深加工业务相关子公司营业收入及净利润
表:截至2016年底奥克股份重大建设项目进展情况
表:截至2017年6月底奥克股份环氧乙烷衍生物产品产能
图:2011-2017年科隆股份营业收入和净利润
表:2015-2016年科隆股份(分产品)营业收入及占比
图:2012-2016年科隆股份(分地区)营业收入
表:2012-2016科隆股份(分地区)营业收入占比
图:2013-2016年科隆股份研发支出及其占营业收入的比例
表:2013-2016年科隆股份聚醚单体产能、收入及毛利率
表:2011-2016年科隆股份混凝土外加剂行业(分产品)产销量
表:2011-2017年科隆股份聚羧酸减水剂产品产量、产能和产能利用率
图:2011-2016年科隆股份晶硅切割液产销量
表:2011-2016年科隆股份环氧乙烷衍生物产品产量、产能和产能利用率
表:2016年底科隆股份主要在建项目情况
图:2014-2017年皇马科技营业收入和净利润
表:2014-2016年皇马科技(分产品)营业收入与占比
表:2014-2016年皇马科技(分地区)营业收入与占比
图:2014-2016年皇马科技(分产品)毛利率
表:2014-2016年皇马科技(分产品)产销量与产销率
表:2014-2016年皇马科技聚醚单体产能、产销量与产销率
表:2014-2016年皇马科技聚醚单体产品收入及单价
图:皇马科技减水剂产品销售单价
图:2014-2016年皇马科技聚醚单体产品毛利润与毛利率
表:2014-2016年皇马科技聚醚单体产品(分地区)收入及占比
表:2016年皇马科技聚醚单体业务前十大客户及收入贡献
表:浙江皇马聚乙二醇单甲醚MPEG系列产品
表:浙江皇马烯丙基聚氧乙烯APEG系列产品
表:浙江皇马甲氧基聚乙二醇甲基丙烯酸酯产品
表:截至2017年6月皇马科技主要在建项目
图:2014-2016年皇马科技研发投入与占比
表:上海台界高稳定性HPEG系列产品
表:上海台界聚乙二醇单甲醚MPEG系列产品
表:上海台界烯丙基聚氧乙烯APEG系列产品
图:佳化化学生产基地分布
图:佳化化学全球销售网络布局
图:2011-2016年佳化化学营业收入与净利润
表:2014-2016年佳化化学(分产品)主营业务收入及占比
表:2014-2016年佳化化学(分地区)主营业务收入及占比
图:2014-2016年佳化化学(分产品)毛利率
图:2011-2016年佳化化学研发支出及其占营业收入的比例
表:2014-2016年佳化化学建筑化学品产销量与产销率
表:2014-2016年佳化化学建筑化学品销量、收入与单价
表:威尔化工万吨封端醚项目相关产品及产能
表:威尔化工MPEG系列产品
表:威尔化工丙烯醇醚系列产品
表:截至2016年江苏苏博特主要产品产能
表:江苏苏博特产品应用范例
图:2009-2017年建研集团营业收入和净利润
表:2012-2016年建研集团(分产品)营业收入
图:2012-2016年建研集团(分产品)营业收入占比
表:2012-2016年建研集团(分地区)营业收入
图:2012-2016年建研集团(分地区)营业收入构成
图:2012-2016年建研集团(分产品)毛利率
图:2011-2016年建研集团研发支出及其占营业收入的比例
图:2011-2016年建研集团外加剂业务收入及净利润
图:2009-2016年建研集团外加剂销量
表:2016年建研集团外加剂产品子公司及其营业收入、净利润
图:2010-2016年华伟银凯营业收入与营业利润
图:2010-2016年华伟银凯(分产品)营业收入
图:2010-2016年华伟银凯(分产品)营业收入占比
图:2010-2016年华伟银凯聚羧酸减水剂营业收入与毛利率
Comparison of Merits and Demerits of Various Polyether Monomers in Superplasticizer Field
Polyether Monomer (MPEG/TPEG/APEG) Industry Chain
Development History of Polyether Monomer Structure
Share of Three Major Polyether Monomers in Chinese Polycarboxylate Superplasticizer Market, 2010-2016
Volume of Superplasticizer-used Polyether Monomer in China, 2009-2016
Import and Export Volume of Superplasticizer-used Polyether Monomer in China, 2009-2017
Superplasticizer-used Polyether Monomer Demand Structure in China by Region, 2016
Polyether Monomer Demand Structure in China by Province/Municipality, 2016
Superplasticizer-used Polyether Monomer Output Structure in China by Province/Municipality, 2016
Market Share of TOP10 Superplasticizer-used Polyether Monomer Producers in China by Output, 2016
TOP35 Superplasticizer-used Polyether Monomer Producers and Their Output in China, 2016
Price Trend of Polyether Monomer in China, 2011-2017
Price Trend of Polyether Monomer APEG in China, 2013-2017
Price Trend of Polyether Monomer TPEG (4C) in China, 2013-2017
Price Trend of Polyether Monomer TPEG (5C) in China, 2013-2016
Price Trend of Polyether Monomer MPEG in China, 2013-2016
Volume of Superplasticizer-used Polyether Monomer in China, 2017-2021E
Market Share of Three Major Superplasticizer-used Polyether Monomers in China, 2021E
Output of Ethylene Oxide and Commercial Ethylene Oxide in China, 2012-2021E
Commercial Ethylene Oxide Capacity Structure in China by Region, 2016
Capacity of Ethylene Oxide and Commercial Ethylene Oxide in China by Enterprise by the End of 2016
Ethylene Oxide Demand Structure in China by Product, 2011/2016/2021E
Competitive Pattern of Ethylene Oxide Market in China, 2016
Competitive Pattern of Commercial Ethylene Oxide Market in China, 2016
Average Market Price of Ethylene Oxide in China, 2006-2017
Methanol Capacity in China, 2010-2017
Methanol Capacity Structure in China by Raw Material, 2016
Operating Rate of Methanol Plants in China, 2014-2016
Methanol Output in China, 2010-2017
Supply and Demand of Methanol in China, 2010-2021E
Price Trend of Methanol in China by Region, 2016
Closing Price of Active Methanol Futures Contract in China, 2016
TOP20 Methanol Companies in China by Output, 2016
Acrylic Acid and Ester Producers in Suspension of Production in China, 2016
Supply and Demand of Acrylic Acid in China, 2008-2021E
Acrylic Acid and Ester Capacity in China by Enterprise/Product as of June 2017
Price Trend of Acrylic Acid and Ester in China, 2013-2016
Price of Acrylic Acid in China, 2016-2017
Synthesis Technologies of Superplasticizer
Superplasticizer Output in China by Product, 2011-2017
Polycarboxylate Superplasticizer Consumption and YoY Growth in China, 2007-2017
Market Share of Polycarboxylate Superplasticizer in China by Consumption, 2006-2017
Sales Volume and Capacity of TOP10 Polycarboxylate Superplasticizer Producers in China, 2016
Revenue, Unit Price and Market Share of TOP10 Polycarboxylate Superplasticizer Producers in China, 2016
TOP10 Polycarboxylate Superplasticizer Exporters in China, 2016
Surfactant Output and YoY Growth in China, 2010-2021E
Surfactant Output Structure in China by Product, 2016
Non-ionic Surfactant Output and YoY Growth in China, 2010-2021E
Non-ionic Surfactant Output Structure in China by Product, 2016
Apparent Consumption of Non-ionic Surfactant in China, 2010-2021E
China’s Import and Export Volume of Non-ionic Surfactant, 2009-2016
China’s Import/Export Unit Price of Non-ionic Surfactant, 2009-2016
China's Non-ionic Surfactant Import Structure (by Country), 2016
China's Non-ionic Surfactant Export Structure (by Region), 2016
Merger of Dow Chemical and DuPont
Development Strategy of Dow Chemical, 2017-2022E
Revenue and Net Income of Dow Chemical, 2011-2017
Revenue Structure of Dow Chemical by Division, 2014-2017
Revenue and EBITDA of Dow Chemical’s Performance Materials & Chemicals Division, 2012-2017
Revenue Structure of Dow Chemical’s Performance Materials & Chemicals Division by Business/Region, 2016
Business Development of Dow Chemical’s Performance Materials & Chemicals Division, 2017Q1
Revenue Structure of Dow Chemical’s Performance Materials & Chemicals Division by Product, 2016
Revenue and Net Income of Clariant, 2011-2017
Revenue Structure of Clariant by Currency, 2016
Revenue and YoY Growth of Clariant by Region, 2016
Business Overview of Clariant by Division
Revenue Structure of Clariant by Business, 2013-2017
Revenue and EBITDA of Clariant - Care Chemicals, 2012-2017
Revenue and EBITDA of Clariant - Natural Resources, 2012-2017
Main Subsidiaries of Clariant in China, 2017
Business of Clariant's Main Subsidiaries in China, 2017
Distribution of Lotte’s Main Subsidiaries
Global Presence of Lotte
Revenue and Net Income of Lotte, 2011-2017
Revenue of Lotte by Region, 2016
Business Divisions and Main Products of Lotte
Revenue Structure of Lotte by Business, 2016
Main Products and Capacity of Lotte, 2017
Lotte’s Projects under Construction, 2017
Main Subsidiaries of Lotte in China, 2017
Revenue and Net Income of Liaoning Oxiranchem, 2011-2017
Operating Revenue of Liaoning Oxiranchem by Product, 2013-2016
Revenue Structure of Liaoning Oxiranchem by Product, 2013-2016
Operating Revenue of Liaoning Oxiranchem by Region, 2012-2016
Revenue Structure of Liaoning Oxiranchem by Region, 2012-2016
Gross Margin of Liaoning Oxiranchem by Product, 2011-2016
R&D Costs and % of Total Revenue of Liaoning Oxiranchem, 2013-2016
Business Positioning Map of Liaoning Oxiranchem
Output and Sales Volume of Polyether Monomers of Liaoning Oxiranchem, 2011-2016
Introduction to Polyether Monomer Related Subsidiaries of Liaoning Oxiranchem, 2016
Revenue and Net Income of Ethylene Oxide Deep-processing Related Subsidiaries of Liaoning Oxiranchem, 2016
Progress in Key Construction Projects of Liaoning Oxiranchem by the End of 2016
Capacity of Ethylene Oxide Derivatives of Liaoning Oxiranchem as of June 2017
Revenue and Net Income of Liaoning Kelong Fine Chemical, 2011-2017
Revenue Breakdown of Liaoning Kelong Fine Chemical by Product, 2015-2016
Revenue Breakdown of Liaoning Kelong Fine Chemical by Region, 2012-2016
Revenue Structure of Liaoning Kelong Fine Chemical by Region, 2012-2016
R&D Costs and % of Total Revenue of Liaoning Kelong Fine Chemical, 2013-2016
Capacity, Revenue and Gross Margin of Polyether Monomers of Liaoning Kelong Fine Chemical, 2013-2016
Output and Sales Volume of Concrete Admixtures of Liaoning Kelong Fine Chemical by Product, 2011-2016
Output, Capacity and Capacity Utilization of Polycarboxylate Superplasticizer Products of Liaoning Kelong Fine Chemical, 2011-2017
Output and Sales Volume of Crystalline Silicon Cutting Fluids of Liaoning Kelong Fine Chemical, 2011-2016
Output, Capacity and Capacity Utilization of Ethylene Oxide Derivatives of Liaoning Kelong Fine Chemical, 2011-2016
Main Projects under Construction of Liaoning Kelong Fine Chemical, 2016
Revenue and Net Income of Zhejiang Huangma Technology, 2014-2017
Revenue Breakdown of Zhejiang Huangma Technology by Product, 2014-2016
Revenue Breakdown of Zhejiang Huangma Technology by Region, 2014-2016
Gross Margin of Zhejiang Huangma Technology by Product, 2014-2016
Output, Sales Volume and Sales-output Ratio of Zhejiang Huangma Technology by Product, 2014-2016
Capacity, Output, Sales Volume and Sales-output Ratio of Polyether Monomers of Zhejiang Huangma Technology, 2014-2016
Revenue and Unit Price of Polyether Monomers of Zhejiang Huangma Technology, 2014-2016
Unit Sales Price of Superplasticizer Products of Zhejiang Huangma Technology
Gross Profit and Gross Margin of Polyether Monomers of Zhejiang Huangma Technology, 2014-2016
Revenue Breakdown of Polyether Monomers of Zhejiang Huangma Technology by Region, 2014-2016
TOP10 Customers for Polyether Monomers of Zhejiang Huangma Technology and Their Revenue Contribution, 2016
MPEG Series of Zhejiang Huangma Technology
APEG Series of Zhejiang Huangma Technology
MPEGMA Products of Zhejiang Huangma Technology
Main Projects under Construction of Zhejiang Huangma Technology as of June 2017
R&D Costs and % of Total Revenue of Zhejiang Huangma Technology, 2014-2016
High Stability HPEG Series of Shanghai Taijie Chemical
MPEG Series of Shanghai Taijie Chemical
APEG Series of Shanghai Taijie Chemical
Distribution of Production Bases of Jiahua Chemicals
Global Marketing Network of Jiahua Chemicals
Revenue and Net Income of Jiahua Chemicals, 2011-2016
Operating Revenue of Jiahua Chemicals by Product, 2014-2016
Operating Revenue of Jiahua Chemicals by Region, 2014-2016
Gross Margin of Jiahua Chemicals by Product, 2014-2016
R&D Costs and % of Total Revenue of Jiahua Chemicals, 2011-2016
Output, Sales Volume and Sales-output Ratio of Construction Chemicals of Jiahua Chemicals, 2014-2016
Sales Volume, Revenue and Unit Price of Construction Chemicals of Jiahua Chemicals, 2014-2016
Products and Capacity of 10 kt/a Terminated Ether Project of Nanjing Well Chemical
MPEG Series of Nanjing Well Chemical
Allyl Alcohol Ether Series of Nanjing Well Chemical
Capacity of Main Products of Sobute New Materials by the End of 2016
Product Application Cases of Sobute New Materials
Revenue and Net Income of Xiamen Academy of Building Research Group, 2009-2017
Revenue of Xiamen Academy of Building Research Group by Product, 2012-2016
Revenue Structure of Xiamen Academy of Building Research Group by Product, 2012-2016
Revenue of Xiamen Academy of Building Research Group by Region, 2012-2016
Revenue Structure of Xiamen Academy of Building Research Group by Region, 2012-2016
Gross Margin of Xiamen Academy of Building Research Group by Product, 2012-2016
R&D Costs and % of Total Revenue of Xiamen Academy of Building Research Group, 2011-2016
Revenue and Net Income of Admixture Business of Xiamen Academy of Building Research Group, 2011-2016
Sales Volume of Admixtures of Xiamen Academy of Building Research Group, 2009-2016
Admixture Subsidiaries, and Their Revenue and Net Income of Xiamen Academy of Building Research Group, 2016
Revenue and Operating Income of Shandong Huawei Yinkai Building Material Technology, 2010-2016
Revenue of Shandong Huawei Yinkai Building Material Technology by Product, 2010-2016
Revenue Structure of Shandong Huawei Yinkai Building Material Technology by Product, 2010-2016
Revenue and Gross Margin of Polycarboxylate Superplasticizer of Shandong Huawei Yinkai Building Material Technology, 2010-2016
如果这份报告不能满足您的要求,我们还可以为您定制报告,请 留言说明您的详细需求。
|