|
|
|
报告导航:研究报告—
农业与食品—农业
|
|
2017-2021年中国合成橡胶行业研究报告 |
 |
字数:3.6万 |
页数:145 |
图表数:161 |
|
中文电子版:10000元 |
中文纸版:5000元 |
中文(电子+纸)版:10500元 |
|
英文电子版:2800美元 |
英文纸版:3000美元 |
英文(电子+纸)版:3100美元 |
|
编号:CYH065
|
发布日期:2017-08 |
附件:下载 |
 |
|
|
合成橡胶是重要的战略物资之一,主要应用于轮胎等行业。2016年全球合成橡胶产量和消费量分别达1482.2万吨和1493.6万吨,分别同比增长2.2%和2.0%;在汽车和轮胎行业平稳发展的拉动下,预计至2021年其产量和消费量分别有望达到1697.5万吨和1772.5万吨。
中国是全球合成橡胶最大的生产国,2016年其产量为545.8万吨,占全球总产量的36.8%。预计2017-2021年中国合成橡胶产量保持年均5.2%的速度增长,至2021年有望达703.2万吨,占全球总产量比重提升至41.4%。
丁苯橡胶和顺丁橡胶是中国布局最多的两类产品,2016年,其产能合计占中国总产能的60.1%;而乙丙橡胶和丁基橡胶是近五年来产能增速最快的两大类产品,2012-2016年其产能复合增长率达69.5%和37.7%。未来随着中国轮胎等橡胶产品品种结构的不断优化,溶聚丁苯橡胶、卤化丁基橡胶、稀土顺丁橡胶以及低顺式聚丁二烯橡胶以及更多环保型橡胶产品的需求将会明显增加。
价格方面,2016年,受原材料丁二烯价格上涨等因素影响,中国主要合成橡胶产品价格出现爆发性增长,一直延续至2017年2月,此后随着丁二烯价格下滑合成橡胶价格也出现下滑,预计7月后有望震荡恢复,幅度有限。
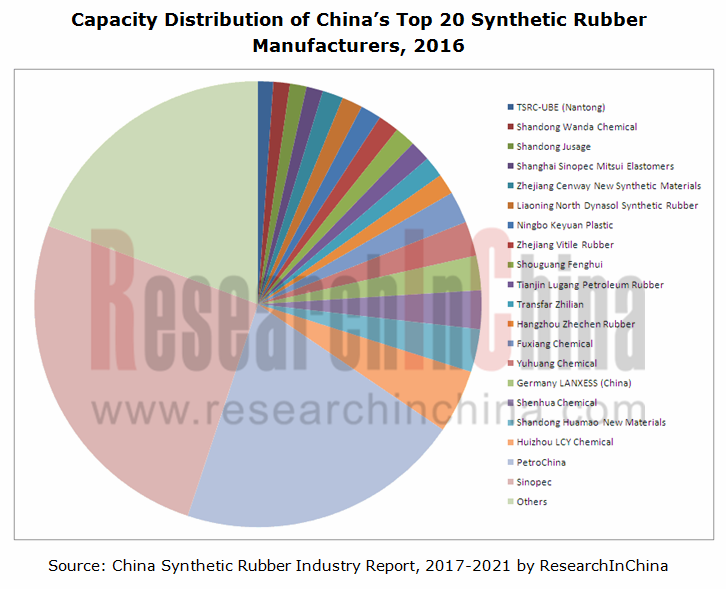
企业格局方面,截至2016年底,中国合成橡胶生产商增长至50多家,其总产能达647.5万吨/年。其中国石化和中国石油仍是中国合成橡胶前两大生产商,2016年其合计产能占中国总产能的46.2%。除此,惠州李长荣化工、华懋新材料、申华化工、玉皇化工、德国朗盛、台橡宇部等台资、外资和民营资本也纷纷进入该领域。
由于新注入企业大多以丁苯橡胶和顺丁橡胶为主,且集中于中低端产品,随着新增产能的释放,中国合成橡胶出现严重的结构性产能过剩问题。再加之,近两年合成橡胶行业景气度下滑、价格疲软以及原材料供应紧张等,一些企业加快了产品结构改造,一些则出现装置停产、拆除等状况。2016年9月,高桥石化宣布拆除运行多年的12万吨/年的顺丁橡胶装置;玉皇化工宣布将8万吨/年顺丁橡胶装置改产为SBS装置。预计未来几年,中国去产能趋势明显,同时新增产能多以SBS及环保型橡胶为主。

水清木华研究中心《2017-2021年中国合成橡胶行业研究报告》着重研究了以下内容:  全球合成橡胶市场供需、产品结构、地区结构及发展趋势等; 中国合成橡胶市场供需、进出口、产品结构、地区结构、企业格局及发展趋势等; 丁顺橡胶、丁苯橡胶、丁基橡胶、乙丙橡胶和丁腈橡胶等中国合成橡胶主要细分产 品市场供需、进出口、企业格局等市场发展情况。 中国丁二烯、苯乙烯和橡胶助剂等合成橡胶主要原材料市场发展情况; 合成橡胶主要下游行业轮胎全球及中国的市场发展情况等; 中国21家合成橡胶重点企业经营情况及发展战略等。
Synthetic rubber is one of important strategic materials, mainly used in tyres and other industries. In 2016, the global output and consumption of synthetic rubber reached 14.822 million tons and 14.936 million tons, respectively, up 2.2% and 2.0% year on year. Driven by the steady development of automobile and tyre industries, the world’s output and consumption of synthetic rubber are expected to hit 16.975 million tons and 17.725 million tons by 2021 respectively.
China, the world's largest producer of synthetic rubber, boasted the output of 5.458 million tons in 2016, accounting for 36.8% of the global output. China's synthetic rubber output is expected to grow at an average annual rate of 5.2% from 2017 to 2021 and reach 7.032 million tons in 2021, equivalent to 41.4% of the world's total output.
In 2016, the combined capacity of styrene butadiene rubber (SBR) and cis-polybutadiene rubber (BR) which are the two most popular products in China shared 60.1% of China's total capacity. Ethylene propylene rubber (EPR) and Isobutylene Isoprene Rubber (IIR) saw the fastest growth rates in the past five years, with the respective capacity CAGR of 69.5% and 37.7% during 2012-2016. With the continuous optimization of the rubber product (such as tyres) structure in China, the demand for solution polymerized styrene butadiene rubber (SSBR), halogenated butyl rubber (HIIR), neodymium polybutadiene rubber (Nd-BR), low cis-polybutadiene rubber (LCBR) and other environment-friendly rubber products will increase significantly in future.
In terms of prices, the rising price of the raw material butadiene and other factors spurred the explosive growth in the prices of China's major synthetic rubber products from 2016 to February 2017. Later, the synthetic rubber price fell with the lower butadiene price, but it may restore limited growth in fluctuations after July.
As for the enterprise pattern, there were more than 50 synthetic rubber manufacturers in China with the total capacity of 6.475 million t/a as of the end of 2016. Among them, the top two giants Sinopec and PetroChina contributed 46.2% to China's total synthetic rubber capacity together in 2016. In addition, Huizhou LCY Chemical, Shandong Huamao New Materials, Shenhua Chemical, Yuhuang Chemical, Germany LANXESS, TSRC-UBE and other Taiwanese, foreign and private companies have also entered the field.
As new entrants mostly focus on medium and low-end styrene butadiene rubber and cis-polybutadiene rubber (BR) products, China witnesses serious structural overcapacity of synthetic rubber with the release of new capacity. In the past two years, given the low prosperity index and depressed price of synthetic rubber as well as the tight supply of raw materials, some enterprises have sped up the reform of their product mix, while some other companies have shut down and dismantled facilities. In September 2016, Sinopec Shanghai Gaoqiao announced the removal of the 120,000 t/a cis-polybutadiene rubber (BR) plant which had run for many years; Yuhuang Chemical proclaimed the conversion of the 80,000 t/a cis-polybutadiene rubber (BR) facility into SBS facility. In the next few years, China's de-capacity trend will be more apparent and the new capacity will center on SBS and environment-friendly rubber.
The report covers the following:
 Supply and demand, product structure, regional structure, development trend, etc. of global synthetic rubber market; Supply and demand, product structure, regional structure, development trend, etc. of global synthetic rubber market;
Supply and demand, import and export, product structure, regional structure, enterprise pattern, development trend, etc. of Chinese synthetic rubber market;
Market supply and demand, import and export, enterprise pattern and other market situations of major Chinese synthetic rubber products (BR, SBR, IIR, EPR, NBR, etc.);
Development of main raw materials of synthetic rubber (butadiene, styrene, rubber additive, etc.) in China;
Development of global and China tyre (downstream sector of synthetic rubber) industry;
Operation, development strategy, etc. of 21 major Chinese synthetic rubber manufacturers.
第一章 合成橡胶概述
1.1 定义
1.2 分类
1.3 产业链
第二章 全球合成橡胶行业发展概况
2.1 概述
2.2 市场供需
2.3 地区结构
2.4 发展趋势
第三章 中国合成橡胶行业发展概况
3.1 市场供需
3.1.1 市场供给
3.1.2 市场需求
3.2 进出口
3.2.1 进口
3.2.2 出口
3.3 产品结构
3.4 地区分布
3.5 企业格局
3.6 发展趋势
第四章 中国合成橡胶重点细分市场
4.1 顺丁橡胶
4.1.1 市场供给
4.1.2 进出口
4.1.3 市场需求
4.1.4 竞争格局
4.1.5 价格
4.1.6 发展趋势
4.2 丁苯橡胶
4.2.1 市场供给
4.2.2 进出口
4.2..3 市场需求
4.2.4 竞争格局
4.2.5 价格
4.2.6 发展趋势
4.3 乙丙橡胶
4.3.1 市场供给
4.3.2 进出口
4.3.3 市场需求
4.3.4 竞争格局
4.3.5 价格
4.3.6 发展趋势
4.4 丁基橡胶
4.4.1 市场供给
4.4.2 进出口
4.4.3 市场需求
4.4.4 竞争格局
4.4.5 价格
4.4.6 发展趋势
4.5 丁腈橡胶
4.5.1 市场供给
4.5.2 进出口
4.5.3 市场需求
4.5.4 竞争格局
4.5.5 价格
4.5.6 发展趋势
第五章 中国合成橡胶上游分析
5.1 丁二烯
5.1.1 市场供给
5.1.2 进出口
5.1.3 市场需求
5.1.4 价格
5.1.5 竞争格局
5.1.6 发展趋势
5.2 苯乙烯
5.2.1 市场供给
5.2.2 进出口
5.2.3 市场需求
5.2.4 价格
5.2.5 竞争格局
5.2.6 发展趋势
5.3 橡胶助剂
5.3.1 市场供需
5.3.2 价格
5.3.3 企业格局
第六章 轮胎行业市场发展
6.1 全球市场
6.2 中国市场
第七章 中国合成橡胶重点企业
7.1 中国石化
7.1.1 企业简介
7.1.2 经营情况
7.1.3 合成橡胶业务
7.1.4 扬子石化
7.1.5 燕山石化
7.1.6 齐鲁石化
7.1.7 茂名石化
7.1.8 巴陵石化
7.1.9 高桥石化
7.2 中国石油
7.2.1 企业简介
7.2.2 经营情况
7.2.3 合成橡胶业务
7.2.4 兰州石化
7.2.5 吉林石化
7.2.6 大庆石化
7.2.7 独山子石化
7.2.8 锦州石化
7.2.9 抚顺石化
7.2.10 四川石化
7.3 玉皇化工
7.3.1 企业简介
7.3.2 经营情况
7.3.3 合成橡胶业务
7.4 台橡股份
7.4.1 企业简介
7.4.2 经营情况
7.4.3 合成橡胶业务
7.5 蓝德精化
7.5.1 公司简介
7.5.2 经营情况
7.6 镇江南帝化工
7.6.1 企业简介
7.6.2 经营情况
7.7 其他企业
7.7.1 高桥巴斯夫分散体
7.7.2 山西合成橡胶
7.7.3 陶氏化学(张家港)
7.7.4普利司通(惠州)
7.7.5 杭州浙晨橡胶
7.7.6 天津市陆港石油橡胶
7.7.7 福建湄洲湾氯碱工业
7.7.8 浙江信汇合成材料
7.7.9 重庆化医长寿化工
7.7.10 盘锦和运新材料有限公司
7.7.11 山东华懋新材料
7.7.12 青岛伊科思
7.7.13 宁波顺泽橡胶
7.7.14 山东聚圣科技有限公司
7.7.15 辽宁北方戴纳索合成橡胶
1 Overview of Synthetic Rubber
1.1 Definition
1.2 Classification
1.3 Industrial Chain
2 Overview of Global Synthetic Rubber Industry
2.1 Overview
2.2 Market Supply and Demand
2.3 Regional Structure
2.4 Development Trend
3 Overview of China Synthetic Rubber Industry
3.1 Market Supply and Demand
3.1.1 Market Supply
3.1.2 Market Demand
3.2 Import and Export
3.2.1 Import
3.2.2 Export
3.3 Product Structure
3.4 Regional Distribution
3.5 Enterprise Pattern
3.6 Development Trend
4 Key Chinese Synthetic Rubber Market Segments
4.1 Cis-Polybutadiene Rubber (BR)
4.1.1 Market Supply
4.1.2 Import and Export
4.1.3 Market Demand
4.1.4 Competitive Landscape
4.1.5 Price
4.1.6 Development Trend
4.2 Styrene Butadiene Rubber (SBR)
4.2.1 Market Supply
4.2.2 Import and Export
4.2.3 Market Demand
4.2.4 Competitive Landscape
4.2.5 Price
4.2.6 Development Trend
4.3 Ethylene Propylene Rubber (EPR)
4.3.1 Market Supply
4.3.2 Import and Export
4.3.3 Market Demand
4.3.4 Competitive Landscape
4.3.5 Price
4.3.6 Development Trend
4.4 Isobutylene Isoprene Rubber (IIR)
4.4.1 Market Supply
4.4.2 Import and Export
4.4.3 Market Demand
4.4.4 Competitive Landscape
4.4.5 Price
4.4.6 Development Trend
4.5 Nitrile-butadiene rubber (NBR)
4.5.1 Market Supply
4.5.2 Import and Export
4.5.3 Market Demand
4.5.4 Competitive Landscape
4.5.5 Price
4.5.6 Development Trend
5 Upstream of Synthetic Rubber in China
5.1 Butadiene
5.1.1 Market Supply
5.1.2 Import and Export
5.1.3 Market Demand
5.1.4 Price
5.1.5 Competitive Landscape
5.1.6 Development Trend
5.2 Styrene
5.2.1 Market Supply
5.2.2 Import and Export
5.2.3 Market Demand
5.2.4 Price
5.2.5 Competitive Landscape
5.2.6 Development Trend
5.3 Rubber Additive
5.3.1 Market Supply and Demand
5.3.2 Price
5.3.3 Enterprise Pattern
6 Tyre Market Development
6.1 Global
6.2 China
7 Key Chinese Synthetic Rubber Enterprises
7.1 Sinopec
7.1.1 Profile
7.1.2 Operation
7.1.3 Synthetic Rubber Business
7.1.4 YPC (Nanjing) Rubber
7.1.5 Sinopec Beijing Yanshan
7.1.6 Sinopec Qilu
7.1.7 Sinopec Maoming
7.1.8 Sinopec Baling
7.1.9 Sinopec Shanghai Gaoqiao
7.2 PetroChina
7.2.1 Profile
7.2.2 Operation
7.2.3 Synthetic Rubber Business
7.2.4 PetroChina Lanzhou Petrochemical
7.2.5 PetroChina Jilin Petrochemical
7.2.6 PetroChina Daqing Petrochemical
7.2.7 PetroChina Dushanzi Petrochemical
7.2.8 PetroChina Jinzhou Petrochemical
7.2.9 PetroChina Fushun Petrochemical
7.2.10 PetroChina Sichuan Petrochemical
7.3 Shandong Yuhuang Chemical (Group)
7.3.1 Profile
7.3.2 Operation
7.3.3 Synthetic Rubber Business
7.4 TSRC
7.4.1 Profile
7.4.2 Operation
7.4.3 Synthetic Rubber Business
7.5 Lande Fine Chemical
7.5.1 Profile
7.5.2 Operation
7.6 Zhenjiang Nantex Chemical Industry
7.6.1 Profile
7.6.2 Operation
7.7 Other Enterprises
7.7.1 Gaoqiao BASF Dispersions
7.7.2 Shanxi Synthetic Rubber
7.7.3 Dow Chemical (Zhangjiagang)
7.7.4 Bridgestone (Huizhou)
7.7.5 Hangzhou Zhechen Rubber
7.7.6 Tianjin Lugang Petroleum Rubber
7.7.7 Fujian Meizhouwan Chlor-Alkali Industry
7.7.8 Zhejiang Cenway New Synthetic Materials
7.7.9 Chongqing Changshou Chemical
7.7.10 Panjin Heyun New Materials
7.7.11 Shandong Huamao New Materials
7.7.12 Qingdao ECO-Strong Tech. Eng.
7.7.13 Ningbo Shunze Rubber
7.7.14 Shandong Jusage
7.7.15 Liaoning North Dynasol Synthetic Rubber
图:合成橡胶产业链
图:2011-2017年全球合成橡胶产能
图:2007-2016年全球合成橡胶产量及消费量
图:2007-2016年全球合成橡胶产量及消费量占比
图:2016年全球合成橡胶(分产品)产能构成
图:2010-2016年全球(分地区)合成橡胶产能
图:2008-2016年全球(分地区)合成橡胶产量
图:2008-2016年全球(分地区)合成橡胶消费量
图:2015-2021年全球合成橡胶产量与消费量
图:2016年中国合成橡胶(分产品)全球产能占比
图:2013-2017年中国合成橡胶产能及同比增长
图:2007-2016年中国合成橡胶产量及同比增长
图:2007-2016年中国合成橡胶表观消费量及自给率
图:2007-2017年中国合成橡胶进口量及同比增长
图:2007-2017年中国合成橡胶进口额及同比增长
图:2007-2017年中国合成橡胶出口量及同比增长
图:2010-2017年中国合成橡胶出口额及同比增长
图:2012-2017年中国合成橡胶(分产品)产能
图:2014&2016年中国合成橡胶(分品种)产量
图:2016年中国合成橡胶(按产量)前十强省份
图:2017年1-5月中国合成橡胶(按产量)前十强省份
图:2014-2021年中国合成橡胶(分产品)产量
图:2007-2017年中国顺丁橡胶产能及同比增长
图:2007-2017年中国顺丁橡胶产量及同比增长
图:2016-2017年中国顺丁橡胶开工率
图:2007-2017年中国顺丁橡胶进口量及同比增长
图:2007-2017年中国顺丁橡胶出口量及同比增长
图:2007-2017年中国顺丁橡胶表观消费量与自给率
图:2011-2017年中国顺丁橡胶(分用途)需求量占比
图:2017年中国顺丁橡胶(按产能)企业格局
图:2007-2017年中国顺丁橡胶市场价格走势
图:2007-2017年中国丁苯橡胶(分产品)产能
图:2007-2017年中国丁苯橡胶产量及同比增长
图:2010-2016年中国丁苯橡胶进口量及同比增长
图:2010-2016年中国丁苯橡胶出口量及同比增长
图:2007-2017年中国丁苯橡胶表观消费量与自给率
图:2017年中国丁苯橡胶(分用途)需求量占比
图:2016-2017年中国丁苯橡胶(按产能)各企业市场份额
图:2012-2017年中国丁苯橡胶周度市场均价
图:2007-2017年中国乙丙橡胶产量及同比增长
图:2007-2016年中国乙丙橡胶进口量及同比增长
图:2007-2016年中国乙丙橡胶出口量及同比增长
图:2007-2017年中国乙丙橡胶表观消费量与自给率
图:2017年中国乙丙橡胶(分用途)需求量占比
图:2016-2017年中国三元乙丙橡胶(分产品)市场月度均价
图:2007-2017年中国丁基橡胶产量及同比增长
图:2007-2016年中国丁基橡胶进口量及同比增长
图:2007-2016年中国丁基橡胶出口量及同比增长
图:2007-2017年中国丁基橡胶表观消费量及自给率
图:2017年中国丁基橡胶(分用途)需求量占比
图:2016-2017年中国普通丁基橡胶市场价格走势
图:2016-2017年中国卤化丁基橡胶价格走势
图:2008-2017年中国丁腈橡胶产能及产能利用率
图:2007-2017年中国丁腈橡胶产量及同比增长
图:2007-2017年中国丁腈橡胶进口量及同比增长
图:2007-2017年中国丁腈橡胶出口量及同比增长
图:2007-2017年中国丁腈橡胶表观消费量与自给率
图:2016年中国丁腈橡胶(分用途)需求量占比
图:2016年中国丁腈橡胶(分企业)产能占比
图:2014-2017年中国丁腈橡胶价格走势
图:2017年中国丁腈橡胶价格走势
图:2010-2017年中国丁二烯产能及产能利用率
图:2007-2017年中国丁二烯产量及同比增长
图:2016年中国丁二烯生产工艺占比
图:2007-2016年中国丁二烯进口量及同比增长
图:2007-2016年中国丁二烯出口量及同比增长
图:2007-2017年中国丁二烯表观消费量与自给率
图:2011-2017年丁二烯下游消费量统计
图:2016-2017年中国华东市场丁二烯价格走势
图:2017年中国丁二烯市场价格
图:2010-2017年中国丁二烯产能(分企业)结构
图:2010-2017年中国苯乙烯产能及产能利用率
图:2007-2017年中国苯乙烯产量及同比增长
图:2016年中国苯乙烯(分地区)产能分布
图:2007-2017年中国苯乙烯进口量及同比增长
图:2007-2016年中国苯乙烯进口额及同比增长
图:2007-2017年中国苯乙烯出口量及同比增长
图:2007-2016年中国丁腈橡胶出口额及同比增长
图:2007-2017年中国苯乙烯表观消费量及自给率
图:2017年中国苯乙烯(分用途)需求量占比
图:2017年中国华东苯乙烯市场均价
图:2009-2021年中国橡胶助剂产量及同比增长
图:2016年中国橡胶助剂(分产品)产量
图:2017年中国橡胶助剂(分用途)需求量占比
图:2016-2017年中国橡胶助剂均价
图:2016年中国轮胎成本构成
图:2013-2020年全球轮胎市场规模
图:2014-2020年全球Car Tire市场规模
图:2017年全球轮胎出货量地域分布
图:2007-2016年中国汽车轮胎产量
图:2015-2016年中国全钢胎月度开工率
图:2015-2016年中国半钢胎月度开工率
图:2006-2016年中国轮胎外胎新增产能
图:2008-2017年中石化营业收入及同比增长
图:2008-2017年中石化净利润及同比增长
图:2010-2017年中石化(分行业)营业收入
图:2008-2016年中石化(分行业)毛利率
图:2008-2017年中石化合成橡胶产量及同比增长
图:2008-2016年中石化合成橡胶销量及同比增长
图:2008-2016年中石化合成橡胶销售额及同比增长
图:2005-2017年扬子石化橡胶公司发展大事件
表:扬子石化橡胶公司主要丁苯橡胶产品简介
图:2008-2017年中石油营业收入及同比增长
图:2008-2017年中石油净利润及同比增长
图:2008-2016年中石油(分行业)营业收入
图:2008-2016年中石油(分地区)营业收入
图:2008-2016年中石油(分行业)毛利率
图:2008-2017年中国石油合成橡胶产量及同比增长
图:2009-2016年玉皇化工公司营业收入与净利润
图:2009-2016年玉皇化工公司(分行业)营业收入
图:2009-2016年玉皇化工公司(分部门)毛利率
表:2010-2016年玉皇化工公司合成橡胶产能、产量和销量
图:2010-2016年玉皇化工合成橡胶销售收入及均价
图:2016年台橡集团子公司分布
The list of Subsidiaries of TSRC
图:2010-2016年台橡股份公司营业收入及净利润
图:2010-2016年台橡公司合成橡胶产能利用率
图:2008-2016年台橡股份公司合成橡胶(分地区)销量
图:2008-2016年台橡股份合成橡胶(分地区)营业收入
图:2009-2016年蓝德精细化工营业收入与净利润
图:2012-2016年镇江南帝化工营业收入及同比增长
表:合成橡胶(分品种)性能与应用
表:2015-2017年中国合成橡胶(分企业)产能
表:2016年中国合成橡胶前20大企业产能及占比
表:2017年以后中国主要合成橡胶产品扩产计划
表:2011-2021年中国合成橡胶产需平衡
表:2012-2017年中国顺丁橡胶(分企业)产能
表:2016年中国顺丁橡胶生产商TOP8产量及市场占有率(按产量)
表:2017年中国在拟建顺丁橡胶项目
表:2015-2021年中国顺丁橡胶供需平衡表
表:2012-2017年中国丁苯橡胶(分企业)产能
表:2015-2021年中国丁苯橡胶供需平衡情况
表:2012-2017年中国乙丙橡胶(分企业)产能分布
表:2017-2020年中国乙丙橡胶拟在建项目
表:2015-2021年中国乙丙橡胶供需情况
表:2012-2017年中国丁基橡胶(分企业)产能分布
表:2017年-2021年中国丁基橡胶在拟建项目
表:2015-2021年中国丁基橡胶供需平衡情况
表:2016年全球丁腈橡胶(分企业)产能及占比
表:2010-2016年中国丁腈橡胶(分产品)进出口量
表:2010-2017年中国丁腈橡胶(分企业)产能
表:2015-2021年中国丁腈橡胶供需平衡情况
表:2010-2017年中国丁二烯(分企业)产能分布
表:2017-2021年中国丁二烯在拟建项目
表:2015-2021年中国丁二烯供需情况
表:2010-2017年中国苯乙烯(分企业)产能分布
表:2017-2021年中国苯乙烯在拟建项目
表:2015-2021年中国苯乙烯供需平衡
表:2016年中国橡胶助剂企业TOP9(按收入)
表:2013-2016年中国15大轮胎企业产量
表:2016年中国主要轮胎企业轮胎价格上涨情况
表:2016年玉皇化工主要子公司分布
表:2013-2016年台橡股份(分产品)营业收入及占比
表:2014-2016年台橡股份供应商采购金额及占比
表:2013-2016年台橡股份(分产品)产能、产量及产值
表:2016年台橡股份(分企业/产品)合成橡胶产能
表:山纳公司氯丁橡胶产品简介
表:浙晨橡胶公司合成橡胶产品
表:天津陆港石油橡胶公司项目投资和产能
表:长寿化工氯丁橡胶产品简介
表:2016年宁波顺泽橡胶公司(分牌号)丁腈橡胶产品
Synthetic Rubber Industry Chain
Global Synthetic Rubber Capacity, 2011-2017
Global Synthetic Rubber Output and Consumption, 2007-2016
Global Synthetic Rubber Output and Consumption Structure, 2007-2016
Global Synthetic Rubber Capacity Structure (by Product), 2016
Global Synthetic Rubber Capacity (by Region), 2010-2016
Global Synthetic Rubber Output (by Region), 2008-2016
Global Synthetic Rubber Consumption (by Region), 2008-2016
Global Synthetic Rubber Output and Consumption, 2015-2021E
Global Share of China’s Synthetic Rubber Capacity (by Product), 2016
China’s Synthetic Rubber Capacity and YoY Growth, 2013-2017
China’s Synthetic Rubber Output and YoY Growth, 2007-2016
China’s Synthetic Rubber Apparent Consumption and Self-sufficiency Rate, 2007-2016
China’s Synthetic Rubber Import Volume and YoY Growth, 2007-2017
China’s Synthetic Rubber Import Value and YoY Growth, 2007-2017
China’s Synthetic Rubber Export Volume and YoY Growth, 2007-2017
China’s Synthetic Rubber Export Value and YoY Growth, 2010-2017
China’s Synthetic Rubber Capacity (by Product), 2012-2017
China’s Synthetic Rubber Output (by Variety), 2014&2016
Top 10 Synthetic Rubber Provinces in China (by Output), 2016
Top 10 Synthetic Rubber Provinces in China (by Output), Jan-May 2017
China’s Synthetic Rubber Output (by Product), 2014-2021E
China’s BR Capacity and YoY Growth, 2007-2017
China’s BR Output and YoY Growth, 2007-2017
China’s BR Operating Rate, 2016-2017
China’s BR Import Volume and YoY Growth, 2007-2017
China’s BR Export Volume and YoY Growth, 2007-2017
China’s BR Apparent Consumption and Self-sufficiency Rate, 2007-2017
China’s BR Demand Structure (by Purpose), 2011-2017
Pattern of BR Enterprises in China (by Capacity), 2017
China’s BR Market Price Trend, 2007-2017
China’s SBR Capacity (by Product), 2007-2017
China’s SBR Output and YoY Growth, 2007-2017
China’s SBR Import Volume and YoY Growth, 2010-2016
China’s SBR Export Volume and YoY Growth, 2010-2016
China’s SBR Apparent Consumption and Self-sufficiency Rate, 2007-2017
China’s SBR Demand Structure (by Purpose), 2017
Market Share of SBR Enterprises in China (by Capacity), 2016-2017
Weekly Market Average Price of SBR in China, 2012-2017
China’s EPR Output and YoY Growth, 2007-2017
China’s EPR Import Volume and YoY Growth, 2007-2016
China’s EPR Export Volume and YoY Growth, 2007-2016
China’s EPR Apparent Consumption and Self-sufficiency Rate, 2007-2017
China’s EPR Demand Structure (by Purpose), 2017
Monthly Market Average Price of EPDM in China (by Product), 2016-2017
China’s IIR Output and YoY Growth, 2007-2017
China’s IIR Import Volume and YoY Growth, 2007-2016
China’s IIR Export Volume and YoY Growth, 2007-2016
China’s IIR Apparent Consumption and Self-sufficiency Rate, 2007-2017
China’s IIR Demand Structure (by Purpose), 2017
Market Price Trend of Ordinary IIR in China, 2016-2017
Price Trend of HIIR in China, 2016-2017
China’s NBR Capacity and Capacity Utilization, 2008-2017
China’s NBR Output and YoY Growth, 2007-2017
China’s NBR Import Volume and YoY Growth, 2007-2017
China’s NBR Export Volume and YoY Growth, 2007-2017
China’s NBR Apparent Consumption and Self-sufficiency Rate, 2007-2017
China’s NBR Demand Structure (by Purpose), 2016
China’s NBR Capacity Structure (by Enterprise), 2016
China’s NBR Price Trend, 2014-2017
China’s NBR Price Trend, 2017
China’s Butadiene Capacity and Capacity Utilization, 2010-2017
China’s Butadiene Output and YoY Growth, 2007-2017
China’s Butadiene Production Process Structure, 2016
China’s Butadiene Import Volume and YoY Growth, 2007-2016
China’s Butadiene Export Volume and YoY Growth, 2007-2016
China’s Butadiene Apparent Consumption and Self-sufficiency Rate, 2007-2017
Downstream Consumption of Butadiene, 2011-2017
Price Trend of Butadiene in East China, 2016-2017
China’s Butadiene Market Price, 2017
China’s Butadiene Capacity Structure (by Enterprise), 2010-2017
China’s Styrene Capacity and Capacity Utilization, 2010-2017
China’s Styrene Output and YoY Growth, 2007-2017
China’s Styrene Capacity Distribution (by Region), 2016
China’s Styrene Import Volume and YoY Growth, 2007-2017
China’s Styrene Import Value and YoY Growth, 2007-2016
China’s Styrene Export Volume and YoY Growth, 2007-2017
China’s NBR Export Value and YoY Growth, 2007-2016
China’s Styrene Apparent Consumption and Self-sufficiency Rate, 2007-2017
China’s Styrene Demand Structure (by Purpose), 2017
Styrene Market Average Price in East China, 2017
China’s Rubber Additive Output and YoY Growth, 2009-2021E
China’s Rubber Additive Output (by Product), 2016
China’s Rubber Additive Demand Structure (by Purpose), 2017
Average Price of Rubber Additive in China, 2016-2017
China’s Tyre Cost Structure, 2016
Global Tyre Market Size, 2013-2020E
Global Car Tyre Market Size, 2014-2020E
Geographical Distribution of Global Tyre Shipments, 2017
China’s Car Tyre Output, 2007-2016
Monthly Operating Rate of Full-steel Tyres in China, 2015-2016
Monthly Operating Rate of Semi-steel Tyres in China, 2015-2016
New Capacity of Tyre Outer Cover in China, 2006-2016
Sinopec’s Revenue and YoY Growth, 2008-2017
Sinopec’s Net Income and YoY Growth, 2008-2017
Sinopec’s Revenue (by Sector), 2010-2017
Sinopec’s Gross Margin (by Sector), 2008-2016
Sinopec’s Synthetic Rubber Output and YoY Growth, 2008-2017
Sinopec’s Synthetic Rubber Sales Volume and YoY Growth, 2008-2016
Sinopec’s Synthetic Rubber Revenue and YoY Growth, 2008-2016
Milestones of YPC (Nanjing) Rubber, 2005-2017
Main SBR Products of YPC (Nanjing) Rubber
PetroChina’s Revenue and YoY Growth, 2008-2017
PetroChina’s Net Income and YoY Growth, 2008-2017
PetroChina’s Revenue (by Sector), 2008-2016
PetroChina’s Revenue (by Region), 2008-2016
PetroChina’s Gross Margin (by Sector), 2008-2016
PetroChina’s Synthetic Rubber Output and YoY Growth, 2008-2017
Revenue and Net Income of Yuhuang Chemical, 2009-2016
Revenue of Yuhuang Chemical (by Sector), 2009-2016
Gross Margin of Yuhuang Chemical (by Division), 2009-2016
Synthetic Rubber Capacity, Output and Sales Volume of Yuhuang Chemical, 2010-2016
Synthetic Rubber Revenue and Average Price of Yuhuang Chemical, 2010-2016
Distribution of TSRC’s Subsidiaries, 2016
List of TSRC’s Subsidiaries
TSRC’s Revenue and Net Income, 2010-2016
TSRC’s Synthetic Rubber Capacity Utilization, 2010-2016
TSRC’s Synthetic Rubber Sales Volume (by Region), 2008-2016
TSRC’s Synthetic Rubber Revenue (by Region), 2008-2016
Revenue and Net Income of Lande Fine Chemical, 2009-2016
Revenue and YoY Growth of Zhenjiang Nantex Chemical Industry, 2012-2016
Properties and Applications of Synthetic Rubber (by Variety)
China’s Synthetic Rubber Capacity (by Enterprise), 2015-2017
Capacity and Share of Top 20 Synthetic Rubber Enterprises in China, 2016
China’s Expansion Plan for Main Synthetic Rubber Products, after 2017
Balance between China’s Synthetic Rubber Production and Demand, 2011-2021E
China’s BR Capacity (by Enterprise), 2012-2017
Output and Market Share of Top 8 BR Manufacturers in China (by Output), 2016
Ongoing and Proposed BR Projects in China, 2017
Balance between China’s BR Supply and Demand, 2015-2021E
China’s SBR Capacity (by Enterprise), 2012-2017
Balance between China’s SBR Supply and Demand, 2015-2021E
China’s EPR Capacity Distribution (by Enterprise), 2012-2017
Ongoing and Proposed EPR Projects in China, 2017-2020E
China’s EPR Supply and Demand, 2015-2021E
China’s IIR Capacity Distribution (by Enterprise), 2012-2017
Ongoing and Proposed IIR Projects in China, 2017 -2021E
Balance between China’s IIR Supply and Demand, 2015-2021E
Global NBR Capacity and Structure (by Enterprise), 2016
China’s NBR Import and Export Volume (by Product), 2010-2016
China’s NBR Capacity (by Enterprise), 2010-2017
Balance between China’s NBR Supply and Demand, 2015-2021E
China’s Butadiene Capacity Distribution (by Enterprise), 2010-2017
Ongoing and Proposed Butadiene Projects in China, 2017 -2021E
Butadiene Supply and Demand in China, 2015-2021E
China’s Styrene Capacity Distribution (by Enterprise), 2010-2017
Ongoing and Proposed Styrene Projects in China, 2017 -2021E
Balance between China’s Styrene Supply and Demand, 2015-2021E
Top 9 Rubber Additive Enterprises in China (by Revenue), 2016
Output of Top 15 Tyre Enterprises in China, 2013-2016
Tyre Prices of Major Tyre Enterprises in China, 2016
Distribution of Yuhuang Chemical’s Main Subsidiaries, 2016
TSRC’s Revenue Structure (by Product), 2013-2016
TSRC’s Procurement Structure by Supplier, 2014-2016
TSRC’s Capacity, Output and Output Value (by Product), 2013-2016
TSRC’s Synthetic Rubber Capacity (by Enterprise / Product), 2016
Neoprene Products of Shanna Synthetic Rubber
Synthetic Rubber Products of Hangzhou Zhechen Rubber
Project Investment and Capacity of Tianjin Lugang Petroleum Rubber
Neoprene Products of Chongqing Changshou Chemical
NBR Products of Ningbo Shunze Rubber (by Grade), 2016
如果这份报告不能满足您的要求,我们还可以为您定制报告,请 留言说明您的详细需求。
|