|
|
|
报告导航:研究报告—
制造业—化工
|
|
2017-2021年全球及中国天然橡胶行业研究报告 |
 |
字数:3.4万 |
页数:135 |
图表数:125 |
|
中文电子版:10000元 |
中文纸版:5000元 |
中文(电子+纸)版:10500元 |
|
英文电子版:2700美元 |
英文纸版:2900美元 |
英文(电子+纸)版:3000美元 |
|
编号:CYH066
|
发布日期:2017-08 |
附件:下载 |
 |
|
|
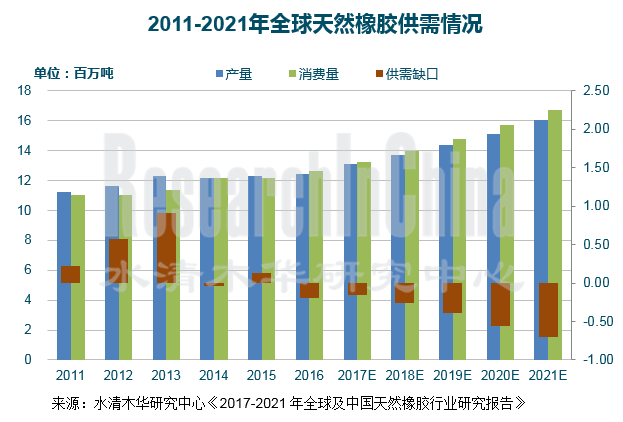
2016年,全球天然橡胶产量同比增长1.1%至1240万吨,消费量同比增长3.8%至1260万吨,供需缺口达20万吨。在橡胶需求平稳增长且产量不足的背景下,预计2017-2021年全球天胶市场仍将处于供不应求的状态,至2021年供需缺口约70万吨。
当前,全球天然橡胶供需地区结构不平衡。泰国、印度尼西亚、马来西亚、印度、越南和中国是全球前六大天然橡胶生产国,2016年其合计产量占全球总产量的86.5%;其中泰国产量最高,占比达36.3%至450万吨。而全球天然橡胶消费主要集中在亚、非、拉美等新兴工业化地区,2016年占比约75%。
中国是全球天然橡胶消费量最大的国家,2016年消费量同比增长4.6%至489.6万吨,其中77.9%用于子午线轮胎市场。在轮胎行业平稳发展拉动下,预计2017-2021年,中国天胶消费量有望保持年均4.5%的速度增长,至2021年有望达578.8万吨,其子午线轮胎用胶消费量占比在90%左右。
受天然橡胶资源约束,2016年,中国天然橡胶产量约76.4万吨,仅占全球总产量的6.2%,2021年有望达至107.9万吨。中国天然橡胶市场供需严重失衡,2016年供需缺口约413.2万吨,2021年缺口将达470.9万吨。
价格方面,在国际原油等大盘市场价格集体走高以及重卡轮胎等下游行业需求加快增长等影响下,2016年下半年,天然橡胶价格一反下降局势,开始快速上涨,一直延续至2017年2月中旬,并达到2014年以来天胶价格的高点约20700元/吨;此后由于天胶主产国泰国连续4次放储等致使天胶供应增速加快,同时消费增速保持平缓,这导致2月下旬至6月底天胶价格一路下滑,但7月又出现小幅反弹。在大盘上涨以及市场供不应求的环境下,未来一年,天胶价格有望继续呈现小幅走高的趋势。
企业方面,泰国诗董、宏曼历、泰华树胶、泰橡公司、泰国联益、中化国际是全球主要天然橡胶生产商,主要分布在泰国、新加坡等东南亚地区,其中诗董橡胶是全球天然橡胶最大生产商,2016年其销量占全球总消费量的11.9%。
中国天胶生产商主要以大农垦、大橡胶集团为主,代表企业有中化国际、海南橡胶、广垦橡胶、云南农垦等。近几年,各大生产商积极布局海外市场,提高市场份额:中化国际2016年收购了新加坡上市公司合盛公司,完成了在西非、东南亚和中国主要天然橡胶产区的全球化布局;2017年4月,公司成立合盛天然橡胶(上海)有限公司,实现中化国际中国区域的天然胶营销和贸易业务的整合。广垦橡胶2016年8月收购泰国第三大天胶生产商泰华树胶(大众)有限公司,收购完成后公司天胶产能将达150万吨/年,将超过中化国际,成为中国天胶产能最高的生产商。
水清木华研究中心《2017-2021年全球及中国天然橡胶行业研究报告》着重研究了以下内容:
 全球天然橡胶市场供需、地区分布、市场价格、竞争格局、发展趋势等; 全球天然橡胶市场供需、地区分布、市场价格、竞争格局、发展趋势等;
中国天然橡胶市场供需、进出口、地区结构、竞争格局、发展趋势等;
全球及中国天然橡胶割胶面积、种植面积等;
轮胎、胶带胶管等中国天然橡胶下游应用发展情况等;
全球5家天然橡胶企业经营情况及在华发展等;
中国5家天然橡胶重点企业经营情况及发展战略等。
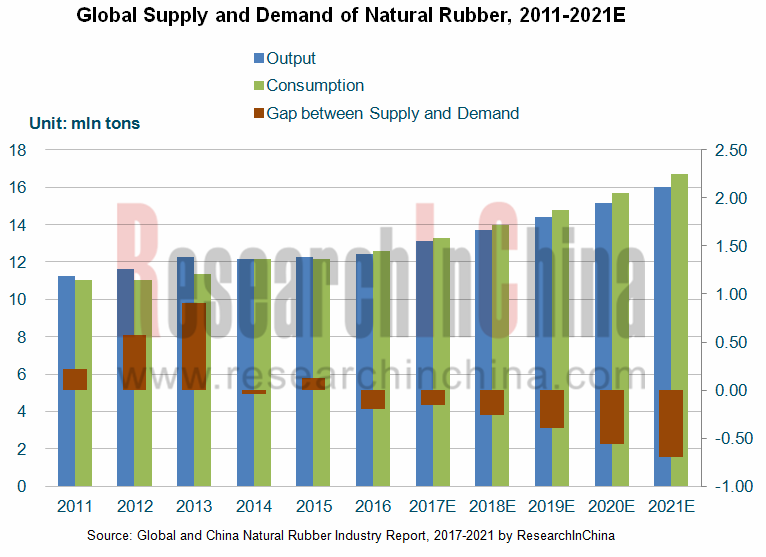
In 2016, the global natural rubber output edged up 1.1% year on year to 12.4 million tons, and the consumption rose by 3.8% year on year to 12.6 million tons, indicating the gap of 200,000 tons between supply and demand. In the context of steady growth in rubber demand and underproduction, it is expected that the global natural rubber market will continue to be in short supply in 2017-2021, with the supply and demand gap of about 700,000 tons by 2021.
At present, the regional structure of the global natural rubber supply and demand is uneven. Thailand, Indonesia, Malaysia, India, Vietnam and China are the world's top six natural rubber producers, contributing 86.5% to the global total output in 2016; wherein, Thailand ranked first with the output of 4.5 million tons and the share of 36.3% in 2016. In the world, natural rubber is mainly consumed in Asia, Africa, Latin America and other emerging industrialized areas, which enjoyed the share of about 75% in 2016.
China is the world's largest producer of natural rubber, and its consumption in 2016 jumped by 4.6% year on year to 4.896 million tons, of which 77.9% was used for radial tires. Driven by the steady development of the tire industry, China's natural rubber consumption is expected to keep an AAGR of 4.5% during 2017-2021 and hit 5.788 million tons by 2021, of which about 90% will be used in radial tires.
Restricted by natural rubber resources, China produced about 764,000 tons of natural rubber in 2016, accounting for only 6.2% of the global output. By 2021, China may produce 1.079 million tons. Amid the serious imbalance between supply and demand, China saw the gap of about 4.132 million tons in 2016; the gap will reach 4.709 million tons by 2021.
In terms of the price, the natural rubber price bucked the downward trend to rise rapidly from H2 2016 to mid-February 2017 and peaked at RMB20,700 / ton since 2014, thanks to higher market prices of international commodities (crude oil, etc.) and quick demand growth of downstream industries (such as heavy truck tires). Later, the main producer Thailand released its storage for four consecutive times, resulting in accelerated supply; however, the consumption growth remained unchanged, so that the natural rubber price dropped down from late February to the end of June, but rebounded slightly in July. In the next year, the broad market and short supply may boost the natural rubber price to show a slight uptrend.
The world's leading natural rubber manufacturers are mainly distributed in Southeast Asia (Thailand and Singapore, etc.), including Sri Trang Agro-Industry, Von Bundit, Thai Hua Rubber Public, TRUBB, Southland Rubber and Sinochem International; among them, Sri Trang Agro-Industry is the world's largest natural rubber producer, and its sales volume accounted for 11.9% of the global total consumption in 2016.
Chinese natural rubber manufacturers are mainly large-sized agricultural reclamation and rubber groups, represented by Sinochem International, China Hainan Rubber, Guangken Rubber, Yunnan State Farms Group and so on. In recent years, major producers have actively deployed overseas markets and seized more market shares. Sinochem International acquired the Singapore-listed company Halcyon Agri Corporation Limited in 2016 to fulfill a global layout of major natural rubber producing areas in West Africa, Southeast Asia and China; in April 2017, the company established Halcyon Natural Rubber (Shanghai) Co., Ltd. to integrate natural rubber marketing and trade of Sinochem International in China. Guangken Rubber took over Thai Hua Rubber Public Co., Ltd. which is Thailand's third largest natural rubber producer in August 2016. As soon as the acquisition is completed, the company will obtain the natural rubber capacity of 1.5 million tons/a, and surpass Sinochem International to rank first in China by capacity.
Global and China Natural Rubber Industry Report, 2017-2021 by ResearchInChina highlights the following:
 Supply & demand, regional distribution, prices, competitive landscape and development trends of global natural rubber market; Supply & demand, regional distribution, prices, competitive landscape and development trends of global natural rubber market;
Supply & demand, import & export, regional structure, competitive landscape, development trends of Chinese natural rubber market;
Tapping area and planting area of natural rubber in China and around the world;
Development of applications of natural rubber in China, such as tyre, rubber belt & hose;
Operation and development in China of 5 global natural rubber companies;
Operation and development strategies of 5 key Chinese natural rubber companies.
第一章 天然橡胶基础概念
1.1 定义
1.2 分类
1.3 产业链
第二章 全球天然橡胶市场发展概况
2.1 发展现状
2.2 市场供给
2.3 市场需求
2.3.1 消费量
2.3.2 消费结构
2.4 主要天胶产区
2.4.1 泰国
2.4.2 印度尼西亚
2.4.3 马来西亚
2.4.4 越南
2.5 价格
2.6 竞争格局
2.6.1 分收入
2.6.2 分产能
2.7 发展趋势
第三章 中国天然橡胶市场发展概况
3.1 发展现状
3.2 市场供需
3.2.1 供给及地区结构
3.2.2 需求及消费结构
3.3 进出口
3.3.1 进口
3.3.2 出口
3.4 价格
3.5 竞争格局
3.5.1 分企业
3.5.2 替代产品
3.6 发展趋势
第四章 全球及中国天然橡胶相关产业发展
4.1 上游
4.2 下游
4.2.1 轮胎行业
4.2.2 其他
第五章 全球重点生产企业
5.1 泰国诗董橡胶股份有限公司
5.1.1 企业简介
5.1.2 经营情况
5.1.3 产能和产销量
5.1.4 产业链布局
5.1.5 在华发展
5.1.6 竞争优势
5.2 泰国橡胶集团有限公司(TRUBB)
5.2.1 企业简介
5.2.2 经营情况
5.2.3 产能及销量
5.2.4 产业链布局
5.2.5 产品竞争策略
5.2.6 销售渠道
5.2.7 在华发展
5.3 泰华树胶(大众)有限公司
5.3.1 企业简介
5.3.2 产能
5.3.3 在华发展
5.3.4 竞争优势
5.4 宏曼历有限公司
5.4.1 企业简介
5.4.2 产能
5.4.3 竞争优势
5.5 泰国联益橡胶集团有限公司
5.5.1 企业简介
5.5.2 产能
5.5.3 在华发展
第六章 中国重点企业
6.1 海南天然橡胶产业集团股份有限公司(601118)
6.1.1 企业简介
6.1.2 经营情况
6.1.3 产销量
6.1.4 竞争实力
6.1.5 发展战略
6.2 中化国际(控股)股份有限公司(600500)
6.2.1 企业简介
6.2.2 经营情况
6.2.3 天然橡胶业务
6.2.4 竞争优势
6.3 云南农垦集团有限责任公司
6.3.1 企业简介
6.3.2 经营情况
6.3.3 天然橡胶业务
6.3.4 天然橡胶海外布局
6.3.5 天然橡胶竞争实力
6.4 广东省广垦橡胶集团有限公司
6.4.1 企业简介
6.4.2 经营情况
6.4.3 橡胶种植业务
6.4.4 橡胶加工业务
6.4.5 发展战略
6.5 西双版纳新高深橡胶股份有限公司
6.5.1 企业简介
6.5.2 经营情况
6.5.3 产能与产销量
1 Basic Concept of Natural Rubber
1.1 Definition
1.2 Classification
1.3 Industry Chain
2 Development of Global Natural Rubber Market
2.1 Status Quo
2.2 Supply
2.3 Demand
2.3.1 Consumption
2.3.2 Consumption Structure
2.4 Main Natural Rubber Producing Areas
2.4.1 Thailand
2.4.2 Indonesia
2.4.3 Malaysia
2.4.4 Vietnam
2.5 Price
2.6 Competitive Landscape
2.6.1 by Revenue
2.6.2 by Capacity
2.7 Development Trend
3 Development of Chinese Natural Rubber Market
3.1 Status Quo
3.2 Supply and Demand
3.2.1 Supply and Regional Structure
3.2.2 Demand and Consumption Structure
3.3 Import and Export
3.3.1 Import
3.3.2 Export
3.4 Price
3.5 Competitive Landscape
3.5.1 by Enterprise
3.5.2 Substitute Products
3.6 Development Trend
4 Development of Global and China Natural Rubber-related Industries
4.1 Upstream
4.2 Downstream
4.2.1 Tyre Industry
4.2.2 Others
5 Key Global Players
5.1 Sri Trang Agro-Industry Plc.
5.1.1 Profile
5.1.2 Operation
5.1.3 Capacity, Output and Sales Volume
5.1.4 Layout of Industry Chain
5.1.5 Development in China
5.1.6 Competitive Edge
5.2 Thai Rubber Latex Corporation (Thailand) Public Co., Ltd. (TRUBB)
5.2.1 Profile
5.2.2 Operation
5.2.3 Capacity and Sales Volume
5.2.4 Layout of Industry Chain
5.2.5 Product Competitive Strategy
5.2.6 Sales Channels
5.2.7 Development in China
5.3 Thai Hua Rubber Public Co., Ltd.
5.3.1 Profile
5.3.2 Capacity
5.3.3 Development in China
5.3.4 Competitive Edge
5.4 Von Bundit Co., Ltd.
5.4.1 Profile
5.4.2 Capacity
5.4.3 Competitive Edge
5.5 Southland Rubber Co., Ltd.
5.5.1 Profile
5.5.2 Capacity
5.5.3 Development in China
6 Major Chinese Companies
6.1 China Hainan Rubber Industry Group Co., Ltd. (601118)
6.1.1 Profile
6.1.2 Operation
6.1.3 Output and Sales Volume
6.1.4 Competitive Strength
6.1.5 Development Strategy
6.2 Sinochem International Corporation (600500)
6.2.1 Profile
6.2.2 Operation
6.2.3 Natural Rubber Business
6.2.4 Competitive Edge
6.3 Yunnan State Farms Group Co., Ltd.
6.3.1 Profile
6.3.2 Operation
6.3.3 Natural Rubber Business
6.3.4 Overseas Layout
6.3.5 Competitive Strength
6.4 Guangdong Guangken Rubber Group Co., Ltd.
6.4.1 Profile
6.4.2 Operation
6.4.3 Rubber Plantation Business
6.4.4 Rubber Processing Business
6.4.5 Development Strategy
6.5 Xishuangbanna New Gaoshen Rubber Incorporate Company
6.5.1 Profile
6.5.2 Operation
6.5.3 Capacity, Output and Sales Volume
表:天然橡胶的特性
表:标准胶(分级别)种类
表:天然橡胶的分类
图:天然橡胶主要生产流程
图:天然橡胶产业链
表:全球天然橡胶发展阶段
图:2008-2017年全球天然橡胶产量及同比增长
表:2013-2016年全球天然橡胶(分国家)产量及构成
图:2005-2017年全球ANRPC天然橡胶总开割面积
表:截至2017年6月重要厄尔尼诺现象发生时间及强度
图:2008-2017年全球天然橡胶消费量及同比增长
图:2016年全球天然橡胶(分应用领域)消费量构成
表:2009-2016年全球天然橡胶(分国家)出口量
表:2013-2021年泰国天然橡胶产量、出口量、消费量与开割面积
图:2009-2016年泰国天然橡胶产量
图:2013-2016年泰国天然橡胶产量季节性变化
图:2012-2016年泰国天然橡胶出口量
图:2016年泰国天然橡胶(按胶种)出口量构成
图:2016年泰国天然乳胶(分国家/地区)出口量占比
图:2014-2017年泰国天然橡胶胶水价格
图:2014-2017年泰国杯胶价格
图:泰国天然橡胶种植区域按月份气温特征
图:截至2020年泰国天然橡胶树龄分布情况
表:2013-2021年印度尼西亚天然橡胶产量、消费量、出口量及开割面积
图:2009-2017年印度尼西亚天然橡胶月度产量
图:2012-2016年印度尼西亚天然橡胶出口量
表:2013-2021年马来西亚天然橡胶产量、消费量、出口量及可割胶面积
图:2009-2017年马来西亚天然橡胶月度产量
图:2012-2016年马来西亚天然橡胶出口量
图:2003-2016年马来西亚天然橡胶总种植面积、开割面积及割胶率
图:2003-2016年马来西亚天然橡胶新种植面积
表:2013-2021年越南天然橡胶产量、消费量、出口量及可开割面积
图:2009-2017年越南天然橡胶月度产量
图:2003-2016年越南天然橡胶总种植面积、开割面积及割胶率
图:2003-2016年越南天然橡胶新种面积
图:截至2020年越南天然橡胶树龄分布情况
表:2009-2017年世界主要国家天然橡胶政策
图:2013-2017年东京橡胶、新加坡橡胶和上海期货天胶价格走势(美元/吨)
表:2015-2017年全球及中国主要橡胶生产企业营业收入
图:2017年全球及中国主要天然橡胶生产企业天然橡胶产能
表:2015-2021年全球天然橡胶产量与消费量
表:2015-2021年全球天然橡胶(分下游)消费量
图:截至2017年7月底中国天然橡胶收储情况
图:2008-2017年中国天然橡胶产量及同比增长
图:2005-2017年中国天然橡胶自给率
图:2016年中国天然橡胶(分地区)产量结构
图:海南省天然橡胶加工区域构成
图:2008-2017年中国天然橡胶消费量及同比增长
图:2013-2021中国天然橡胶下游消费结构
表:2006-2017年中国天然橡胶进口关税政策
图:2007-2017年中国天然橡胶进口量及同比增长
表:2007-2017年中国天然橡胶(分国家)进口量及构成
图:2013-2017年中国天然橡胶进口量(分产品)构成
图:2008-2017年中国天然橡胶出口量
图:2016-2017年中国天然橡胶价格主要影响因素
图:2011-2017年中国天然橡胶价格
图:2014-2017年青岛保税区天然橡胶价格走势
图:2014-2017年中国海南天然橡胶胶水价格
图:2014-2017年中国云南天然橡胶胶水价格
表:2016年中国主要天然橡胶生产商天然橡胶业务发展
表:常用橡胶产品性能
表:2011-2021年中国合成橡胶产量与消费量
表:2015-2021年中国天然橡胶产量与消费量
图:2008-2016年全球九大天然橡胶主产国天然橡胶总种植面积
图:2004-2017年全球九大天然橡胶主产国天然橡胶开割面积
表:2008-2016年全球天然橡胶主产国新种与翻种面积
图:全球天然橡胶主产国停割期
图:2014-2017年中国全钢胎开工率
图:2014-2017年中国半钢胎开工率
表:2013-2016年中国轮胎出口量及金额
图:2016年中国半钢胎企业按产能企业分布
图:2016年中国全钢胎企业按产能企业分布
图:2016年全钢轮胎(分原材料)成本构成
图:2016年半钢轮胎(分原材料)成本构成
表:2015-2021年中国子午线轮胎天然橡胶需求量
表:2017年中国轮胎企业在国外布局天然橡胶情况
表:2012-2021年中国胶管带产量及同比增长
图:2008-2016年中国胶管相关制造企业营业收入及同比增长
表:1987-2016年诗董橡胶重要发展事件
图:2008-2017年诗董橡胶营业收入与净利润
图:2014-2016年诗董橡胶毛利润与毛利率
图:2012-2017年诗董橡胶(分产品)主营业务收入
图:2016年诗董橡胶(分产品)营业收入构成
图:2013-2016年诗董橡胶天然橡胶业务(分国家)主营业务收入
图:2010-2016年诗董橡胶(分产品)天然橡胶销量
图:2014-2016年诗董橡胶(分国家/地区)销量
图:2016-2017年分季度诗董橡胶(分地区)销量
图:2016年诗董橡胶(分地区)销量构成
图:2016年诗董集团天然橡胶产业链
图:截至2016年底诗董集团天然橡胶种植面积构成
图:2016-2025年诗董集团天然橡胶可割胶面积
图:截至2016年底诗董橡胶(分产品)天然橡胶加工厂及产能
图:2007-2017年诗董集团天然橡胶产能
表:2017年诗董集团天然橡胶主要下游产品布局
图:诗董橡胶与STP公司拆分重组
图:2011-2016年诗董集团天然橡胶在中国营业收入
图:2012-2016年诗董集团在华销量占中国总进口量的市场份额
图:2016年诗董集团全球市场份额
图:诗董集团主要发展策略
图:2008-2017年泰橡公司营业收入与净利润
表:2017年泰橡公司(分业务)子公司
表:2013-2016泰橡公司(分业务)收入及构成
表:2015-2016年泰橡公司(分地区)营业收入及构成
图:2013-2016年泰橡公司(分业务)产能
表:2012-2013年泰橡公司(分业务)产品销量
表:泰橡公司Latex Group产品主要竞争策略
表:2017年泰橡公司主要业务部门销售渠道
图:2012-2016年泰橡公司在中国营业收入
表:2017泰华公司工厂与产能
表:2017年泰华公司(分产品)天然橡胶产能
图:2017年宏曼历附属子公司分布
表:2013-2017年宏曼历(分产品)产能
表:2017年宏曼历天然橡胶(分工厂)产能
图:1999-2017年泰国联益橡胶集团全球发展事件
表:2015-2017年联益橡胶(分产品)产能
表:2017年联益橡胶(分工厂)产品产能
图:联益橡胶公司(分产品)工厂分布
图:2008-2017年海南橡胶营业收入与净利润
表:2012-2016年海南橡胶(分产品)主营业务收入及构成
图:2009-2016年海南橡胶(分地区)主营业务收入
图:2009-2016年海南橡胶(分产品)毛利率
图:2010-2016年海南橡胶天然橡胶(分渠道)产量
图:2008-2017年海南橡胶销量及同比增长
图:2017年海南橡胶天然橡胶产业链布局
图:2016-2020年海南橡胶公司特种胶园更新种植面积
图:2016-2020年海南橡胶特种胶园配套防护林面积
图:2008-2017年中化国际营业收入与净利润
图:2015-2017年中化国际(分业务)主营业务收入
图:2012-2016年中化国际(分地区)营业收入
图:2009-2017年中化国际(分业务)毛利率
图:2009-2017年中化国际天然橡胶业务营业收入与营业成本
图:2010-2017年中化国际天然橡胶产能
图:2011-2017年中化国际天然橡胶产销量
图:2012-2017年云南农垦营业收入与净利润
表:2014-2016年云南农垦集团(分业务)主营业务收入及构成
表:2012-2016年云南农垦集团天然橡胶种植面积、开割面积及开割比例
表:2014-2017年云南农垦集团鲜胶水对外采购量
表:2012-2017年云南农垦天然橡胶(分产品)产能与产量
图:2012-2015年云南农垦天然橡胶(分产品)营业收入及构成
表:2012-2017年云南农垦天然橡胶(分销售渠道)销售量及占比
表:广垦橡胶主要海外子公司
图:2010-2017年广东广垦橡胶企业营业收入及同比增长
表:2013-2016年广垦橡胶(分地区)天然橡胶收入情况
表:2013-2016年广垦橡胶天然橡胶采购量及采购价格
表:2013-2016年广垦集团橡胶业务(分产品)产能及产量
表:2013-2016年广垦橡胶公司(分产品/分地区)销量及收入
表:截至2017年5月底广垦集团橡胶主要在建/拟建项目
图:2013-2016年高深股份营业收入与净利润
表:2013-2015年高深股份(分地区)主营业务收入及构成
表:2013-2016年高深股份(分工厂)产能与产量
表:2013-2014年高深股份(分产品)天然橡胶销量
表:2016H1年高深股份前五名客户名称及营业收入贡献
Properties of Natural Rubber
Categories of Standard Rubber (by Level)
Classification of Natural Rubber
Main Production Processes of Natural Rubber
Natural Rubber Industry Chain
Development Stages of Natural Rubber in the World
Global Natural Rubber Output and YoY Growth, 2008-2017
Global Natural Rubber Output by Country, 2013-2016
Global ANRPC Natural Rubber Tapping Area, 2005-2017
Occurrence Time and Intensity of Severe El Niño Phenomena, by Jun 2017
Global Natural Rubber Consumption and YoY Growth, 2008-2017
Global Natural Rubber Consumption Structure by Application, 2016
Global Natural Rubber Export Volume by Country, 2009-2016
Thailand's Natural Rubber Output, Export Volume, Consumption and Tapping Area, 2013-2021E
Thailand's Natural Rubber Output, 2009-2016
Thailand's Natural Rubber Output by Season, 2013-2016
Thailand's Natural Rubber Export Volume, 2012-2016
Thailand's Natural Rubber Export Volume Structure by Rubber Type, 2016
Thailand's Natural Latex Export Volume Structure by Country/Region, 2016
Thailand's Natural Rubber Cement Price, 2014-2017
Thailand's Cup Rubber Price, 2014-2017
Temperature Characteristics of Thailand's Natural Rubber Planting Areas by Month
Age Distribution of Thailand's Natural Rubber Trees, by 2020
Indonesia’s Natural Rubber Output, Consumption, Export Volume and Tapping Area, 2013-2021E
Indonesia’s Monthly Natural Rubber Output, 2009-2017
Indonesia’s Natural Rubber Export Volume, 2012-2016
Malaysia’s Natural Rubber Output, Consumption, Export Volume and Tapping Area, 2013-2021E
Malaysia’s Monthly Natural Rubber Output, 2009-2017
Malaysia’s Natural Rubber Export Volume, 2012-2016
Malaysia’s Natural Rubber Planting Area, Tapping Area and Tapping Rate, 2003-2016
Malaysia’s Additional Natural Rubber Planting Area, 2003-2016
Vietnam’s Natural Rubber Output, Consumption, Export Volume and Available Tapping Area, 2013-2021E
Vietnam’s Monthly Natural Rubber Output, 2009-2017
Vietnam’s Natural Rubber Planting Area, Tapping Area and Tapping Rate, 2003-2016
Vietnam’s Additional Natural Rubber Planting Area, 2003-2016
Age Distribution of Vietnam’s Natural Rubber Trees, by 2020
Policies about Natural Rubber in Major Countries, 2009-2017
Natural Rubber Price Trend in Tokyo Commodity Exchange, Singapore Mercantile Exchange and Shanghai Futures Exchange, 2013-2017 (USD / ton)
Revenue of Major Global and Chinese Rubber Producers, 2015-2017
Capacity of Major Global and Chinese Natural Rubber Producers, 2017
Global Natural Rubber Output and Consumption, 2015-2021E
Global Natural Rubber Consumption by Application, 2015-2021E
Purchase and Storage of Natural Rubber in China, as of the end of Jul 2017
China’s Natural Rubber Output and YoY Growth, 2008-2017
China’s Natural Rubber Self-sufficiency Rate, 2005-2017
China’s Natural Rubber Output Structure by Region, 2016
Structure of Hainan's Natural Rubber Processing Regions
China’s Natural Rubber Consumption and YoY Growth, 2008-2017
China’s Natural Rubber Consumption Structure, 2013-2021E
China’s Import Tariff Policy on Natural Rubber, 2006-2017
Import Volume and YoY Growth of Natural Rubber in China, 2007-2017
Import Volume Structure of Natural Rubber in China by Country, 2007-2017
Import Volume Structure of Natural Rubber in China by Product, 2013-2017
China’s Natural Rubber Export Volume, 2008-2017
Main Factors Influencing China’s Natural Rubber Price, 2016-2017
China’s Natural Rubber Price, 2011-2017
Natural Rubber Price Trend in Qingdao Bonded Zone, 2014-2017
Natural Rubber Cement Price in Hainan, 2014-2017
Natural Rubber Cement Price in Yunnan, 2014-2017
Natural Rubber Business Development of Major Natural Rubber Producers in China, 2016
Performance of Common Rubber Products
China’s Synthetic Rubber Output and Consumption, 2011-2021E
China’s Natural Rubber Output and Consumption, 2015-2021E
Total Planting Area of Global Top 9 Natural Rubber Producing Countries, 2008-2016
Tapping Area of Global Top 9 Natural Rubber Producing Countries, 2004-2017
New Planting & Replanting Area of Global Major Natural Rubber Producing Countries, 2008-2016
Stoppage Periods of Global Major Natural Rubber Producing Countries
China’s All-Steel Tire Operating Rate, 2014-2017
China’s Semisteel Tire Operating Rate, 2014-2017
China’s Tire Export Volume and Value, 2013-2016
Distribution of Semisteel Tire Enterprises in China by Capacity, 2016
Distribution of All-Steel Tire Enterprises in China by Capacity, 2016
All-Steel Tire Cost Structure by Raw Materials, 2016
Semisteel Tire Cost Structure by Raw Materials, 2016
Demand of Chinese Radial Tires for Natural Rubber, 2015-2021E
Overseas Natural Rubber Layout of Chinese Tire Enterprises, 2017
China’s Rubber Hose & Belt Output and YoY Growth, 2012-2021E
Revenue and YoY Growth of Rubber Hose-related Manufacturers in China, 2008-2016
Milestones in the Development of Sri Trang, 1987-2016
Revenue and Net Income of Sri Trang, 2008-2017
Gross Profit and Gross Margin of Sri Trang, 2014-2016
Operating Revenue of Sri Trang by Product, 2012-2017
Revenue Structure of Sri Trang by Product, 2016
Natural Rubber Operating Revenue of Sri Trang by Country/Region, 2013-2016
Natural Rubber Sales Volume of Sri Trang by Product, 2010-2016
Sales Volume of Sri Trang by Country/Region, 2014-2016
Quarterly Sales Volume of Sri Trang by Region, 2016-2017
Sales Volume Structure of Sri Trang by Region, 2016
Natural Rubber Industry Chain of Sri Trang, 2016
Natural Rubber Planting Area Structure of Sri Trang, by the end of 2016
Available Natural Rubber Tapping Area of Sri Trang, 2016-2025E
Natural Rubber Processing Plants and Capacity of Sri Trang by Product, by the end of 2016
Natural Rubber Capacity of Sri Trang, 2007-2017
Layout of Sri Trang in Main Downstream Natural Rubber Products, 2017
Splitting and Restructuring between Sri Trang and STP
Natural Rubber Revenue of Sri Trang in China, 2011-2016
Sri Trang’s Sales in China as a Percentage of China’s Total Natural Rubber Import Volume, 2012-2016
Global Market Share of Sri Trang, 2016
Main Development Strategies of Sri Trang
Revenue and Net Income of TRUBB, 2008-2017
Subsidiaries of TRUBB by Business, 2017
Revenue Structure of TRUBB by Business, 2013-2016
Revenue Structure of TRUBB by Region, 2015-2016
Capacity of TRUBB by Business, 2013-2016
Sales Volume of TRUBB by Business, 2012-2013
Competitive Strategies of TRUBB’s Main Products
Sales Channels of TRUBB's Main Business Divisions, 2017
TRUBB’s Revenue in China, 2012-2016
Factories and Capacity of Thai Hua, 2017
Natural Rubber Capacity of Thai Hua by Product, 2017
Distribution of Von Bundit’s Affiliated Companies, 2017
Capacity of Von Bundit by Product, 2013-2017
Natural Rubber Capacity of Von Bundit by Factory, 2017
Global Development Events of Southland Rubber, 1999-2017
Capacity of Southland Rubber by Product, 2015-2017
Capacity of Southland Rubber by Factory, 2017
Factory Distribution of Southland Rubber by Product
Revenue and Net Income of Hainan Rubber Group, 2008-2017
Operating Revenue Structure of Hainan Rubber Group by Product, 2012-2016
Operating Revenue of Hainan Rubber Group by Region, 2009-2016
Gross Margin of Hainan Rubber Group by Product, 2009-2016
Natural Rubber Output of Hainan Rubber Group by Channel, 2010-2016
Sales Volume and YoY Growth of Hainan Rubber Group, 2008-2017
Industry Chain Layout of Hainan Rubber Group, 2017
New Planting Area of Hainan Rubber Group’s Special Rubber Plantations, 2016-2020E
Supporting Shelterbelt Area of Hainan Rubber Group’s Special Rubber Plantations, 2016-2020E
Revenue and Net Income of Sinochem International, 2008-2017
Operating Revenue of Sinochem International by Business, 2015-2017
Revenue of Sinochem International by Region, 2012-2016
Gross Margin of Sinochem International by Business, 2009-2017
Natural Rubber Revenue and Operating Cost of Sinochem International, 2009-2017
Natural Rubber Capacity of Sinochem International, 2010-2017
Natural Rubber Output and Sales Volume of Sinochem International, 2011-2017
Revenue and Net Income of Yunnan State Farms Group, 2012-2017
Operating Revenue Structure of Yunnan State Farms Group by Business, 2014-2016
Natural Rubber Planting Area, Tapping Area and Tapping Rate of Yunnan State Farms Group, 2012-2016
Fresh Rubber Cement Procurement of Yunnan State Farms Group, 2014-2017
Natural Rubber Capacity and Output of Yunnan State Farms Group by Product, 2012-2017
Natural Rubber Revenue Structure of Yunnan State Farms Group by Product, 2012-2015
Natural Rubber Sales Volume and Structure of Yunnan State Farms Group by Sales Channel, 2012-2017
Major Overseas Subsidiaries of Guangdong Guangken Rubber Group
Revenue and YoY Growth of Rubber Companies of Guangdong Guangken Rubber Group, 2010-2017
Natural Rubber Revenue of Guangdong Guangken Rubber Group by Region, 2013-2016
Natural Rubber Procurement and Price of Guangdong Guangken Rubber Group by Region, 2013-2016
Rubber Capacity and Output of Guangdong Guangken Rubber Group by Product, 2013-2016
Sales Volume and Revenue of Rubber Companies of Guangdong Guangken Rubber Group by Product/Region, 2013-2016
Major Rubber Projects Planned/under Construction of Guangdong Guangken Rubber Group, by the end of May 2017
Revenue and Net Income of Xishuangbanna New Gaoshen Rubber, 2013-2016
Operating Revenue Structure of Xishuangbanna New Gaoshen Rubber by Region, 2013-2015
Capacity and Output of Xishuangbanna New Gaoshen Rubber by Factory, 2013-2016
Natural Rubber Sales Volume of Xishuangbanna New Gaoshen Rubber by Product, 2013-2014
Name List and Revenue Contribution of Xishuangbanna New Gaoshen Rubber’s Top 5 Clients, 2016H1
如果这份报告不能满足您的要求,我们还可以为您定制报告,请 留言说明您的详细需求。
|