|
|
|
报告导航:研究报告—
制造业—汽车
|
|
2017-2021年中国商用车(客车及卡车)行业研究报告 |
 |
字数:8.3万 |
页数:220 |
图表数:271 |
|
中文电子版:12000元 |
中文纸版:6000元 |
中文(电子+纸)版:12500元 |
|
英文电子版:3000美元 |
英文纸版:3200美元 |
英文(电子+纸)版:3300美元 |
|
编号:ZJF106
|
发布日期:2017-08 |
附件:下载 |
 |
|
|
商用车作为生产资料,与国家经济发展的大环境密切相关,近年来由于中国房地产、大型基础设施建设项目的开工数量有限,商用车市场进入了相对稳定的发展阶段。2016年,中国商用车产销369.81万辆和365.13万辆,同比增长8.0%和5.8%。2017年上半年,中国商用车产销量分别为204.30万辆和210.09万辆,同比增长13.8%和17.4%,增速比上年同期提升12.3个百分点和15.5个百分点。
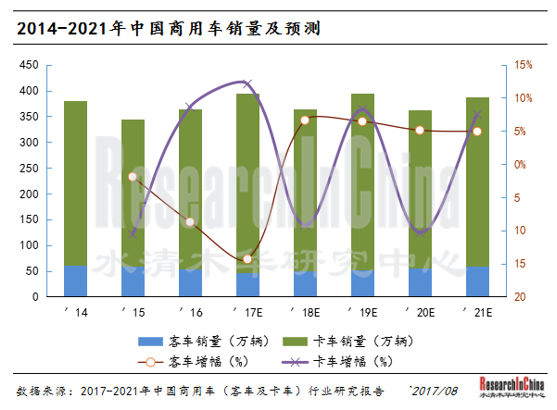
在商用车主要品种中,卡车和客车市场涨跌不一,2016年中国卡车市场产销分别增长11.2%和8.8%,2017年上半年产销分别18.7%和22.6%;而客车产销均呈下降趋势,其中2016年产销分别下降7.4%和8.7%,2017年上半年产销分别下降15.3%和14.0%。
未来几年,排放升级、政策红利和市场需求将为货车市场带来较大的发展空间。其中,新国标GB1589-2016首次引进的新车型中置轴车将得到进一步推广;全国治理超载行动促使6×4牵引车销量直线上升;国五排放标准全面实施,促使物流用户在货运车辆的更新置换方面发挥作用;北汽福田、中国重汽无人驾驶卡车的问世,将推动人工智能及移动互联技术在重型卡车上的应用;快递行业的持续快速发展,对用于城市配送的中轻型卡车、纯电动物流车提出新的需求。
而客车方面,受新能源汽车补贴退坡、技术门槛提高以及高铁竞争等因素影响,客车市场未来仍有较大的下滑空间,另一方面,城市公交网络化及新能源汽车的替代尚能为客车产业提供一些动力。
中国商用车竞争格局相对较为稳定,市场集中度也较高,2016年,中国客车前十大厂商占据71.47%的市场份额,前五大厂商占据49.58%的市场份额;卡车市场前十大厂商销售总量集中度约占67.56%,前五大厂商集中度约为46.01%。客车市场中,宇通客车和金龙汽车在大中轻等各产品线全面发展,稳居行业前列,包括江铃、金杯、福田等公司凭借轻型车的数量优势占据在市场前五;卡车领域,北汽福田与东风汽车凭借丰富的产品线占据市场销量的前两位,上汽通用五菱则凭借在微卡市场的绝对优势排名第三位。
水清木华研究中心《2017-2021年中国商用车(客车及卡车)行业研究报告》报告主要包括以下内容:
 客车行业概况(包括定义及分类,发展趋势,行业政策等); 客车行业概况(包括定义及分类,发展趋势,行业政策等);
中国客车行业发展总体概况(汽车产销量、保有量等);
中国客车细分市场概况,包括大型客车、中型客车及轻型客车的产销量、竞争格局等;
中国客车新能源客车市场分析,包括产销量、竞争格局以及产业政策等;
中国客车产业链情况,包括原材料市场、下游应用市场分析等;
中国卡车产业整体概况,包括产品定义、分类、技术来源、最新政策以及发展方向等;
中国卡车整体行业现况,包括保有量、产销量、市场结构、进出口、竞争格局等;
中国卡车细分市场概况,包括重卡、中卡、轻卡以及微卡的产销量、竞争格局等;
中国卡车产业链情况,包括原材料市场、下游应用市场分析等;
宇通客车、中通客车、金龙汽车、一汽集团、东风集团、中国重汽、福田汽车、江铃集团、江淮汽车等在内的29家商用车厂商分析,包括公司简介、财务状况、产销量、主打产品、生产基地分布以及最新发展动态等。
Commercial vehicle as means of production is tied up with national economic development. As there have been limited starts of real estate and large infrastructure construction projects in China over recent years, the commercial vehicle market ushers in a period of stable development. In 2016, China produced 3.6981 million commercial vehicles with a yr-on-yr rise of 8.0%, and sold 3.6513 million units, up 5.8% from a year earlier. In H1 2017, China’s output and sales volume of commercial vehicle reported 2.043 million units and 2.1009 million units, respectively, surging by 13.8% and 17.4% year on year. The growth rates rose by 12.3 percentage points and 15.5 percentage points, respectively. 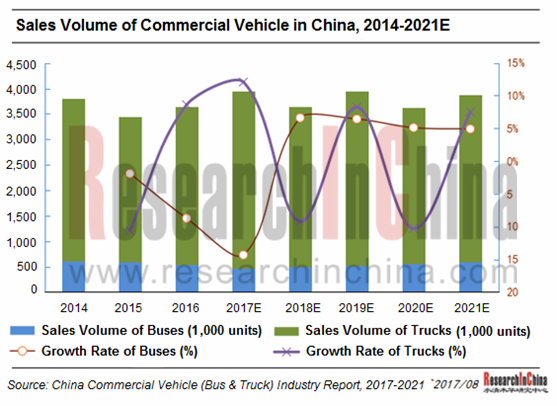
Of commercial vehicle, truck and bus markets performed differently. In 2016, truck production and sales in China grew 11.2% and 8.8% separately, and in H1 2017 truck production and sales at home surged 18.7% and 22.6% respectively. Yet, bus production and sales both showed a downward trend, dropping 7.4% and 8.7% respectively in 2016, and falling 15.3% and 14.0% separately in H1 2017.
In the upcoming years, upgrading of emission standards, policy dividend and market demand will bring vast development room for the truck market. Specifically, the center axle vehicle models that meet new national standard GB1589-2016 will be promoted further; the sales volume of 6×4 tractor shoots up thanks to nationwide management of overloads; the full implementation of national V emission standards urges logistics users to replace freight vehicle; the debut of FOTON’s and SINOTRUK’s self-driving trucks will stimulate the application of artificial intelligence and mobile internet technologies in heavy truck; and the rapid development of express delivery industry has new demand for light and medium trucks and pure electric logistics vehicle for city distribution.
Affected by subsidy reduction for new energy vehicle, the higher technical threshold as well as competition from high-speed rail and other factors, the bus market is still facing drastic fall in the future. On the other hand, the networking of city buses and the substitution of new energy vehicle still give impetus to the bus industry.
The competition pattern of commercial vehicle brands remains stable relatively in China, with high market concentration. In 2016, the top 10 bus manufacturers in China seized a combined 71.47% market share, and the top 5 bus manufacturers held 49.58% market shares; the top 10 truck manufacturers accounted for 67.56% of total truck sales in China, and the top 5 truck manufacturers made up about 46.01% of total truck sales. In the bus market, Yutong Bus and Xiamen King Long Motor have seen robust development of product lines (light, medium, large buses) in an all-round way and steadily ranked the top list in the industry, with companies like JMC, Jinbei and Foton ranking the top five by dint of light vehicle quantities in the market. In the truck field, FOTON and Dongfeng Motor ranked the top two by sales volume due to rich product mix, and SAIC-GM-Wuling ranked the third by absolute superiority in the mini truck market.
China Commercial Vehicle (Bus & Truck) Industry Report, 2017-2021 by ResearchInChina highlights the following:
 Bus industry overview (definition, classification, development trend, industrial policy, etc.); Bus industry overview (definition, classification, development trend, industrial policy, etc.);
Overall development of China bus industry (output, sales volume, ownership, etc.);
Overview of bus market segments in China, including large bus, medium bus and light bus (output, sales volume, competitive pattern, etc.);
China new energy bus market (output, sales volume, competitive pattern, industrial policy, etc.);
Bus industry chain in China, involving raw materials market, downstream application market, etc.;
Overview of truck industry in China (product definition, classification, technology source, latest policy development orientation, etc.);
Status quo of China truck industry (ownership, output, sales volume, market structure, import & export, competitive pattern, etc.);
Overview of truck market segments in China, covering heavy truck, medium truck, light truck and mini truck (output, sales volume, competitive pattern, etc.);
Truck industry chain in China, involving raw materials market, downstream application market, etc.;
29 commercial vehicle manufacturers (like Yutong Bus, Zhongtong Bus, King Long Motor, FAW Group, Dongfeng Motor Corporation, Sinotruk, Foton, JMC, JAC), including profile, financial situation, output, sales volume, pillar products, distribution of production bases, latest news, etc.
第一篇 客车行业
第一章 客车行业概述
1.1 产品简介
1.2 产品分类
1.3 相关政策
1.4 客车主动安全与车联网
1.4.1 政策及规划
1.4.2 技术标准
1.4.3 企业布局
第二章 中国客车整体市场
2.1 市场规模
2.2 市场结构
2.3 竞争格局
2.3.1 市场份额
2.3.2 业绩对比
2.4 细分市场
2.4.1 座位客车市场
2.4.2 公交车市场
2.4.3 校车市场
2.5 天然气客车
第三章 中国客车细分市场
3.1大型客车市场
3.1.1 市场规模
3.1.2 竞争格局
3.2中型客车市场
3.2.1 市场规模
3.2.2 竞争格局
3.3 轻型客车市场
3.3.1 市场规模
3.3.2 竞争格局
第四章 新能源客车市场
4.1 市场规模
4.2 竞争格局
4.3 产业政策
4.3.1财政补贴政策
4.3.2“削油补电”政策
4.3.3 推广考核办法
4.4 技术路线
4.5 燃料电池客车
第五章 客车产业链
5.1 上游原材料市场
5.2 关键零部件
5.2.1 变速器
5.2.2 轮毂
5.2.3 新能源电池
5.3 下游需求市场
5.3.1 客运
5.3.2 高铁
5.3.3 旅游
第二篇 卡车行业
第六章 卡车行业概述
6.1 卡车定义及分类
6.2 技术引进情况
6.3 2016-2017年最新政策
6.3.1 国五标准执行
6.3.2 GB1589标准及“921新政”
6.3.3 取消低速货车产品类别
6.3.4卡车强制安装ABS制动防抱死装置
6.3.5 黄标车淘汰工作继续进行
6.4 自动驾驶及车联网
6.4.1 卡车自动驾驶
6.4.2 卡车车联网
第七章 卡车整体市场
7.1 保有量
7.2 产销量
7.2.1 产量
7.2.2 销量
7.3 市场结构
7.4 进出口
7.5 竞争格局
第八章 卡车细分市场分析
8.1 重型货车
8.1.1 产销量
8.1.2 竞争格局
8.1.3 天然气重卡
8.1.4 高端重卡
8.2 中型货车
8.2.1 产销量
8.2.2 竞争格局
8.3 轻型卡车
8.3.1 产销量
8.3.2 竞争格局
8.4 微型卡车
8.4.1 产销量
8.4.2 竞争格局
第九章 卡车产业链分析
9.1 产业链概述
9.2 关键零部件
9.2.1 成本构成
9.2.2 配套情况
9.3 原材料市场
9.3.1 钢铁市场
9.3.2 橡胶市场
9.4 下游市场
9.4.1 基础设施建设
9.4.2 房地产开发建设
9.4.3 公路货运市场
第三篇 企业研究
第十章 企业分析
10.1 宇通客车
10.1.1 企业简介
10.1.2 财务概况
10.1.3 主营构成
10.1.4 产销量
10.1.5 新能源客车
10.1.6 生产能力
10.1.7 研发费用
10.1.8 成本构成
10.1.9 零部件配套
10.1.10 发展动态
10.1.11 经营前景
10.2 金龙汽车
10.2.1 企业简介
10.2.2 财务概况
10.2.3 主营构成
10.2.4 主要子公司经营情况
10.2.5 产销量
10.2.6 新能源客车
10.2.7 生产能力
10.2.8 研发费用
10.2.9 成本构成
10.2.10 发展动态
10.2.11 经营前景
10.3 中通客车
10.3.1 企业简介
10.3.2 财务概况
10.3.3 主营构成
10.3.4 产销量
10.3.5 新能源客车
10.3.6 研发费用
10.3.7 成本构成
10.3.8 发展动态
10.3.9 经营前景
10.4 福田汽车股份有限公司
10.4.1 企业简介
10.4.2 财务概况
10.4.3 主营构成
10.4.4 客车产销量
10.4.5 新能源客车
10.4.6 卡车产销量
10.4.7 生产能力
10.4.8 研发费用
10.4.9 新品推出进展
10.4.10 经营前景
10.5 安凯客车
10.5.1 企业简介
10.5.2 财务概况
10.5.3 主营构成
10.5.4 产销量
10.5.5 新能源客车
10.5.6 生产能力
10.5.7 研发费用
10.5.8 成本构成
10.6 辽宁曙光汽车集团股份有限公司
10.6.1 企业简介
10.6.2 财务概况
10.6.3 主营构成
10.6.4 产销量
10.6.5 新能源业务
10.6.6 成本构成
10.7 扬州亚星客车股份有限公司
10.7.1 企业简介
10.7.2 财务概况
10.7.3 主营构成
10.7.4 产销量
10.7.5 新能源客车
10.7.6 研发费用
10.7.7 成本构成
10.8 比亚迪
10.8.1 企业简介
10.8.2 财务概况
10.8.3 主营构成
10.8.4 产销量
10.8.5 新能源客车
10.8.6 发展动态
10.9 江淮汽车
10.9.1 企业简介
10.9.2 财务概况
10.9.3 主营构成
10.9.4 产销量
10.9.5 产能分布
10.9.6 研发费用
10.9.7 成本构成
10.9.8 最新进展
10.9.9 经营前景
10.10 金杯汽车
10.10.1 企业简介
10.10.2 财务概况
10.10.3 主营构成
10.10.4 产销量
10.10.5 研发费用
10.10.6 成本构成
10.10.7 经营前景
10.11 江铃汽车
10.11.1 企业简介
10.11.2 财务概况
10.11.3 主营构成
10.11.4 产销量
10.11.5 产能分布
10.11.6 研发费用
10.11.7 最新进展
10.11.8 经营前景
10.12 东风汽车
10.12.1 企业简介
10.12.2 财务概况
10.12.3 主营构成
10.12.4 产销量
10.12.5 研发费用
10.12.6 成本构成
10.12.7 经营前景
10.12.8 最新进展
10.13 南京依维柯汽车有限公司
10.13.1 公司简介
10.13.2 产销量
10.13.3 发展动态
10.14 保定长安客车制造有限公司
10.14.1 公司简介
10.14.2 产销量
10.14.3 发展动态
10.15 上汽大通汽车有限公司
10.15.1公司简介
10.15.2产销量
10.15.3 新能源业务
10.15.4发展动态
10.16 福建新福达汽车工业有限公司
10.16.1公司简介
10.16.2产销量
10.17 一汽解放
10.17.1 公司简介
10.17.2 产销量
10.17.3 新品投放
10.17.4 生产基地
10.17.5 最新发展
10.18 中国重汽
10.18.1 公司简介
10.18.2 运营情况
10.18.3 产销量
10.18.4 重卡业务
10.19 陕汽集团
10.19.1 公司简介
10.19.2 主要产品
10.19.3 重卡业务
10.19.4 最新发展
10.20 华菱汽车
10.20.1 公司简介
10.20.2 运营情况
10.20.3 卡车业务
10.20.4 产销量
10.21 庆铃汽车
10.21.1 公司简介
10.21.2 运营情况
10.21.3 卡车业务
10.22 上汽通用五菱
10.22.1 公司简介
10.22.2 主要业务
10.22.3 产销量
10.22.4 生产基地
10.23 上汽依维柯红岩
10.23.1 公司简介
10.23.2 重卡业务
10.23.3 2017年销售目标
10.24 三环专用汽车
10.24.1 公司简介
10.24.2 卡车业务
10.24.3 产销量
10.24.4 最新进展
10.25 徐工汽车
10.25.1 公司简介
10.25.2 重卡业务
10.25.3 产能分布
10.26 广汽日野
10.26.1 公司简介
10.26.2 运营情况
10.26.3 重卡业务
10.26.4 产能情况
10.27 飞碟汽车
10.27.1 公司简介
10.27.2 卡车业务
10.28 北奔重汽
10.28.1 公司简介
10.28.2 重卡业务
10.29 大运汽车
10.29.1 公司简介
10.29.2 卡车业务
Part I Bus Industry
1 Overview of Bus Industry
1.1 Introduction to Product
1.2 Product Classification
1.3 Policies
1.4 Bus Active Safety and Telematics
1.4.1 Policy and Planning
1.4.2 Technical Standards
1.4.3 Enterprises’ Layout
2 China Bus Market
2.1 Market Size
2.2 Market Structure
2.3 Competitive Landscape
2.3.1 Market Share
2.3.2 Performance Comparison
2.4 Market Segments
2.4.1 Coach
2.4.2 Public Bus
2.4.3 School Bus
2.5 Natural Gas Bus
3 Bus Market Segments in China
3.1 Large Bus
3.1.1 Market Size
3.1.2 Competitive Pattern
3.2 Medium Bus
3.2.1 Market Size
3.2.2 Competitive Pattern
3.3 Light Bus
3.3.1 Market Size
3.3.2 Competitive Pattern
4 New Energy Bus Market
4.1 Market Size
4.2 Competitive Pattern
4.3 Industrial Policy
4.3.1Policy on Fiscal Subsidies
4.3.2 Policy of Cutting Subsidies for Diesel Oil and Increasing Subsidies for Elecric Bus
4.3.3 Promotion and Assessment Measures
4.4 Technical Routes
4.5 Fuel Cell Bus
5 Bus Industry Chain
5.1 Upstream Raw Materials
5.2 Key Components
5.2.1 Transmission
5.2.2 Wheel Hub
5.2.3 New Energy Battery
5.3 Downstream Demand
5.3.1 Passenger Transport
5.3.2 High-Speed Rail
5.3.3 Tourism
Part II Truck Industry
6 Overview of Truck Industry
6.1 Definition and Classification
6.2 Technology Introduction
6.3 Latest Policy in 2016-2017
6.3.1 Implementation of National V Emission Standard
6.3.2 GB1589 Standard and “921 New Deal”
6.3.3 Cancellation of Low-speed Truck Category
6.3.4 Compulsory Installation of ABS onto Trucks
6.3.5 ‘Yellow Label’ Vehicle (that doesn’t meet exhaust emission standards) Continue to Be Eliminated
6.4 Self-driving and Te
lematics
6.4.1 Truck Self-Driving
6.4.2 Truck Telematics
7 Truck Market
7.1 Ownership
7.2 Output and Sales Volume
7.2.1 Output
7.2.2 Sales Volume
7.3 Market Structure
7.4 Import & Export
7.5 Competitive Pattern
8 Truck Market Segments
8.1 Heavy-duty Truck
8.1.1 Output and Sales Volume
8.1.2 Competitive Pattern
8.1.3 Natural Gas Heavy Truck
8.1.4 High-end Heavy Truck
8.2 Medium Truck
8.2.1 Output and Sales Volume
8.2.2 Competitive Pattern
8.3 Light Truck
8.3.1 Output and Sales Volume
8.3.2 Competitive Pattern
8.4 Mini Truck
8.4.1 Output and Sales Volume
8.4.2 Competitive Pattern
9 Truck Industry Chain
9.1 Overview of Industrial Chain
9.2 Key Components
9.2.1 Cost Structure
9.2.2 Supporting
9.3 Raw Materials Market
9.3.1 Iron & Steel
9.3.2 Rubber
9.4 Downstream Market
9.4.1 Infrastructure Construction
9.4.2 Real Estate Development
9.4.3 Highway Freight
Part III Companies
10 Companies
10.1 Zhengzhou Yutong Bus Co., Ltd.
10.1.1 Profile
10.1.2 Financial Situation
10.1.3 Revenue Structure
10.1.4 Output and Sales
10.1.5 New Energy Bus
10.1.6 Production Capacity
10.1.7 R&D Expenses
10.1.8 Cost Structure
10.1.9 Components & Parts
10.1.10 Developments
10.1.11 Operational Prospects
10.2 Xiamen King Long Motor Group
10.2.1 Profile
10.2.2 Financial Situation
10.2.3 Revenue Structure
10.2.4 Operation of Key Subsidiaries
10.2.5 Output and Sales
10.2.6 New Energy Bus
10.2.7 Production Capacity
10.2.8 R&D Expenses
10.2.9 Cost Structure
10.2.10 Developments
10.2.11 Operational Prospects
10.3 Zhongtong Bus and Holding Co., Ltd.
10.3.1 Profile
10.3.2 Financial Situation
10.3.3 Revenue Structure
10.3.4 Output and Sales
10.3.5 New Energy Bus
10.3.6 R&D Expenses
10.3.7 Cost Structure
10.3.8 Developments
10.3.9 Operational Prospects
10.4 Beiqi Foton Motor Co., Ltd.
10.4.1 Profile
10.4.2 Financial Situation
10.4.3 Revenue Structure
10.4.4 Bus Output and Sales
10.4.5 New Energy Bus
10.4.6 Truck Output and Sales Volume
10.4.7 Production Capacity
10.4.8 R&D Expenses
10.4.9 Progress in Launch of New Products
10.4.10 Operational Prospects
10.5 Anhui Ankai Automobile Co., Ltd.
10.5.1 Profile
10.5.2 Financial Situation
10.5.3 Revenue Structure
10.5.4 Output and Sales
10.5.5 New Energy Bus
10.5.6 Production Capacity
10.5.7 R&D Expenses
10.5.8 Cost Structure
10.6 Liaoning SG Automotive Group Co., Ltd.
10.6.1 Profile
10.6.2 Financial Situation
10.6.3 Revenue Structure
10.6.4 Output and Sales
10.6.5 New Energy Business
10.6.6 Cost Structure
10.7 Yangzhou Asiastar Bus Co., Ltd.
10.7.1 Profile
10.7.2 Financial Situation
10.7.3 Revenue Structure
10.7.4 Output and Sales
10.7.5 New Energy Bus
10.7.6 R&D Expenses
10.7.7 Cost Structure
10.8 BYD
10.8.1 Profile
10.8.2 Financial Situation
10.8.3 Revenue Structure
10.8.4 Output and Sales
10.8.5 New Energy Bus
10.8.6 Developments
10.9 Anhui Jianghuai Automobile Group Corp., Ltd. (JAC)
10.9.1 Profile
10.9.2 Financial Situation
10.9.3 Revenue Structure
10.9.4 Output and Sales
10.9.5 Capacity Distribution
10.9.6 R&D Expenses
10.9.7 Cost Structure
10.9.8 Developments
10.9.9 Operational Prospects
10.10 Shenyang Jinbei Automotive Co., Ltd.
10.10.1 Profile
10.10.2 Financial Situation
10.10.3 Revenue Structure
10.10.4 Output and Sales
10.10.5 R&D Expenses
10.10.6 Cost Structure
10.10.7 Operational Prospects
10.11 Jiangling Motors Co., Ltd.(JMC)
10.11.1 Profile
10.11.2 Financial Situation
10.11.3 Revenue Structure
10.11.4 Output and Sales
10.11.5 Capacity Distribution
10.11.6 R&D Expenses
10.11.7 Developments
10.11.8 Operational Prospects
10.12 Dongfeng Motor Corporation
10.12.1 Profile
10.12.2 Financial Situation
10.12.3 Revenue Structure
10.12.4 Output and Sales
10.12.5 R&D Expenses
10.12.6 Cost Structure
10.12.7 Operational Prospects
10.12.8 Developments
10.13 Nanjing IVECO Automobile Co., Ltd.(NAVECO)
10.13.1 Profile
10.13.2 Output and Sales
10.13.3 Developments
10.14 Hebei Baoding Changan Bus Co., Ltd.
10.14.1 Profile
10.14.2 Output and Sales
10.14.3 Developments
10.15 SAIC MAXUS Automotive Co., Ltd.
10.15.1 Profile
10.15.2 Output and Sales
10.15.3 New Energy Business
10.15.4 Developments
10.16 Fujian New Forta Automobile Industry Co., Ltd.
10.16.1 Profile
10.16.2 Output and Sales
10.17 FAW Jiefang Automotive Co., Ltd.
10.17.1 Profile
10.17.2 Output and Sales
10.17.3 Launch of New Products
10.17.4 Production Base
10.17.5 Developments
10.18 China National Heavy Duty Truck Group Co., Ltd. (SINOTRUK)
10.18.1 Profile
10.18.2 Operation
10.18.3 Output and Sales
10.18.4 Heavy Truck Business
10.19 Shaanxi Automobile Group Co., Ltd.
10.19.1 Profile
10.19.2 Main Products
10.19.3 Heavy Truck Business
10.19.4 Developments
10.20 Hualing Xingma Automobile (Group) Co., Ltd.
10.20.1 Profile
10.20.2 Operation
10.20.3 Truck Business
10.20.4 Output and Sales
10.21 QingLing Motors (Group) Co., Ltd.
10.21.1 Profile
10.21.2 Operation
10.21.3 Truck Business
10.22 SAIC GM Wuling (SGMW)
10.22.1 Profile
10.22.2 Main Business
10.22.3 Output and Sales
10.22.4 Production Base
10.23 SAIC-IVECO Hongyan
10.23.1 Profile
10.23.2 Heavy Truck Business
10.23.3 Sales Goal for 2017
10.24 Hubei Tri-Ring Special Vehicle Co., Ltd.
10.24.1 Profile
10.24.2 Truck Business
10.24.3 Output and Sales
10.24.4 Developments
10.25 XCMG Automobile Co., Ltd.
10.25.1 Profile
10.25.2 Heavy Truck Business
10.25.3 Capacity Distribution
10.26 GAC HINO Motors Co., Ltd.
10.26.1 Profile
10.26.2 Operation
10.26.3 Heavy Truck Business
10.26.4 Capacity
10.27 Zhejiang Feidie Automobile Manufacturing Co., Ltd.
10.27.1 Profile
10.27.2 Truck Business
10.28 Baotou Bei Ben Heavy-Duty Truck Co., Ltd.
10.28.1 Profile
10.28.2 Heavy Truck Business
10.29 Shanxi Dayun Automobile Manufacturing Co., Ltd
10.29.1 Profile
10.29.2 Truck Business
中国主要客车企业智能运营系统
2005-2021年中国客车产销量
2005-2021年中国客车市场结构
2014年中国客车企业TOP10
2015年中国客车企业TOP10
2016年中国客车企业TOP10
2017年中国客车企业TOP10
2014-2017年中国主要客车企业营业收入
2014-2017年中国主要客车企业净利润
2014-2017年中国主要客车企业毛利率
2014-2016年中国各类客车销量(分用途)
2016年中国大中型座位客车市场结构(分用途)
2014-2016年中国各类公交车销量
2009-2016年中国校车销量
2014-2017年中国天然气客车产销量
2005-2021年中国大型客车及底盘产量
2005-2021年中国大型客车及底盘销量
2014年中国大型客车整车企业TOP10
2014年中国大型客车底盘企业市场份额
2015年中国大型客车整车企业TOP10
2015年中国大型客车底盘企业市场份额
2016年中国大型客车整车企业TOP10
2016年中国大型客车底盘企业市场份额
2017年中国大型客车整车企业TOP10
2017年中国大型客车底盘企业市场份额
2005-2021年中国中型客车及底盘产量
2005-2021年中国中型客车及底盘销量
2014年中国中型客车整车企业TOP10
2014年中国中型客车底盘企业市场份额
2015年中国中型客车整车企业TOP10
2015年中国中型客车底盘企业市场份额
2016年中国中型客车整车企业TOP10
2016年中国中型客车底盘企业市场份额
2017年中国中型客车整车企业TOP10
2017年中国中型客车底盘企业市场份额
2005-2021年中国轻型客车及底盘产量
2005-2021年中国轻型客车及底盘销量
2014年中国轻型客车整车企业TOP10
2014年中国轻型客车底盘企业市场份额
2015年中国轻型客车整车企业TOP10
2015年中国轻型客车底盘企业市场份额
2016年中国轻型客车整车企业TOP10
2016年中国轻型客车底盘企业市场份额
2017年中国轻型客车整车企业TOP10
2017年中国轻型客车底盘企业市场份额
2016-2017年中国新能源客车产量
2016-2017年中国新能源客车(分厂商)产量TOP20
2016-2017年中国纯电动客车(分厂商)产量TOP20
2016-2017年中国插电式混合动力客车(分厂商)产量TOP 20
2017年电动客车补贴标准
2014-2016年中国主要客车企业原材料成本对比
中国商用车变速器主要企业市场份额
中国主要商用车变速器配套企业
中国主要客车企业轮毂供应商
2004-2017年中国公路客运情况
2013-2016年中国高铁营业里程
2001-2016年中国旅游业总收入
2008-2017年中国黄金周游客数量
卡车(货车)细分类型
卡车应用细分行业分类
中国主要重卡厂商技术引进情况
中国机动车国五标准实施计划表
中国车辆国IV与国V排放标准对比
公路货运车辆超限超载认定标准(以6轴为例)
商用车车联网政策法规
国内与国外卡车车联网盘点
2010-2021年中国载货车保有量
2010-2021年中国卡车产量
2010-2021年中国卡车销量
2016-2017年中国各类卡车细分产品产量及增速
2016-2017年中国各类卡车细分产品销量及增速
2016年1-12月中国货车出口量统计表
2016年1-12月中国货车进口量统计表
2016-2017年中国前10大企业卡车销量及市场份额
2010-2021年中国重型货车完整车辆产销量
2010-2021年中国重型货车非完整车辆产销量
2010-2021年中国半挂牵引车产销量
2016-2017年中国重型货车完整车辆TOP10企业销量及市场份额
2016-2017年中国重型货车非完整车辆TOP10企业销量及市场份额
2016-2017年中国半挂牵引车TOP10企业销量及市场份额
2014-2021年中国天然气重卡销量
中国天然气重卡主要企业
中国各企业推出的高端重卡产品
2010-2021年中国中型货车完整车辆产销量
2010-2021年中国中型货车非完整车辆产销量
2016-2017年中国中型货车完整车辆TOP10企业销量及市场份额
2016-2017年中国中型货车非完整车辆TOP10企业销量及市场份额
2010-2021年中国轻型货车完整车辆产销量
2010-2021年中国轻型货车非完整车辆产销量
2016-2017年中国轻型货车完整车辆TOP10企业销量及市场份额
2016-2017年中国轻型货车非完整车辆TOP10企业销量及市场份额
2010-2021年中国微型货车完整车辆产销量
2010-2021年中国微型货车非完整车辆产销量
2016-2017年中国微型货车完整车辆TOP10企业销量及市场份额
汽车产业链
卡车行业成本构成
中国主要重卡企业变速器配套情况
2010-2017年中国镀锌板(带)产销量
2014-2017年中国(上海)镀锌板卷价格
2010-2017年中国冷轧薄板产销量
2016-2017年中国(上海、天津、广州)冷轧板卷价格
2012-2017年中国天然橡胶现期货价格
2010-2017年中国固定资产投资完成额
2010-2017年中国房地产开发投资完成额
2005-2017年中国房屋新开工面积及销售面积
2005-2017年中国公路货运量及货物周转量
2012-2017年宇通客车主要财务指标
2013-2016年宇通客车主营收入构成(分业务)
2013-2016年宇通客车主营收入构成(分区域)
2012-2017年宇通客车各类产品产销量
2015-2016年宇通客车销售结构
2014-2017年宇通新能源客车产量
2012-2016年宇通新能源客车销量
2015-2016年宇通客车各类新能源客车销量
2009-2016年宇通客车研发费用
2014-2016年宇通客车产品生产成本构成
2015-2021年宇通客车营业收入、净利润及毛利率预测
2012-2017年金龙汽车主要财务指标
2015-2016年金龙汽车主要产品营业收入及毛利率
2013-2016年金龙汽车主营收入构成(分区域)
2014-2016年金龙汽车主要子公司营业收入及净利润
2012-2017年金龙汽车各子公司客车产量
2012-2017年金龙汽车各子公司客车销量
2012-2017年金龙汽车卡车产销量
2014-2017年金龙新能源客车产量
2015-2016年金龙各类新能源客车销量(分长度)
2015-2016年金龙各类新能源客车销量(分用途)
金龙新能源客车核心零部件外购比例
2010-2016年金龙汽车研发费用
2013-2016年金龙汽车生产成本构成
2015-2021年金龙汽车营业收入、净利润及毛利率
2012-2017年中通客车主要财务指标
2013-2016年中通客车主营收入构成(分业务)
2013-2016年中通客车主营收入构成(分区域)
2012-2017年中通客车产销量
2014-2017年中通新能源客车产量
2012-2016年中通客车研发费用
2013-2016年中通客车生产成本构成
2015-2021年中通客车营业收入、净利润及毛利率
2010-2017年福田汽车主要财务指标
2014-2016年福田汽车主营收入构成(分业务)
2013-2016年福田汽车主营收入构成(分区域)
2012-2017年福田汽车各类客车产销量
2014-2017年福田新能源客车产量
2013-2016年福田欧辉新能源客车销量
2010-2017年北汽集团(福田汽车)重卡产销量
2010-2017年北汽集团(福田汽车)中卡产销量
2010-2017年北汽集团轻卡产销量
2010-2017年北汽集团微卡产销量
2016年北京福田戴姆勒产能
2010-2016年福田汽车研发费用
2015-2021年福田汽车营业收入、净利润及毛利率
2012-2017年安凯客车财务指标
2015-2016年安凯客车主营收入构成(分业务)
2013-2016年安凯客车主营收入构成(分区域)
2012-2017年安凯客车产销量
2014-2017年安凯新能源客车产量
2010-2016年安凯客车研发费用
2015-2016年安凯客车生产成本构成
2012-2017年曙光股份财务指标
2013-2016年曙光股份主营收入构成(分业务)
2013-2016年曙光股份主营收入构成(分区域)
2012-2017年曙光股份(丹东黄海)客车产销量
2014-2017年曙光股份黄海新能源客车产量
2014-2016年曙光股份生产成本构成
2012-2017年亚星客车财务指标
2013-2016年亚星客车主营收入构成(分业务)
2013-2016年亚星客车主营收入构成(分区域)
2012-2017年亚星客车产销量
2014-2016年亚星新能源客车产销量
2015-2016年亚星新能源客车补贴收入
2010-2016年亚星客车研发费用
2014-2016年亚星客车生产成本构成
2012-2017年比亚迪财务指标
2013-2016年比亚迪主营收入构成(分业务)
2015-2016年比亚迪主营收入构成(分区域)
2012-2017年比亚迪客车产销量
比亚迪新能源客车主要产品
2016年比亚迪新能源主要整车生产基地产能及产量(万台)
2016年比亚迪重点订单情况
2012-2017年江淮汽车财务指标
2015-2016年江淮汽车主营收入构成(分业务)
2013-2016年江淮汽车主营收入构成(分区域)
2012-2017年江淮汽车客车产销量
2010-2017年安徽江淮汽车重卡产销量
2010-2017年安徽江淮汽车中卡产销量
2010-2017年安徽江淮汽车轻卡产销量
2016年江淮汽车主要卡车产能分布
2010-2016年江淮汽车研发费用
2016年江淮汽车生产成本构成
2014-2021年江淮汽车营业收入、净利润及毛利率
2012-2017年金杯汽车财务指标
2013-2016年金杯汽车主营收入构成(分业务)
2013-2016年金杯汽车主营收入构成(分区域)
2012-2017年金杯汽车商用车产销量
2012-2016年金杯汽车研发费用
2014-2016年金杯汽车生产成本构成
2015-2021年金杯汽车营业收入、净利润及毛利率
2012-2017年江铃汽车财务指标
2013-2016年江铃汽车主营收入构成(分业务)
2012-2017年江铃汽车客车产销量
2010-2017年江铃集团轻卡产销量
2016年江铃集团主要卡车产能分布
2010-2016年江铃汽车研发费用
2015-2021年江铃汽车营业收入、净利润及毛利率
2012-2017年东风汽车财务指标
2013-2016年东风汽车主营收入构成(分业务)
2013-2016年东风汽车主营收入构成(分区域)
2012-2017年东风汽车客车产销量
2010-2017年东风汽车重卡产销量
2010-2017年东风汽车中卡产销量
2010-2017年东风汽车轻卡产销量
2012-2017年东风汽车微卡产销量
2016年东风集团卡车产能分布
2010-2016年东风汽车研发费用
2014-2016年东风汽车生产成本构成
2015-2021年东风汽车营业收入、净利润及毛利率
2012-2017年上汽大通客车产销量
2016年上汽大通产能(包括新能源)
2016年上汽大通在建工程
2015-2016年上汽大通新能源汽车产销量及销售收入
2010-2017年一汽解放重卡产销量
2010-2017年一汽解放中卡产销量
2010-2017年一汽解放轻卡产销量
2010-2017年一汽解放微卡产销量
一汽解放主要天燃气卡车一览
一汽集团主要卡车生产基地
2010-2016年中国重汽营业收入及净利润
2010-2016年中国重汽毛利率
2016年中国重汽营业收入构成(分业务)
2010-2017年中国重汽集团重卡产销量
2010-2017年中国重汽集团中卡产销量
2010-2017年中国重汽集团轻卡产销量
中国重汽重卡产品族谱
中国重汽主要产品配置
陕汽集团主要重卡产品
2010-2017年陕西汽车集团重卡产销量
2010-2017年陕西汽车集团中卡产销量
2010-2017年陕西汽车集团轻卡产销量
2012-2016年华菱汽车资产及净利润
华菱星马产品系列
2015-2016年安徽华菱汽车卡车产销量
2015-2016年安徽华菱汽车国内外卡车销量
2010-2016年庆铃汽车营业收入及净利润
2010-2016年庆铃汽车毛利率
2015-2016年江淮汽车主要产品收入
2010-2017年庆铃汽车重卡产销量
2010-2017年庆铃汽车中卡产销量
2010-2017年庆铃汽车轻卡产销量
上汽通用五菱发展简史
上汽通用五菱主要卡车(微货)产品
2010-2017年上汽通用五菱微卡产销量
上汽通用五菱生产基地分布
2010-2017年上汽依维柯红岩重卡产销量
上汽依维柯红岩2017年销售目标
三环专用车主要重卡产品
2010-2017年三环专用汽车重卡产销量
2010-2017年三环专用汽车中卡产销量
2010-2017年三环专用汽车轻卡产销量
2010-2017年徐工汽车重卡产销量
2016年徐工汽车主要卡车产能分布
2012-2016年广汽日野资产、负债及营业收入
2010-2017年日野重卡产销量
2016年广汽日野产能情况
2010-2017年飞碟汽车重卡产销量
2010-2017年飞碟汽车中卡产销量
2010-2017年飞碟汽车轻卡产销量
2010-2017年北奔重汽卡车产销量
2010-2017年大运汽车重卡产销量
2010-2017年大运汽车中卡产销量
2010-2017年大运汽车轻卡产销量
Intelligent Operation Systems of Major Bus Enterprises in China
Output and Sales Volume of Bus in China, 2005-2021E
Bus Market Structure in China, 2005-2021E
TOP10 Bus Enterprises in China, 2014
TOP10 Bus Enterprises in China, 2015
TOP10 Bus Enterprises in China, 2016
TOP10 Bus Enterprises in China, 2017
Revenue of Major Bus Enterprises in China, 2014-2017
Net Income of Major Bus Enterprises in China, 2014-2017
Gross Margin of Major Bus Enterprises in China, 2014-2017
Sales Volume of Buses in China by Purpose, 2014-2016
Medium and Large Coach Market Structure in China by Purpose, 2016
Sales Volume of Buses in China by Type, 2014-2016
Sales Volume of School Bus in China, 2009-2016
Output and Sales Volume of Natural Gas Bus in China, 2014-2017
Output of Large Bus and Chassis in China, 2005-2021E
Sales Volume of Large Bus and Chassis in China, 2005-2021E
TOP10 Large Bus Enterprises in China, 2014
Market Share of Large Bus Chassis Enterprises in China, 2014
TOP10 Large Bus Enterprises in China, 2015
Market Share of Large Bus Chassis Enterprises in China, 2015
TOP10 Large Bus Enterprises in China, 2016
Market Share of Large Bus Chassis Enterprises in China, 2016
TOP10 Large Bus Enterprises in China, 2017
Market Share of Large Bus Chassis Enterprises in China, 2017
Output of Medium Bus and Chassis in China, 2005-2021E
Sales Volume of Medium Bus and Chassis in China, 2005-2021E
TOP10 Medium Bus Enterprises in China, 2014
Market Share of Medium Bus Chassis Enterprises in China, 2014
TOP10 Medium Bus Enterprises in China, 2015
Market Share of Medium Bus Chassis Enterprises in China, 2015
TOP10 Medium Bus Enterprises in China, 2016
Market Share of Medium Bus Chassis Enterprises in China, 2016
TOP10 Medium Bus Enterprises in China, 2017
Market Share of Medium Bus Chassis Enterprises in China, 2017
Output of Light Bus and Chassis in China, 2005-2021E
Sales Volume of Light Bus and Chassis in China, 2005-2021E
TOP10 Light Bus Enterprises in China, 2014
Market Share of Light Bus Chassis Enterprises in China, 2014
TOP10 Light Bus Enterprises in China, 2015
Market Share of Light Bus Chassis Enterprises in China, 2015
TOP10 Light Bus Enterprises in China, 2016
Market Share of Light Bus Chassis Enterprises in China, 2016
TOP10 Light Bus Enterprises in China, 2017
Market Share of Light Bus Chassis Enterprises in China, 2017
Output of New Energy Bus in China, 2016-2017
Output of TOP20 New Energy Bus Enterprises in China, 2016-2017
Output of TOP20 Battery Electric Bus Enterprises in China, 2016-2017
Output of TOP20 Plug-in Hybrid Bus Enterprises in China, 2016-2017
Subsidy Standards for Electric Bus, 2017
Comparison of Raw Material Costs between Major Bus Enterprises in China, 2014-2016
Market Share of Major Commercial Vehicle Transmission Enterprises in China
Major Commercial Vehicle Transmission Suppliers in China
Wheel Suppliers of Major Bus Enterprises in China
Highway Passenger Transport in China, 2004-2017
Operating Mileage of High-speed Railways in China, 2013-2016
Total Tourism Revenue in China, 2001-2016
Number of Tourists in Golden Week in China, 2008-2017
Truck (Freight Vehicle) Segments
Applications of Truck by Sector
Technology Introduction of Major Heavy Truck Manufacturers in China
Schedules of Implementation of National V Emission Standards for Motor Vehicles in China
Identification Standards for Overrun & Overload of Road Freight Vehicles (in 6-axis case)
Policies and Regulations for Commercial Vehicle Telematics
News about Truck Telematics at Home and Abroad
Ownership of Trucks in China, 2010-2021E
Output of Trucks in China, 2010-2021E
Sales Volume of Trucks in China, 2010-2021E
Output of Trucks and YoY Growth in China by Product Segment, 2016-2017
Sales Volume of Trucks and YoY Growth in China by Product Segment, 2016-2017
Export Volume of Trucks in China, Jan.-Dec. 2016
Import Volume of Trucks in China, Jan.-Dec. 2016
Sales Volume and Market Share of TOP10 Truck Enterprises in China, 2016-2017
Output and Sales Volume of Complete Heavy Truck in China, 2010-2021E
Output and Sales Volume of Incomplete Heavy Truck in China, 2010-2021E
Output and Sales Volume of Semi-trailer Towing Vehicle in China, 2010-2021E
Sales Volume and Market Share of TOP10 Complete Heavy Truck Enterprises in China, 2016-2017
Sales Volume and Market Share of TOP10 Incomplete Heavy Truck Enterprises in China, 2016-2017
Output and Sales Volume of TOP10 Semi-trailer Towing Vehicle Enterprises in China, 2016-2017
Sales Volume of Natural Gas Heavy Truck in China, 2014-2021E
Major Natural Gas Heavy Truck Enterprises in China
High-end Heavy Truck Products of Enterprises in China
Output and Sales Volume of Complete Medium Truck in China, 2010-2021E
Output and Sales Volume of Incomplete Medium Truck in China, 2010-2021E
Sales Volume and Market Share of TOP10 Complete Medium Truck Enterprises in China, 2016-2017
Sales Volume and Market Share of TOP10 Incomplete Medium Truck Enterprises in China, 2016-2017
Output and Sales Volume of Complete Light Truck in China, 2010-2021E
Output and Sales Volume of Incomplete Light Truck in China, 2010-2021E
Sales Volume and Market Share of TOP10 Complete Light Truck Enterprises in China, 2016-2017
Sales Volume and Market Share of TOP10 Incomplete Light Truck Enterprises in China, 2016-2017
Output and Sales Volume of Complete Mini Truck in China, 2010-2021E
Output and Sales Volume of Incomplete Mini Truck in China, 2010-2021E
Sales Volume and Market Share of TOP10 Complete Mini Truck Enterprises in China, 2016-2017
Vehicle Industry Chain
Cost Structure of Truck Industry
Transmission Supply Relationship of Major Heavy Truck Enterprises in China
Output and Sales Volume of Galvanized Sheet (Strip) in China 2010-2017
Price of Galvanized Coil in China (Shanghai), 2014-2017
Output and Sales Volume of Cold Rolled Sheet in China, 2010-2017
Price of Cold Rolled Coil in China (Shanghai, Tianjin, Guangzhou), 2016-2017
Price of Natural Rubber Futures in China, 2012-2017
Completed Investment in Fixed Assets in China, 2010-2017
Completed Investment in Real Estate Development in China, 2010-2017
New Housing Starts and Sales Area in China, 2005-2017
Highway Freight Volume and Turnover in China, 2005-2017
Main Financial Indices of Zhengzhou Yutong Bus, 2012-2017
Operating Revenue Structure of Zhengzhou Yutong Bus by Business, 2013-2016
Operating Revenue Structure of Zhengzhou Yutong Bus by Region, 2013-2016
Output and Sales Volume of Zhengzhou Yutong Bus by Product, 2012-2017
Sales Structure of Zhengzhou Yutong Bus, 2015-2016
Output of New Energy Bus of Zhengzhou Yutong Bus, 2014-2017
Sales Volume of New Energy Bus of Zhengzhou Yutong Bus, 2012-2016
Sales Volume of New Energy Bus of Zhengzhou Yutong Bus by Type, 2015-2016
R&D Costs of Zhengzhou Yutong Bus, 2009-2016
Production Cost Structure of Zhengzhou Yutong Bus, 2014-2016
Revenue, Net Income and Gross Margin of Zhengzhou Yutong Bus, 2015-2021E
Main Financial Indices of Xiamen King Long Motor Group, 2012-2017
Revenue and Gross Margin of Xiamen King Long Motor Group by Product, 2015-2016
Operating Revenue Structure of Xiamen King Long Motor Group by Region, 2013-2016
Revenue and Net Income of Main Subsidiaries of Xiamen King Long Motor Group, 2014-2016
Bus Output of Xiamen King Long Motor Group’s Subsidiaries, 2012-2017
Bus Sales Volume of Xiamen King Long Motor Group’s Subsidiaries, 2012-2017
Truck Output and Sales Volume of Xiamen King Long Motor Group, 2012-2017
Sales Volume of New Energy Bus of Xiamen King Long Motor Group by Length, 2015-2016
Sales Volume of New Energy Bus of Xiamen King Long Motor Group by Purpose, 2015-2016
Purchased Core Parts as a Percentage of Total Core Parts for New Energy Bus of Xiamen King Long Motor Group
R&D Costs of Xiamen King Long Motor Group, 2010-2016
Production Cost Structure of Xiamen King Long Motor Group, 2013-2016
Revenue, Net Income and Gross Margin of Xiamen King Long Motor Group, 2015-2021E
Main Financial Indices of Zhongtong Bus and Holding, 2012-2017
Operating Revenue Structure of Zhongtong Bus and Holding by Business, 2013-2016
Operating Revenue Structure of Zhongtong Bus and Holding by Region, 2013-2016
Output and Sales Volume of Zhongtong Bus and Holding, 2012-2017
Output of New Energy Bus of Zhongtong Bus and Holding, 2014-2017
R&D Costs of Zhongtong Bus and Holding, 2012-2016
Production Cost Structure of Zhongtong Bus and Holding, 2013-2016
Revenue, Net Income and Gross Margin of Zhongtong Bus and Holding, 2015-2021E
Main Financial Indices of Beiqi Foton Motor, 2010-2017
Operating Revenue Structure of Beiqi Foton Motor by Business, 2014-2016
Operating Revenue Structure of Beiqi Foton Motor by Region, 2013-2016
Output and Sales Volume of Buses of Beiqi Foton Motor by Type, 2012-2017
Output of New Energy Bus of Beiqi Foton Motor, 2014-2017
Sales Volume of AUV New Energy Bus of Beiqi Foton Motor, 2013-2016
Output and Sales of Heavy Truck of BAIC Group (Beiqi Foton Motor), 2010-2017
Output and Sales of Medium Truck of BAIC Group (Beiqi Foton Motor), 2010-2017
Output and Sales of Light Truck of BAIC Group, 2010-2017
Output and Sales of Mini Truck of BAIC Group, 2010-2017
Capacity of Beijing Foton Daimler Automotive, 2016
R&D Costs of Beiqi Foton Motor, 2010-2016
Revenue, Net Income and Gross Margin of Beiqi Foton Motor, 2015-2021E
Financial Indices of Anhui Ankai Automobile, 2012-2017
Operating Revenue Structure of Anhui Ankai Automobile by Business, 2015-2016
Operating Revenue Structure of Anhui Ankai Automobile by Region, 2013-2016
Output and Sales Volume of Anhui Ankai Automobile, 2012-2017
Output of New Energy Bus of Anhui Ankai Automobile, 2014-2017
R&D Costs of Anhui Ankai Automobile, 2010-2016
Production Cost Structure of Anhui Ankai Automobile, 2015-2016
Financial Indices of Liaoning SG Automotive Group, 2012-2017
Operating Revenue Structure of Liaoning SG Automotive Group by Business, 2013-2016
Operating Revenue Structure of Liaoning SG Automotive Group by Region, 2013-2016
Output and Sales Volume of Bus of Liaoning SG Automotive Group (Dandong Huanghai Automotive), 2012-2017
Output of Huanghai New Energy Bus of Liaoning SG Automotive Group, 2014-2017
Production Cost Structure of Liaoning SG Automotive Group, 2014-2016
Financial Indices of Yangzhou Asiastar Bus, 2012-2017
Operating Revenue Structure of Yangzhou Asiastar Bus by Business, 2013-2016
Operating Revenue Structure of Yangzhou Asiastar Bus by Region, 2013-2016
Output and Sales Volume of Yangzhou Asiastar Bus, 2012-2017
Output and Sales Volume of New Energy Bus of Yangzhou Asiastar Bus, 2014-2016
Subsidy Revenue of New Energy Bus of Yangzhou Asiastar Bus, 2015-2016
R&D Costs of Yangzhou Asiastar Bus, 2010-2016
Production Cost Structure of Yangzhou Asiastar Bus, 2014-2016
Financial Indices of BYD, 2012-2017
Operating Revenue Structure of BYD by Business, 2013-2016
Operating Revenue Structure of BYD by Region, 2015-2016
Output and Sales Volume of Bus of BYD, 2012-2017
Main New Energy Bus Products of BYD
Capacity and Output of Main Complete Vehicle Manufacturing Bases of BYD, 2016
Keys Orders of BYD, 2016
Financial Indices of Anhui Jianghuai Automobile Group, 2012-2017
Operating Revenue Structure of Anhui Jianghuai Automobile Group by Business, 2015-2016
Operating Revenue Structure of Anhui Jianghuai Automobile Group by Region, 2013-2016
Output and Sales Volume of Bus of Anhui Jianghuai Automobile Group, 2012-2017
Output and Sales Volume of Heavy Truck of Anhui Jianghuai Automobile Group, 2010-2017
Output and Sales Volume of Medium Truck of Anhui Jianghuai Automobile Group, 2010-2017
Output and Sales Volume of Light Truck of Anhui Jianghuai Automobile Group, 2010-2017
Truck Capacity Distribution of Anhui Jianghuai Automobile Group, 2016
R&D Costs of Anhui Jianghuai Automobile Group, 2010-2016
Production Cost Structure of Anhui Jianghuai Automobile Group, 2016
Revenue, Net Income and Gross Margin of Anhui Jianghuai Automobile Group, 2014-2021E
Financial Indices of Shenyang Jinbei Automotive, 2012-2017
Operating Revenue Structure of Shenyang Jinbei Automotive by Business, 2013-2016
Operating Revenue Structure of Shenyang Jinbei Automotive by Region, 2013-2016
Output and Sales Volume of Commercial Vehicle of Shenyang Jinbei Automotive, 2012-2017
R&D Costs of Shenyang Jinbei Automotive, 2012-2016
Production Cost Structure of Shenyang Jinbei Automotive, 2014-2016
Revenue, Net Income and Gross Margin of Shenyang Jinbei Automotive, 2015-2021E
Financial Indices of Jiangling Motors, 2012-2017
Operating Revenue Structure of Jiangling Motors by Business, 2013-2016
Bus Output and Sales Volume of Jiangling Motors, 2012-2017
Output and Sales Volume of Light Truck of Jiangling Motors Group, 2010-2017
Capacity Distribution of Main Trucks of Jiangling Motors Group, 2016
R&D Costs of Jiangling Motors, 2010-2016
Revenue, Net Income and Gross Margin of Jiangling Motors, 2015-2021E
Financial Indices of Dongfeng Motor Corporation, 2012-2017
Operating Revenue Structure of Dongfeng Motor Corporation by Business, 2013-2016
Operating Revenue Structure of Dongfeng Motor Corporation by Region, 2013-2016
Output and Sales Volume of Bus of Dongfeng Motor Corporation, 2012-2017
Output and Sales Volume of Heavy Truck of Dongfeng Motor Corporation, 2010-2017
Output and Sales Volume of Medium Truck of Dongfeng Motor Corporation, 2010-2017
Output and Sales Volume of Light Truck of Dongfeng Motor Corporation, 2010-2017
Output and Sales Volume of Mini Truck of Dongfeng Motor Corporation, 2012-2017
Truck Capacity Distribution of Dongfeng Motor Group, 2016
R&D Costs of Dongfeng Motor Corporation, 2010-2016
Production Cost Structure of Dongfeng Motor Corporation, 2014-2016
Revenue, Net Income and Gross Margin of Dongfeng Motor Corporation, 2015-2021E
Bus Output and Sales Volume of SAIC MAXUS Automotive, 2012-2017
Capacity (including New Energy Vehicle) of SAIC MAXUS Automotive, 2016
Projects under Construction of SAIC MAXUS Automotive, 2016
Output, Sales Volume and Revenue of New Energy Vehicle of SAIC MAXUS Automotive, 2015-2016
Output and Sales Volume of Heavy Truck of FAW Jiefang Automotive, 2010-2017
Output and Sales Volume of Medium Truck of FAW Jiefang Automotive, 2010-2017
Output and Sales Volume of Light Truck of FAW Jiefang Automotive, 2010-2017
Output and Sales Volume of Mini Truck of FAW Jiefang Automotive, 2010-2017
List of Main Natural Gas Trucks of FAW Jiefang Automotive
Main Truck Manufacturing Bases of FAW Group
Revenue and Net Income of SINOTRUK, 2010-2016
Gross Margin of SINOTRUK, 2010-2016
Revenue Structure of SINOTRUK by Business, 2016
Output and Sales Volume of Heavy Truck of SINOTRUK, 2010-2017
Output and Sales Volume of Medium Truck of SINOTRUK, 2010-2017
Output and Sales Volume of Light Truck of SINOTRUK, 2010-2017
Heavy Truck Family Tree of SINOTRUK
Configuration of Main Products of SINOTRUK
Main Heavy Truck Products of Shaanxi Automobile Group
Output and Sales Volume of Heavy Truck of Shaanxi Automobile Group, 2010-2017
Output and Sales Volume of Medium Truck of Shaanxi Automobile Group, 2010-2017
Output and Sales Volume of Light Truck of Shaanxi Automobile Group, 2010-2017
Assets and Net Income of Hualing Xingma Automobile Group, 2012-2016
Product Lines of Hualing Xingma Automobile Group
Truck Output and Sales Volume of Anhui Hualing Automobile, 2015-2016
Truck Output and Sales Volume of Anhui Hualing Automobile by Region, 2015-2016
Revenue and Net Income of QingLing Motors Group, 2010-2016
Gross Margin of QingLing Motors Group, 2010-2016
Revenue of QingLing Motors Group by Product, 2015-2016
Output and Sales Volume of Heavy Truck of QingLing Motors Group, 2010-2017
Output and Sales Volume of Medium Truck of QingLing Motors Group, 2010-2017
Output and Sales Volume of Light Truck of QingLing Motors Group, 2010-2017
Brief History of SAIC GM Wuling
Main Truck (Mini Truck) Products of SAIC GM Wuling
Output and Sales Volume of Mini Truck of SAIC GM Wuling, 2010-2017
Distribution of Manufacturing Bases of SAIC GM Wuling
Output and Sales Volume of Heavy Truck of SAIC-IVECO Hongyan, 2010-2017
Sales Target of SAIC-IVECO Hongyan in 2017
Main Heavy Truck Products of Hubei Tri-Ring Special Vehicle
Output and Sales Volume of Heavy Truck of Hubei Tri-Ring Special Vehicle, 2010-2017
Output and Sales Volume of Medium Truck of Hubei Tri-Ring Special Vehicle, 2010-2017
Output and Sales Volume of Light Truck of Hubei Tri-Ring Special Vehicle, 2010-2017
Output and Sales Volume of Heavy Truck of XCMG Automobile, 2010-2017
Distribution of Main Truck Capacity of XCMG Automobile, 2016
Assets, Liabilities and Revenue of GAC HINO Motors, 2012-2016
Output and Sales Volume of Heavy Truck of GAC HINO Motors, 2010-2017
Capacity of GAC HINO Motors, 2016
Output and Sales Volume of Heavy Truck of Zhejiang Feidie Automobile Manufacturing, 2010-2017
Output and Sales Volume of Medium Truck of Zhejiang Feidie Automobile Manufacturing, 2010-2017
Output and Sales Volume of Light Truck of Zhejiang Feidie Automobile Manufacturing, 2010-2017
Truck Output and Sales Volume of Baotou Bei Ben Heavy-Duty Truck, 2010-2017
Output and Sales Volume of Heavy Truck of Shanxi Dayun Automobile Manufacturing, 2010-2017
Output and Sales Volume of Medium Truck of Shanxi Dayun Automobile Manufacturing, 2010-2017
Output and Sales Volume of Light Truck of Shanxi Dayun Automobile Manufacturing, 2010-2017
如果这份报告不能满足您的要求,我们还可以为您定制报告,请 留言说明您的详细需求。
|