|
|
|
报告导航:研究报告—
TMT产业—电子半导体
|
|
2017-2021年全球及中国有机发光二极管(OLED)行业研究报告 |
 |
字数:3.3万 |
页数:135 |
图表数:149 |
|
中文电子版:12000元 |
中文纸版:6000元 |
中文(电子+纸)版:12500元 |
|
英文电子版:2800美元 |
英文纸版:3000美元 |
英文(电子+纸)版:3100美元 |
|
编号:CYH063
|
发布日期:2017-09 |
附件:下载 |
 |
|
|
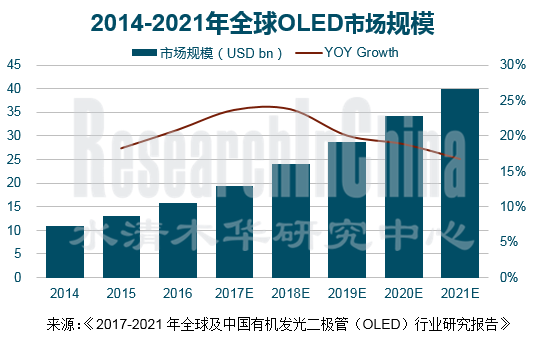
2016年全球OLED市场规模约157亿美元,同比增长20.8%。在苹果iPhone 2017-2018年多款机型将使用OLED屏幕的消息示范带动下,OLED屏成为智能手机市场一大热点,华为、小米、VIVO、OPPO等品牌相继推出约20多款OLED屏手机,有利拉动了OLED需求快速增长,2017年其市场规模预计达194亿美元,至2021年有望达到399亿美元,年均增速在20%以上。
目前,手机是OLED应用最大的市场,2016年全球77%的OLED面板用于手机领域。除此,电视、智能穿戴设备、照明、VR、汽车等领域也开始注重OLED的应用。其中,OLED电视2017年布局明显:索尼时隔10年再次推出OLED电视A1E系列、东芝、松下相继推出电视,夏普最迟将于2018年推出OLED电视。至此,LG、创维、长虹、索尼、夏普、松下、东芝、康佳、飞利浦等超过13家企业主流彩电品牌均选择布局OLED屏。
企业格局方面,2016年,韩国厂商三星和LGD两家企业几乎占据全球90%以上的OLED产能。其中三星主攻中小尺寸面板,2016年三星OLED出货量占全球OLED 手机面板出货量的97%;而LGD主要布局电视等领域用的大尺寸OLED面板。面对激增的OLED市场,这两家企业正加快扩产,稳定市场地位。
三星显示计划在2021年前对位于韩国的OLED显示屏工厂进一步投资至少1万亿韩元(约合9亿美元),用于增加OLED显示屏的生产。而LGD宣布到2020年将在OLED生产线上投资15万亿韩元在韩国投资10.5代大尺寸OLED和6代OLED面板生产线各一条,并在广州上马一条新的第8.5代OLED面板生产线。
中国生产商正处于积极布局OLED,加快实现量产阶段。2016年,先后有信利集团、天马和华星光电等企业OLED产线实现量产,新增产能达75K/M。2017年还将有京东方、天马和维信诺等厂商产线量产,新增69K/M的产能。但受产品良率及技术等限制,产出有限,预计至2018年后产出有望得到集中释放。
另外,日本JDI、台湾友达、鸿海科技/夏普、群创等面板厂商也在布局OLED,但量产进程相对缓慢,其中夏普OLED产品目前还在开发阶段,预计2018年有望进入少量生产,但距离正式量产还需一段距离;JDI于2017年8月宣布因资金问题计划重组,需求全球合作伙伴,继续布局OLED,其中意向企业有鸿海科技及天马微电子等。
水清木华研究中心《2017-2021年全球及中国有机发光二极管(OLED)行业研究报告》着重研究了以下内容:
 全球OLED市场规模、出货量、产能、竞争格局及发展趋势; 全球OLED市场规模、出货量、产能、竞争格局及发展趋势;
手机、电视、穿戴设备、PC、VR、照明和汽车显示屏等下游应用领域发展情况,以及对OLED的需求量;
OLED上游材料及设备市场发展及供应情况;
全球及中国16家重点企业经营情况、OLED业务发展及投资规划等。
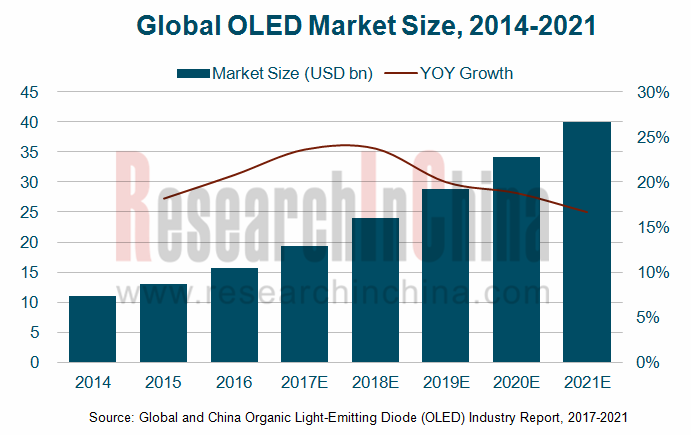
Global OLED market size approximated USD15.7 billion in 2016, a 20.8% rise from a year earlier. Stimulated by reports that Apple will adopt OLED screen for multiple iPhone models in 2017-2018, OLED screen has become a hotspot in the smartphone market. Thanks to the introduction of more than 20 OLED phone models by Huawei, Xiaomi, VIVO, OPPO and other vendors, the demand for OLED has been growing rapidly, expected to create a market worth USD19.4 billion in 2017 and USD39.9 billion in 2021, showing an AAGR of over 20%.
OLED finds the largest application in mobile phone market which consumed 77% of OLED panels worldwide in 2016. Besides, OLED has made its way into TV, intelligent wearable device, lighting, VR and automobile fields. With regard to OLED television in 2017, Sony introduced OLED A1E Series television after ten years, Toshiba and Panasonic have rolled out OLED TVs, and Sharp will launch OLED television by 2018. Thus, more than 13 major color TV brands including LG, Skyworth, Changhong, Sony, Sharp, Panasonic, Toshiba, Konka, and Philips have chosen to use OLED display.
South Korean Samsung and LG Display held a combined over 90% of global OLED capacity. Specializing in small and medium-sized panels, Samsung accounted for 97% of global shipments of OLED panels for mobile phone in 2016; LG Display focuses on large-size OLED panels which are used in TV and other fields. Faced with the burgeoning OLED market, the two companies are speeding up capacity expansion so as to consolidate their market position.
Samsung Display plans to invest at least KRW 1 trillion (about USD900 million) on a new OLED display complex in South Korea before 2021 with the aim of boosting OLED display production. LG Display announced that it would invest a total of KRW 15 trillion into OLED production lines through 2020, consisting of one 10.5th generation large-size OLED panel production line and one 6th generation OLED panel production line in South Korea and a new 8.5th generation OLED panel production line in Guangzhou.
Chinese vendors are also scaling up their efforts for OLED with a view to achieve an early mass-production. Truly Group, Tianma Micro-electronics and Shenzhen China Star Optoelectronics Technology put OLED into mass production sucessively in 2016, adding capacity of 75K/M. BOE Technology Group, Tianma Micro-electronics and Visionox will start volume production of OLED in 2017, increasing new capacity of 69K/M. But, limited by low product yield and technical problems, the output is low for now and expected to explode after 2018.
In addition, panel vendors like Japanese JDI and Taiwanese AUO, Hon Hai/Sharp and Innolux have been slow in mass production of OLED. Sharp develops OLED at present, is predicted to produce it in small quantities in 2018, but still has a lot to do to achieve formal mass production. JDI announced on Aug 2017 that it planned to reorganize due to a lack of funds and, if it still wants to be present in OLED, needed global partners (Hon Hai and Tianma Micro-electronics being prospective ones).
Global and China OLED Industry Report, 2017-2021 focuses on the following:
Global OLED market (size, shipments, capacity, competitive landscape, development trend. etc.);
Applications (mobile phone, TV, wearable device, PC, VR, lighting, and automotive display) and their demand for OLED;
Upstream materials & equipment and their supply of OLED;
16 global and Chinese major vendors (operation, OLED business, investment program, etc.).
第一章 OLED简介
1.1 简介
1.1.1 概述
1.1.2 起源
1.1.3 特点
1.2 分类
1.3 应用领域
1.4 产业链
第二章 OLED市场
2.1 市场概述
2.2 全球市场
2.2.1 市场规模
2.2.2 出货量
2.2.3 地区结构
2.3 中国市场
2.3.1 市场现状
2.3.2 政策环境
2.3.3 专利情况
第三章 全球OLED竞争格局
3.1 市场份额
3.2 企业布局
3.3 生产能力
3.4 生产成本
第四章 OLED应用市场
4.1 手机
4.1.1 全球
4.1.2 中国
4.2 电视
4.3 穿戴设备
4.4 电脑
4.5 VR
4.6 照明
4.7 汽车显示屏
4.7.1 整体市场
4.7.2 OLED市场
4.7.3 竞争格局
第五章 OLED上游市场
5.1 产业链
5.2 原材料供应商
5.3 OLED核心环节
5.3.1 中间材料
5.3.2 终端材料
5.4 OLED生产设备
5.4.1 OLED中前端制程设备
5.4.2 OLED后制程设备
5.4.3 OLED检测设备
第六章 OLED厂家研究
6.1 三星显示
6.1.1 公司简介
6.1.2 运营情况
6.1.3 OLED业务
6.2 LG显示
6.2.1 公司简介
6.2.2 运营情况
6.2.3 OLED业务
6.2.4 在华业务
6.3 日本显示
6.3.1 公司简介
6.3.2 运营情况
6.3.3 OLED业务
6.3.4 在华业务
6.4 鸿海科技
6.4.1 公司简介
6.4.2 运营情况
6.4.3 OLED业务
6.5 友达光电
6.5.1 公司简介
6.5.2 运营情况
6.5.3 OLED业务
6.6 京东方
6.6.1 公司简介
6.6.2 运营情况
6.6.3 OLED业务
6.7 华星光电
6.7.1 公司简介
6.7.2 OLED业务
6.8 铼宝
6.8.1 公司简介
6.8.2 运营情况
6.8.3 OLED业务
6.9 维信诺
6.9.1 公司简介
6.9.2 OLED业务
6.10 信利集团
6.10.1 公司简介
6.10.2 运营情况
6.10.3 OLED业务
6.11 四川虹视
6.11.1 公司简介
6.11.2 OLED业务
6.12 中颖电子
6.12.1 公司简介
6.12.2 运营情况
6.12.3 OLED业务
6.13 欧菲光
6.13.1 公司简介
6.13.2 运营情况
6.13.3 OLED业务
6.14 和辉光电
6.14.1 公司简介
6.14.2 OLED业务
6.15 天马
6.15.1 公司简介
6.15.2 运营情况
6.15.3 OLED业务
6.16 群创光电
6.16.1 公司简介
6.16.2 运营情况
6.16.3 OLED业务
第七章 总结及预测
7.1 市场规模
7.2 市场特点
7.3 发展趋势
1 Overview of OLED
1.1 Introduction
1.1.1 Overview
1.1.2 Origin
1.1.3 Features
1.2 Classification
1.3 Applications
1.4 Industry Chain
2 OLED Market
2.1 Overview
2.2 Global
2.2.1 Market Size
2.2.2 Shipments
2.2.3 Regional Structure
2.3 China
2.3.1 Status Quo
2.3.2 Policies
2.3.3 Patents
3 Competitive Landscape of Global OLED Market
3.1 Market Share
3.2 Vendors
3.3 Production Capacity
3.4 Production Costs
4 OLED Application Market
4.1 Mobile Phone
4.1.1 Global
4.1.2 China
4.2 TV
4.3 Wearable Device
4.4 Computer
4.5 VR
4.6 Lighting
4.7 Automotive Display
4.7.1 Overall
4.7.2 OLED
4.7.3 Competitive Landscape
5 OLED Upstream Materials Market
5.1 Industry Chain
5.2 Suppliers of Raw Materials
5.3 Core Links of OLED
5.3.1 Intermediate Materials
5.3.2 Terminal Materials
5.4 OLED Production Equipment
5.4.1 OLED Front and Mid-end Processing Equipment
5.4.2 OLED Back-end Processing Equipment
5.4.3 OLED Inspection Equipment
6 OLED Vendors
6.1 Samsung Display
6.1.1 Profile
6.1.2 Operation
6.1.3 OLED Business
6.2 LG Display
6.2.1 Profile
6.2.2 Operation
6.2.3 OLED Business
6.2.4 Business in China
6.3 Japan Display Inc. (JDI)
6.3.1 Profile
6.3.2 Operation
6.3.3 OLED Business
6.3.4 Business in China
6.4 Hon Hai
6.4.1 Profile
6.4.2 Operation
6.4.3 OLED Business
6.5 AUO
6.5.1 Profile
6.5.2 Operation
6.5.3 OLED Business
6.6 BOE
6.6.1 Profile
6.6.2 Operation
6.6.3 OLED Business
6.7 CSOT
6.7.1 Profile
6.7.2 OLED Business
6.8 RiTdisplay
6.8.1 Profile
6.8.2 Operation
6.8.3 OLED Business
6.9 Visionox
6.9.1 Profile
6.9.2 OLED Business
6.10 Truly Group
6.10.1 Profile
6.10.2 Operation
6.10.3 OLED Business
6.11 Sichuan CCO Display Technology
6.11.1 Profile
6.11.2 OLED Business
6.12 Sino Wealth Electronic
6.12.1 Profile
6.12.2 Operation
6.12.3 OLED Business
6.13 O-Film Tech
6.13.1 Profile
6.13.2 Operation
6.13.3 OLED Business
6.14 Everdisplay Optronics
6.14.1 Profile
6.14.2 OLED Business
6.15 Tianma Micro-electronics
6.15.1 Profile
6.15.2 Operation
6.15.3 OLED Business
6.16 Innolux
6.16.1 Profile
6.16.2 Operation
6.16.3 OLED Business
7 Summary and Forecast
7.1 Market Size
7.2 Market Features
7.3 Development Trend
图:OLED发光原理
图:OLED结构
图:LCD及OLED发展历史
图:显示技术发展历程
图:OLED器件分类
图:PMOLED驱动原理
图:AMOLED驱动原理
图:OLED产业链主要企业
表:OLED驱动IC主要企业
表:OLED各产业链主要厂商
表:OLED和TFT LCD性能对比
图:电视电脑及手机显示屏发展方向
图:2014-2021年全球OLED市场规模
图:2014-2021年全球OLED出货面积
图:2014-2019年全球OLED面板出货面积
表:2015-2021年全球OLED面板出货量
表:2016-2021年全球OLED面板应用领域分布(根据出货量计算)
图:2013-2020年全球OLED产能(分国家)占比
表:2013-2017年中国主要OLED相关产业政策
图:全球十大企业在华OLED专利申请数量
图:中国上市公司OLED专利申请数量
表:2016年OLED设备专利申请量(分国家)
图:2016年全球OLED面板竞争格局
表:中国面板厂商纷纷布局 OLED 产能
表:日本厂商OLED 投资计划
图:2016-2019年全球主要企业可挠式AMOLED面板产能布局
表:2017年全球及中国OLED产能及规划项目
表:TFT LCT与OLED电视价格对比
表:AMOLED与TFT-LCD成本构成
图:OLED成本与良品率的关系
图:2015-2016年5寸FHD AMOLED 与LTPS LCD成本对比
图:显示技术推动智能手机格局变化
图:2014-2021年全球OLED手机出货量及渗透率
图:2016年全球手机面板出货类型占比
图:2014-2020年全球OLED手机出货量
图:全球主要手机品牌OLED手机版数
图:主要手机品牌OLED渗透率
图:2016-2021年全球主流手机厂商OLED渗透率
图:2016年全球用AMOLED屏手机(分品牌)市场占有率
图:苹果手机使用OLED覆盖率
图:搭载全面屏手机
图:2014-2021年中国智能手机OLED显示屏装配率
表:2016-2017年中国主要手机品牌OLED手机产品
图:2016年中国市场各品牌AMOLED手机出货量
图:2015-2016年中国前十大品牌手机面板技术占比
表:2016年中国AMOLED渗透率最高的三大手机品牌
图:2014-2021年全球OLED电视销量
表:中国市场主要OLED电视产品
图:全球主流智能手表用OLED
表:2015-2021年全球穿戴设备用OLED面板出货量
图:智能手表OLED渗透率
图:儿童手表OLED渗透率
图:智能手环OLED渗透率
表:笔记本电脑OLED屏
表:2015-2021年全球PC OLED显示屏需求量
表:最新VR产品采用OLED技术
图:主流VR产品屏幕参数
图:2016-2021年全球VR出货量
图:2016-2021年VR/AR设备市场规模
图:2016年全球VR分品牌市场占有率
图:2015-2016年全球VR投融资规模
图:2015-2016年全球VR投融资规模结构
表:全球主要公司OLED产品
图:2016-2021年全球OLED照明市场规模
图:2016年OLED照明专利数量(分国家)
2016年OLED照明专利数量(按申请人)
图:2016-2021年全球汽车显示屏出货量
图:2013-2021年全球汽车显示市场规模
图:2015-2021年全球汽车显示屏应用分布
图:车载显示屏发展方向
图:和辉光电发布AMOLED车载导航显示屏
图:LG研发车载塑性OLED技术
图:伟世通OLED显示屏
图:2016-2021年全球汽车OLED显示屏市场规模
图:LCD 产业链结构
图:OLED 产业链结构
图:OLED 带来的化工新材料投资机遇
表:三星和LG主要原材料供应商
图:OLED上游材料核心环节
表:中国主要OLED材料及中间体生产商
表:OLED 终端材料的主要供应商
图:全球空穴注入层材料供应商市占率
图:全球空穴传输层供应商市占率
图:全球电子传输层供应商市占率
图:LCD与OLED工艺制程对比
图:OLED与LCD生产设备对比
图:2015-2018年全球AMOLED生产设备分阶段市场规模
图:TFT阵列工艺流程及相关设备
表:TFT阵列主要设备及主要供应商
图:CELL成盒工艺流程及相关设备
图:OLED蒸镀与封装流程
表:Cell成盒工艺设备及主要供应商
图:2020年OLED前中段制程(分设备)市场规模
图:OLED生产线各类设备投资分布
图:OLED后端制程工艺及设备
图:OLED后段制程核心设备
图:OLED后段制程设备投资
图:OLED面板制造工艺检测流程
图:OLED检测相关设备
表:OLED各制程检测设备、供应商及投资规模
表:2012-2017年三星显示销售额及运营利润
图:三星显示OLED业务应用布局
图:2016-2018年三星OLED产能扩充
表:2014-2017年LGD财务指标
图:2016-2017年LGD营业收入分布(分应用领域)
图:2016-2017年LGD出货量
图:2016-2017年LGD产能
表:截至2017年8月LGD公司OLED生产线布局
表:LGD在华工厂
图:JDI’s Vision
图:FY2012-2017年日本显示经营数据
图:FY2016-FY2019JDI公司中期发展规划
图:JDI公司 OLED发展
图:日本显示公司海外生产基地
表:2012-2017年鸿海科技营业收入、净利润及毛利率
表:鸿海科技公司/夏普OLED布局
图:1999-2017年友达光电营业额
图:2016-2017年友达光电(分应用)显示器收入占比
图:2016-2017年友达光电(分尺寸)显示器收入构成
图:京东方DSH战略
表:2012-2017年京东方营业收入、净利润及毛利率
表:2015-2017年京东方各项业务主营收入及毛利率
表:2015-2017年京东方各地区主营收入及占比
图:京东方公司OLED业务发展历程
表:截至2017年6月底京东方OLED生产线布局
表:华星光电液晶面板生产线
表:铼宝科技主要产品
表:2014-2016年铼宝科技营业收入及毛利率
表:截至2017年7月底维信诺OLED生产线及生产规模
表:2014-2017年信利集团营业收入及毛利润
图:2015-2016年信利集团销售额分布
表:2012-2017年中颖电子营业收入、净利润及毛利率
图:2011-2016年中颖电子研发投入及占比
表:中颖电子OLED驱动芯片产品
图:欧菲光发展历程
图:欧菲光全球布局
表:2012-2017年欧菲光营业收入、净利润及毛利率
表:2015-2017年欧菲光营业收入构成
图:深圳天马发展历程
图:深圳天马技术与产线发展历程
表:2012-2017年天马营业收入、净利润及毛利率
图:2012-2016年深圳天马研发投入与占比
表:截至2017年7月底深圳天马公司OLED面板产线及生产规模
表:2014-2017年群创光电营业收入及出货量
图:2015-2017年按季度群创光电(分用途)营业收入占比
图:2015-2017年按季度群创光电(按尺寸)营业收入构成
表:2014-2021年全球OLED市场规模及增速
图:2016-2025年全球OLED(分应用)市场规模
图:可弯折柔性AMOLED显示屏
Luminescence Principle of OLED
Composition of OLED
Evolution of LCD and OLED
Evolution of Display Technology
Classification of OLED Devices
PMOLED Drive Principle
AMOLED Drive Principle
Major Enterprises in OLED Industry Chain
Major OLED Drive IC Companies
Major Manufacturers in OLED Industry Chain
Performance Comparison of OLED and TFT LCD
Development Orientation of Display Screens for TV, Computer and Mobile Phone
Global OLED Market Size, 2014-2021E
Global OLED Shipments by Area, 2014-2021E
Global OLED Panel Shipments by Area, 2014-2019E
Global OLED Panel Shipments, 2015-2021E
Global OLED Panel Application by Shipments, 2016-2021E
Global OLED Capacity Structure by Country, 2013-2020E
China's Main Policies on OLED-related Industries, 2013-2017
OLED Patent Filings by Global Top10 Companies in China
OLED Patent Filings by Chinese Listed Companies
OLED Equipment Patent Applications by Country, 2016
Global OLED Panel Competitive Pattern, 2016
OLED Capacity Built by Chinese Panel Manufacturers
OLED Investment Programs of Japanese Companies
Flexible AMOLED Panel Capacity of Global Major Companies, 2016-2019E
OLED Capacity and Planned Projects in China and Worldwide, 2017
Price Comparison of TFT LCT TV and OLED TV
Cost Structure of AMOLED and TFT-LCD
Relationship between OLED Cost and Yield
Cost Comparison of 5-inch FHD AMOLED and 5-inch LTPS LCD, 2015-2016
Display Technology Drives Changes in Smartphone Pattern
Global OLED Mobile Phone Shipments and Penetration, 2014-2021E
Global Mobile Phone Panel Shipments by Type, 2016
Global OLED Mobile Phone Shipments, 2014-2020E
Number of Mobile Phone Models with OLED of Global Major Mobile Phone Brands
Penetration of OLED in Main Mobile Phone Brands
Penetration of OLED in Global Major Mobile Phone Vendors, 2016-2021E
Market Share of AMOLED Mobile Phones Worldwide by Brand, 2016
Coverage of OLED in Apple Phones
Application in All-screen Mobile Phones
Assembly Rate of OLED Displays for Smartphones in China, 2014-2021E
OLED Phones of Major Mobile Phone Brands in China, 2016-2017
AMOLED Mobile Phone Shipments of Various Brands in China, 2016
Panel Technology Structure of Top10 Mobile Phone Brands in China, 2015-2016
Top3 Mobile Phone Brands with the Highest Penetration of AMOLED in China, 2016
Global OLED TV Sales, 2014-2021E
Key OLED TVs in China
OLEDs for Mainstream Smart Watches Worldwide
Global Shipments of OLED Panels for Wearable Devices, 2015-2021E
Penetration of OLED for Smart Watches
Penetration of OLED for Kids' Watches
Penetration of OLED for Smart Bands
Notebook PC OLED Display
Global Demand for PC OLED Display, 2015-2021E
OLED Technologies Adopted on Latest VR Products
Screen Parameters of Mainstream VR Products
Global VR Shipments, 2016-2021E
Global VR/AR Device Market Size, 2016-2021E
Market Share of VR Products Worldwide by Brand, 2016
Global VR Investment and Financing, 2015-2016
Global VR Investment and Financing Structure, 2015-2016
OLED Products of Global Major Companies
Global OLED Lighting Market Size, 2016-2021E
OLED Lighting Patent Applications by Country, 2016
OLED Lighting Patent Applications by Applicant, 2016
Global Automotive Display Shipments, 2016-2021E
Global Automotive Display Market Size, 2013-2021E
Global Automotive Display Application Structure, 2015-2021E
Development Orientation of In-vehicle Display
AMOLED In-vehicle Navigation Display Launched by EverDisplay Optronics
In-vehicle POLED Technology Developed by LG
Visteon's OLED Displays
Global Automotive OLED Display Market Size, 2016-2021E
Structure of LCD Industry Chain
Structure of OLED Industry Chain
Investment Opportunities Brought by OLED in New Chemical Materials
Key Raw Material Suppliers for Samsung and LG
Core Links of OLED Upstream Materials
Major Manufacturers of OLED Materials and Intermediates in China
Key Suppliers of OLED Terminal Materials
Market Share of HIL Material Suppliers Worldwide
Market Share of HTL Suppliers Worldwide
Market Share of ETL Suppliers Worldwide
Comparison of LCD and OLED Processes
Comparison of OLED and LCD Production Equipment
Global AMOLED Production Equipment Market Size by Stage, 2015-2018E
TFT Array Process and Related Equipment
Main Equipment for TFT Array and Key Suppliers
CELL Process and Related Equipment
OLED Evaporation and Package Packaging Process
Cell Equipment and Key Suppliers
OLED Front and Mid-end Processing (by Equipment) Market Size, 2020E
Investment in Equipment for OLED Production Lines
OLED Back-end Process and Equipment
Core Equipment for OLED Back-end Process
Investment in Equipment for OLED Back-end Process
OLED Panel Process Inspection Procedures
OLED Inspection Equipment
OLED Process Inspection Equipment, Suppliers and Investment
Samsung Display Sales and Operating Profit of 2012-2017
OLED Business of Samsung Display by Application
OLED Capacity Expansion of Samsung, 2016-2018E
Financial Indicators of LG Display, 2014-2017
Revenue of LG Display by Application, 2016-2017
Shipments of LG Display, 2016-2017
LG Display’s Capacity, 2016-2017
LG Display’s OLED Production Lines by Aug 2017
LG Display’s Plants in China
JDI’s Vision
Performance of JDI, FY2012-FY2017
Mid-term Development Plan of JDI, FY2016-FY2019
OLED Development of JDI
Overseas Production Bases of JDI
Revenue, Net Income and Gross Margin of Hon Hai, 2012-2017
Hon Hai/Sharp’s Presence in OLED
Revenue of AUO, 1999-2017
Display Revenue of AUO by Application, 2016-2017
Display Revenue of AUO by Size, 2016-2017
DSH Strategy of BOE
Revenue, Net Income and Gross Margin of BOE, 2012-2017
Operating Revenue and Gross Margin of BOE by Business, 2015-2017
Operating Revenue Structure of BOE by Region, 2015-2017
Evolution of BOE's OLED Business
BOE's OLED Production Lines by the End of Jun 2017
CSOT's LCD Panel Production Lines
Main Products of RiTdisplay
Revenue and Gross Margin of RiTdisplay, 2014-2016
Visionox's OLED Production Lines and Scale by the End of Jul 2017
Revenue and Gross Profit of Truly Group, 2014-2017
Sales Breakdown of Truly Group, 2015-2016
Revenue, Net Income and Gross Margin of Sino Wealth Electronic, 2012-2017
R&D Costs and % of Total Revenue of Sino Wealth Electronic, 2011-2016
OLED Drive Chips of Sino Wealth Electronic
Development Course of O-Film Tech
Global Presence of O-Film Tech
Revenue, Net Income and Gross Margin of O-Film Tech, 2012-2017
Revenue Structure of O-Film Tech, 2015-2017
Development Course of Tianma Micro-electronics
Evolution of Technologies and Production Lines of Tianma Micro-electronics
Revenue, Net Income and Gross Margin of Tianma Micro-electronics, 2012-2017
R&D Costs and % of Total Revenue of Tianma Micro-electronics, 2012-2016
OLED Panel Production Lines and Scale of Tianma Micro-electronics by the End of Jul 2017
Revenue and Shipments of Innolux, 2014-2017
Quarterly Revenue Structure of Innolux by Application, 2015-2017
Quarterly Revenue Structure of Innolux by Size, 2015-2017
Global OLED Market Size and Growth Rate, 2014-2021E
Global OLED Market Size by Application, 2016-2025E
Flexible AMOLED Display
如果这份报告不能满足您的要求,我们还可以为您定制报告,请 留言说明您的详细需求。
|