|
|
|
报告导航:研究报告—
制造业—化工
|
|
2017-2021年全球及中国芳纶行业研究报告 |
 |
字数:4.4万 |
页数:122 |
图表数:155 |
|
中文电子版:11000元 |
中文纸版:5500元 |
中文(电子+纸)版:11500元 |
|
英文电子版:2600美元 |
英文纸版:2800美元 |
英文(电子+纸)版:2900美元 |
|
编号:ZHP065
|
发布日期:2017-09 |
附件:下载 |
 |
|
|
2016年,全球芳纶总产量为11.5万吨,产能利用率为76.0%。随着环保、军事等产业的发展,预计2021年产量可提升至13.8万吨,产能利用率可突破80.0%。
中国是全球主要的芳纶生产国之一,2016年产量约1.4万吨(全球占比12.5%),同比增长8.3%;2011-2016年的年均复合增长率为10.4%。2017-2021年,受国家政策的持续推动,芳纶市场将继续保持10.0%左右的增长速度。但是受技术限制,中国芳纶的产能利用率低于全球平均水平,2016年为62.1%。未来。随着技术的提升,产能利用率将会逐步提高。
从细分产品看,中国生产的主要是技术要求较低的间位芳纶产品。2016年中国间位芳纶产量为1.3万吨,市场占比90.3%,远高于全球平均水平(31.8%)。而对位芳纶产品(尤其是高性能产品)则主要依靠进口,2016年进口依存度为36.3%。
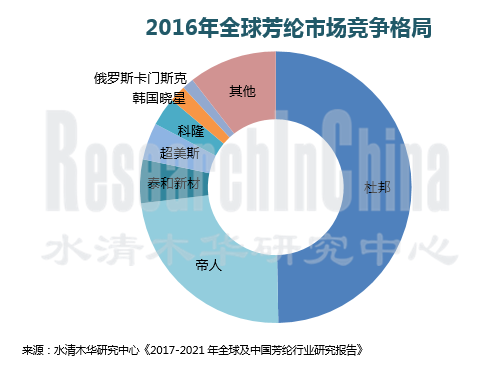
从竞争格局看,全球芳纶市场集中度较高,2016年CR5在85%以上,主要企业包括美国杜邦、日本帝人、韩国科隆、韩国晓星、中国的泰和新材和超美斯等。其中杜邦和帝人在全球芳纶市场占据绝对主导地位,市场份额合计在70%以上。而杜邦、帝人、泰和新材等企业也已具备同时生产间位芳纶和对位芳纶的能力。
由于芳纶具有耐高温、重量轻、生命周期长等优良性能,所以被广泛应用在高温滤料、汽车、防护等领域。
高温滤料:2010-2016年,中国高温滤料市场规模的年均复合增长率在30%以上;2017-2021年,在重点治理环境的污染的大背景下,中国高温滤料市场规模将继续保持20%以上的增长速度。而作为高温滤料主要材料之一的芳纶,市场需求增速也将快速增长,预计2021年高温滤料对芳纶的需求量将从2016年的5800吨增长至9700吨。
汽车:芳纶可用于生产汽车的轮胎帘线,制造刹车片、离合器、整流器、引擎垫片、汽车车身等,可达到大幅减轻汽车车身重量,降低轮胎阻力的效果,已成为近些年应用增长最快的轮胎骨架材料之一。
水清木华研究中心《2017-2021年全球及中国芳纶行业研究报告》着重研究了以下内容:
 芳纶的概述、分类、发展规划、产业链等情况; 芳纶的概述、分类、发展规划、产业链等情况;
全球芳纶(包括间位芳纶、对位芳纶)市场规模、市场结构、竞争格局等情况;
中国芳纶市场供需、市场结构、进出口、竞争格局、存在的问题等情况;
中国间位芳纶市场规模、进出口、竞争格局、存在的问题等情况;
中国对位芳纶市场规模、进出口、竞争格局、存在的问题等情况;
芳纶下游应用领域(高位滤料、轮胎帘子线、航空航天材料、汽车材料、防护材料、芳纶纸、光缆增强材料等)市场现状、芳纶应用现状等情况
国外5家、中国14家芳纶及芳纶复合材料生产企业的经营情况、芳纶相关业务等情况。
Global aramid fiber output totaled 115kt with capacity utilization of 76.0% in 2016. As industries like environmental protection and military develop, the output is expected to rise to 138kt and capacity utilization over 80.0% in 2021.
As one of the world’s major aramid fiber producers, China produced about 14kt or 12.5% of the global total in 2016, up 8.3% from the previous year and representing a CAGR of 10.4% between 2011 and 2016. Stimulated by national policies, the aramid fiber market will maintain a growth rate of around 10.0% from 2017 to 2021. Due to technological limitations, China’s capacity utilization is lower than the global average, standing at 62.1% in 2016. The figure will climb as the technology advances.
China produces mainly meta-aramid fiber with low technological requirements. In 2016, the country produced 13kt of meta-aramid fiber, making up 90.3% of the domestic market, far higher than the global average of 31.8%. By contrast, para-aramid fiber, particularly high-performance products, is largely imported with an import dependency of 36.3% in 2016.
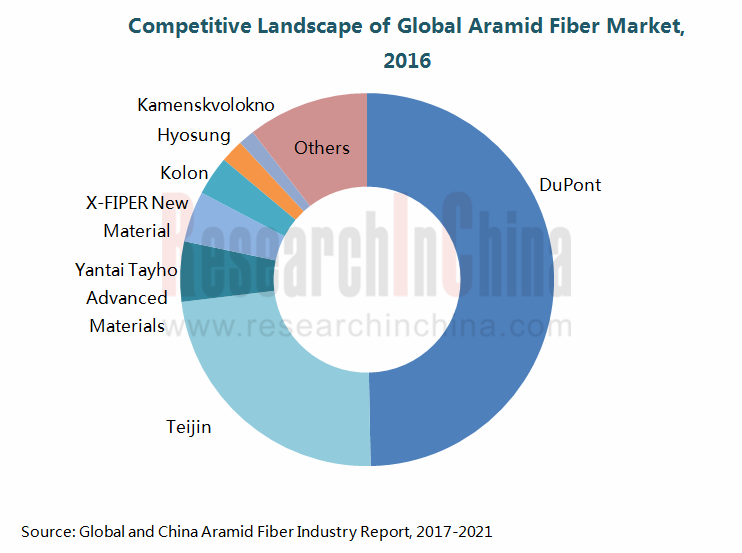
Global aramid fiber market is highly concentrated with CR5 staying above 85% in 2016. Major enterprises include U.S. DuPont, Japanese Teijin, South Korean Kolon and Hyosung, and Chinese Yantai Tayho Advanced Materials and X-FIPER New Material. DuPont and Teijin are dominant in global aramid fiber market, holding a combined over 70% market share. Moreover, DuPont, Teijin and Yantai Tayho Advanced Materials are capable of producing bother meta-aramid fiber and para-aramid fiber.
Because of its excellent performance (high-temperature resistance, lightweight, and long life cycle), aramid fiber is widely used in fields like high-temperature-resistant filter materials, automobile, and protection.
High-temperature-resistant filter materials: the Chinese high-temperature-resistant filter materials market presented a CAGR of over 30% between 2010 and 2016, and will maintain a growth rate of above 20% during 2017-2021 as the Chinese government focuses on tackling environmental pollution. Correspondingly, the demand for aramid fiber, one of main raw materials for high-temperature-resistant filter materials, will also move into high gear, expected to soar from 5.8kt in 2016 to 9.7kt in 2021.
Automobile: aramid fiber can be used to produce tire cord, brake pad, clutch, rectifier, engine shim, and car body. As it can greatly cut the weight of car body and reduce the resistance of tire, aramid fiber has become one of tire skeleton materials that grew at the fastest rate in recent years.
Global and China Aramid Fiber Industry Report, 2017-2021 focuses on the followings:  Aramid fiber (overview, classification, development planning, industry chain, etc.); Aramid fiber (overview, classification, development planning, industry chain, etc.);
Global aramid fiber (meta-aramid fiber and para-aramid fiber) market;
Chinese aramid fiber market (supply & demand, market structure, import & export, competitive landscape, problems, etc.);
Chinese meta-aramid fiber market (market size, import & export, competitive landscape, problems, etc.);
Chinese para-aramid fiber market (market size, import & export, competitive landscape, problems, etc.);
Applications (high-temperature-resistant filter materials, tire cord, aerospace materials, automotive materials, protective materials, aramid paper, and optical cable reinforced materials) of aramid fiber (status quo of market and application);
Five foreign and fourteen Chinese aramid fiber and composites producers (operation, aramid fiber-related business, etc.)
第一章 芳纶概述
1.1 概述
1.2 间位芳纶
1.3 对位芳纶
1.4 发展规划
1.5 产业链
第二章 全球芳纶市场分析
2.1 概述
2.1.1 市场规模
2.1.2 竞争格局
2.2 间位芳纶
2.2.1 市场规模
2.2.2 市场结构
2.2.3 竞争格局
2.3 对位芳纶
2.3.1 市场规模
2.3.2 市场结构
2.3.3 竞争格局
第三章 中国芳纶市场分析
3.1 市场供需
3.1.1 供给
3.1.2 需求
3.2 市场结构
3.3 进出口
3.4 竞争格局
3.5 存在的问题
第四章 中国间位芳纶市场分析
4.1 市场规模
4.1.1 供给
4.1.2 需求
4.2 进出口
4.2.1 总量
4.2.2 价格
4.2.3 结构
4.3 竞争格局
4.4 存在的问题
第五章 中国对位芳纶市场分析
5.1 市场供需
5.1.1 供给
5.1.2 需求
5.2 进出口
5.2.1 总量
5.2.2 价格
5.2.3 结构
5.3 竞争格局
5.4 价格
5.5 存在的问题
第六章 芳纶下游应用领域
6.1 高温过滤材料
6.1.1 芳纶在高温过滤材料领域的应用
6.1.2 市场概述
6.2 轮胎帘子线
6.2.1 芳纶在轮胎帘子线领域的应用
6.2.2 市场现状
6.3 航空航天材料
6.3.1 芳纶在航空航天材料领域的应用
6.3.2 市场概述
6.4 汽车材料
6.4.1 芳纶在汽车材料领域的应用
6.4.2 市场概述
6.5 防护领域
6.6 芳纶纸
6.7 光缆增强材料
6.8 运动器材材料
6.9 船舶材料
6.10 其他
第七章 国外主要生产企业
7.1 美国杜邦(DuPont)
7.1.1 公司简介
7.1.2 经营情况
7.1.3 防护科技部门经营情况
7.1.4 芳纶业务
7.1.5 在华业务
7.2 日本帝人(Teijin)
7.2.1 公司简介
7.2.2 经营情况
7.2.3 先进纤维及复合材料部门经营情况
7.2.4 芳纶业务
7.2.5 在华业务
7.3 韩国科隆(KOLON)
7.3.1 公司简介
7.3.2 经营情况
7.3.3 工业材料部门经营情况
7.3.4 芳纶业务
7.4 其他
7.4.1 Huvis
7.4.2 韩国晓星
第八章 中国主要芳纶生产企业
8.1 泰和新材
8.1.1 公司简介
8.1.2 经营状况
8.1.3 研发
8.1.4 芳纶业务
8.1.5 芳纶复合材料业务
8.1.6 发展战略
8.2 神马股份
8.2.1 公司简介
8.2.2 经营状况
8.2.3 芳纶业务
8.3 新纶科技
8.3.1 公司简介
8.3.2 经营状况
8.3.3 芳纶业务
8.4 仪征化纤
8.4.1 公司简介
8.4.2 芳纶业务
8.5 超美斯
8.5.1 公司简介
8.5.2 芳纶业务
8.6 广东彩艳
8.6.1 公司简介
8.6.2 芳纶业务
8.7 苏州兆达
8.7.1 公司简介
8.7.2 芳纶业务
8.8 中蓝晨光
8.8.1 公司简介
8.8.2 芳纶业务
8.9 河北硅谷
8.9.1 公司简介
8.9.2 芳纶业务
第九章 中国主要芳纶复合材料生产企业
9.1 三维丝
9.1.1 公司简介
9.1.2 经营状况
9.1.3 研发
9.1.4 芳纶复合材料业务
9.2 宜昌和达利
9.2.1 公司简介
9.2.2 芳纶复合材料业务
9.3 宝通科技
9.3.1 公司简介
9.3.2 经营状况
9.3.3 研发
9.3.4 芳纶复合材料业务
9.4 齐峰新材
9.4.1 公司简介
9.4.2 经营状况
9.4.3 芳纶复合材料业务
9.5 时代新材
9.5.1 公司简介
9.5.2 经营情况
9.5.3 芳纶复合材料业务
1 Overview of Aramid Fiber
1.1 Overview
1.2 Meta-aramid Fiber
1.3 Para-aramid Fiber
1.4 Development Planning
1.5 Industry Chain
2 Global Aramid Fiber Market
2.1 Overview
2.1.1 Market Size
2.1.2 Competitive Landscape
2.2 Meta-aramid Fiber
2.2.1 Market Size
2.2.2 Market Structure
2.2.3 Competitive Landscape
2.3 Para-aramid Fiber
2.3.1 Market Size
2.3.2 Market Structure
2.3.3 Competitive Landscape
3 Chinese Aramid Fiber Market
3.1 Supply & Demand
3.1.1 Supply
3.1.2 Demand
3.2 Market Structure
3.3 Import & Export
3.4 Competitive Landscape
3.5 Problems Existed
4 Chinese Meta-aramid Fiber Market
4.1 Supply & Demand
4.1.1 Supply
4.1.2 Demand
4.2 Import & Export
4.2.1 Total Volume
4.2.2 Price
4.2.3 Structure
4.3 Competitive Landscape
4.4 Problems Existed
5 Chinese Para-aramid Fiber Market
5.1 Supply & Demand
5.1.1 Supply
5.1.2 Demand
5.2 Import & Export
5.2.1 Total Volume
5.2.2 Price
5.2.3 Structure
5.3 Competitive Landscape
5.4 Price
5.5 Problems Existed
6 Downstream Applications of Aramid Fiber
6.1 High Temperature Resistant Filter Materials
6.1.1 Application of Aramid Fiber in the Field of High Temperature Resistant Filter Materials
6.1.2 Market Overview
6.2 Tire Cord
6.2.1 Application of Aramid Fiber in the Field of Tire Cord
6.2.2 Market Status
6.3 Aerospace Materials
6.3.1 Application of Aramid Fiber in the Field of Aerospace Materials
6.3.2 Market Overview
6.4 Automotive Materials
6.4.1 Application of Aramid Fiber in the Field of Automotive Materials
6.4.2 Market Overview
6.5 Protection Field
6.6 Aramid Paper
6.7 Optical Cable Reinforced Materials
6.8 Sports Equipment & Materials
6.9 Marine Materials
6.10 Others
7 Global Major Aramid Fiber Producers
7.1 DuPont
7.1.1 Profile
7.1.2 Operation
7.1.3 Operation of Protection Technologies Segment
7.1.4 Aramid Fiber Business
7.1.5 Business in China
7.2 Teijin
7.2.1 Profile
7.2.2 Operation
7.2.3 Operation of Advanced Fibers & Composites Segment
7.2.4 Aramid Fiber Business
7.2.5 Business in China
7.3 Kolon
7.3.1 Profile
7.3.2 Operation
7.3.3 Operation of Industrial Materials Segment
7.3.4 Aramid Fiber Business
7.4 Others
7.4.1 Huvis
7.4.2 Hyosung
8 Chinese Major Aramid Fiber Producers
8.1 Yantai Tayho Advanced Materials Co., Ltd.
8.1.1 Profile
8.1.2 Operation
8.1.3 R & D
8.1.4 Aramid Fiber Business
8.1.5 Aramid Fiber Composites Business
8.1.6 Development Strategy
8.2 Shenma Industry Co., Ltd.
8.2.1 Profile
8.2.2 Operation
8.2.3 Aramid Fiber Business
8.3 Shenzhen Selen Science & Technology Co., Ltd.
8.3.1 Profile
8.3.2 Operation
8.3.3 Aramid Fiber Business
8.4 Sinopec Yizheng Chemical Fibre Company Limited (YCF)
8.4.1 Profile
8.4.2 Aramid Fiber Business
8.5 X-FIPER New Material Co., Ltd
8.5.1 Profile
8.5.2 Aramid Fiber Business
8.6 Guangdong Charming Co., Ltd.
8.6.1 Profile
8.6.2 Aramid Fiber Business
8.7 Suzhou Zhaoda Specially Fiber Technical Co., Ltd.
8.7.1 Profile
8.7.2 Aramid Fiber Business
8.8 China BlueStar Chengrand Research & Design Institute of Chemical Industry
8.8.1 Profile
8.8.2 Aramid Fiber Business
8.9 Hebei Silicon Valley Chemical Co., Ltd.
8.9.1 Profile
8.9.2 Aramid Fiber Business
9 Chinese Major Aramid Fiber Composite Producers
9.1 Xiamen Savings Environmental Co., Ltd.
9.1.1 Profile
9.1.2 Operation
9.1.3 R & D
9.1.4 Aramid Fiber Composites Business
9.2 Yichang Hedali Composite Materials Co., Ltd.
9.2.1 Profile
9.2.2 Aramid Fiber Composites Business
9.3 Wuxi Boton Technology Co., Ltd.
9.3.1 Profile
9.3.2 Operation
9.3.3 R & D
9.3.4 Aramid Fiber Composites Business
9.4 Qifeng New Material Co., Ltd.
9.4.1 Profile
9.4.2 Operation
9.4.3 Aramid Fiber Composites Business
9.5 Zhuzhou Times New Material Technology Co., Ltd.
9.5.1 Profile
9.5.2 Operation
9.5.3 Aramid Fiber Composites Business
表:芳纶产品类别
表:芳纶III与芳纶1414性能对比
表:间位芳纶合成方法
表:间位芳纶下游应用领域
表:对位芳纶纤维与其他高强度纤维的性能比较
表:对位芳纶下游应用领域
表:2015-2020年中国三大高性能纤维需求及增速
图:芳纶产业链
图:2014-2021年全球芳纶产能
图:2016年全球芳纶(分产品)产能构成
图:2016-2021年全球芳纶产量
图:2016年全球芳纶(分地区)产量构成
图:2016年全球芳纶市场竞争格局
图:2014-2021年全球间位芳纶产能
表:2016年全球间位芳纶生产企业产能及其工厂分布
图:2016-2021年年全球间位芳纶产量
图:2016年全球间位芳纶(分领域)需求结构
图:2016年全球间位芳纶市场竞争格局
图:2014-2021年全球对位芳纶(分产品)产能
表:全球主要对位芳纶生产企业生产基地分布
图:2016-2021年全球对位芳纶产量
图:2016-2021年全球对位芳纶消费量
图:2016年全球对位芳纶(分领域)需求结构
图:2016年全球对位芳纶市场竞争格局
图:2014-2021年中国芳纶产能
图:2016年中国芳纶(分产品)产能构成
表:2017年中国主要芳纶生产商及相关产能
图:2011-2021年中国芳纶产量
图:2011-2021年中国芳纶表观消费量
图:2016年中国芳纶(分产品)表观消费量构成
图:2016年中国芳纶(分领域)需求结构
图:2011-2017年中国芳纶进出口量
图:2011-2017年中国芳纶(分产品)进口量构成
图:2011-2017年中国芳纶(分产品)出口量构成
图:2016年中国芳纶市场竞争格局
图:2014-2021年中国间位芳纶产能
图:2011-2021年中国间位芳纶产量
图:2011-2021年中国间位芳纶表观消费量
图:2016年中国间位芳纶(分领域)需求结构
图:2011-2017年中国间位芳纶进出口量
图:2011-2017年中国间位芳纶进出口平均价格
图:2015-2016中国间位芳纶(分国家)进口量构成
图:2015-2016年中国间位芳纶(分国家)出口量构成
图:2015-2016年中国间位芳纶(分省市)进口量构成
图:2015-2016年中国间位芳纶(按出口量)出口省市分布
图:2017年中国间位芳纶市场竞争格局
图:2014-2021年中国对位芳纶产能
图:2011-2021年中国对位芳纶产量
图:2011-2021年中国对位芳纶表观消费量
图:2016年中国对位芳纶(分领域)需求占比
图:2011-2017年中国对位芳纶进出口量
图:2011-2017年中国对位芳纶进出口平均价格
图:2015-2016年中国对位芳纶(按国家)进口量构成
图:2015-2016年中国对位芳纶(按国家/地区)出口量构成
图:2015-2016年中国对位芳纶(按省市)进口量构成
图:2015-2016年中国对位芳纶(按省市)出口量构成
图:2016年中国芳纶1414主要生产厂家
图:2016年中国对位芳纶市场竞争格局
表:中国主要芳纶复合材料生产企业
图:2014-2021年中国高温过滤材料领域芳纶需求量
表:主要高温过滤材料性能对比
图:2010-2021年中国高温滤料市场规模
图:2016年中国高温滤料材料应用占比
表:芳纶在轮胎帘子线领域的主要应用案例
图:2013-2020年全球轮胎帘子线市场规模
图:2010-2021年中国轮胎产量
图:2010-2021年中国轮胎制造业主营业务收入及增长率
表:1994-2016全球通航飞机销售额
图:2010-2021全球通航飞机交付量及增速
图:2010-2017年全球通航飞机(分产品)交付量构成
表:2016年全球通航飞机主要生产地及产量
表:2016年全球通航飞机主要消费地区
图:2011-2021年全球旋翼飞机交付量及增速
图:2010-2017年全球旋翼飞机(分产品)交付量构成
图:2005-2017年全球乘用车销量
图:2005-2017年全球商用车销量
图:2016年全球主要国家汽车销量
图:2014-2016年中国汽车销量变化
图:2014-2016年中国乘用车(分国别)销量构成
图:2015-2016年中国汽车市场竞争格局
图:2016-2021年全球防护服市场规模
表:间位芳纶在防护领域的应用
图:2014-2021年中国防护材料领域芳纶需求量
表:芳纶纸的分类及应用
图:2014-2021年中国光缆增强材料领域芳纶需求量
图:2010-2021年中国光纤、光缆制造业主营业务收入及增长率
图:2010-2021年中国训练健身器材制造行业总产值及增速
图:2006-2017年中国训练健身器材制造行业产销率
图:2010-2017年全球造船三大指标
图:2010-2017年中国造船三大指标
图:美国杜邦全球研发布局
图:2011-2017年美国杜邦净销售额和净利润
图:2013-2017年美国杜邦(分部门)销售收入构成
图:2014-2017年美国杜邦(分地区)销售收入构成
图:2012-2017年杜邦防护科技部门销售收入及营业利润
图:2014-2015年杜邦防护科技部门(分产品)销售收入构成
图:2014-2015年杜邦防护科技部门(按下游市场)销售收入占比
图:2014-2015年杜邦防护科技部门(分地区)销售收入占比
表:2016年杜邦芳纶纤维产能情况
图:日本帝人全球研发布局
图:2011-2017财年帝人净销售额和营业利润
图:2013-2016财年 日本帝人(分部门)销售收入构成
图:2013-2016财年日本帝人(分地区)销售收入构成
图:2015-2017年日本帝人业务发展规划
图:日本帝人先进纤维及复合材料生产基地分布
图:2011-2017财年日本帝人先进纤维及复合材料部门销售收入和营业利润
图:帝人芳纶业务概述
表:2016年帝人芳纶纤维产能情况
表:日本帝人芳纶产品及应用
图:日本帝人在华布局
图:韩国科隆全球布局
图:2011-2017年韩国科隆销售收入和净利润
图:2013-2017韩国科隆(分部门)销售收入占比
表:韩国科隆工业材料部门主要业务及产品
图:2011-2017年韩国科隆工业材料部门销售收入及营业利润
表:韩国科隆芳纶业务发展历程
图:2014-2016年Huvis经营情况
图:2012/2016年Huvis业务收入构成
图:韩国晓星全球布局
表:2015-2016年韩国晓星经营情况
表:2016年泰和新材主营产品产能及应用
图:2011-2017年泰和新材营业收入及净利润
图:2013-2017年泰和新材(分产品)营收构成
图:2013-2017年泰和新材(分地区)营收构成
图:2011-2017年泰和新材主营产品毛利率
图:2011-2017年泰和新材研发支出及占营业收入比例
表:泰和新材主营产品产能发展历程
表:2012-2016年泰和新材主营产品产销量
表:泰和新材芳纶复合材料相关子公司介绍
图:2011-2017年民士达营业收入和净利润
图:2011-2017年神马股份营业收入及净利润
图:2013-2016年神马股份(分产品)营收构成
图:2013-2016年神马股份(分地区)营收构成
图:2013-2016年神马股份(分产品)毛利率
图:2011-2017年新纶科技营业收入及净利润
表:仪征化纤芳纶产品及其应用领域
表:超美斯芳纶纤维主要技术参数
表:广东彩艳芳纶III纤维主要技术参数
表:苏州兆达对位芳纶发展历程
表:苏州兆达芳纶纤维品种及应用
表:中蓝晨光芳纶纤维品种及应用
图:2011-2017年三维丝营业收入及净利润
图:2014-2017年三维丝(分产品)营收构成
图:2012-2016年三维丝(分地区)营收构成
图:2014-2017年三维丝(分产品)毛利率
图:2013-2017年三维丝研发支出及占营业收入比例
图:2012-2016年三维丝主营产品产销量
图:2011-2017年宝通科技营业收入及净利润
图:2015-2017年宝通科技(分产品)营收构成
图:2012-2016年宝通科技(分地区)营收构成
图:2012-2016年宝通科技研发支出及占营业收入比例
图:2011-2017年齐峰新材营业收入及净利润
图:2013-2017年欧木纸业营业收入和净利润
图:2014-2017年时代新材营业收入和净利润
图:2016年时代新材(分行业)营业收入构成
Category of Aramid Fiber Products
Performance Comparison between Aramid Fiber III and Aramid Fiber 1414
Synthetic Methods of Meta-aramid Fiber
Downstream Applications of Meta-aramid Fiber
Performance Comparison between Para-aramid Fiber and Other High-strength Fibers
Downstream Applications of Para-aramid Fiber
China’s Demand for Three Main High-performance Fibers and Growth Rate, 2015-2020E
Aramid Fiber Industry Chain
Global Aramid Fiber Capacity, 2014-2021E
Global Aramid Fiber Capacity Structure (by Product), 2016
Global Aramid Fiber Output,2016-2021E
Global Aramid Fiber Output Structure by Region, 2016
Competitive Landscape of Global Aramid Fiber Market, 2016
Global Meta-aramid Fiber Capacity, 2014-2021E
Capacities and Factory Distribution of Global Meta-aramid Fiber Production Enterprises, 2016
Global Meta-aramid Fiber Output, 2016-2021E
Global Meta-aramid Fiber Demand Structure (by Field), 2016
Competitive Landscape of Global Meta-aramid Fiber Market, 2016
Global Para-aramid Fiber Capacity (by Product), 2014-2021E
Production Base Distribution of Global Major Para-aramid Fiber Production Enterprises
Global Para-aramid Fiber Output, 2016-2021E
Global Para-aramid Fiber Consumption, 2016-2021E
Global Para-aramid Fiber Demand Structure (by Field), 2016
Competitive Landscape of Global Para-aramid Fiber Market, 2016
China’s Aramid Fiber Capacity, 2014-2021E
China’s Aramid Fiber Capacity Structure (by Product), 2016
Chinese Major Aramid Fiber Producers and Related Capacities, 2017
China’s Aramid Fiber Output, 2011-2021E
China’s Aramid Fiber Apparent Consumption, 2011-2021E
China’s Aramid Fiber Apparent Consumption Structure (by Product), 2016
China’s Aramid Fiber Demand Structure (by Field), 2016
China’s Aramid Fiber Import & Export Volume, 2011-2017
China’s Aramid Fiber Import Volume Structure (by Product), 2011-2017
China’s Aramid Fiber Export Volume Structure (by Product), 2011-2017
Competitive Landscape of Chinese Aramid Fiber Market, 2016
China’s Meta-aramid Fiber Capacity, 2014-2021E
China’s Meta-aramid Fiber Output, 2011-2021E
China’s Meta-aramid Fiber Apparent Consumption, 2011-2021E
China’s Meta-aramid Fiber Demand Structure (by Field), 2016
China’s Meta-aramid Fiber Import & Export Volume, 2011-2017
China’s Meta-aramid Fiber Import & Export Price, 2011-2017
China’s Meta-aramid Fiber Import Volume Structure (by Country), 2015-2016
China’s Meta-aramid Fiber Export Volume Structure (by Country), 2015-2016
China’s Meta-aramid Fiber Import Volume Structure (by Province/City), 2015-2016
China’s Meta-aramid Fiber Export Volume Structure (by Province/City), 2015-2016
Competitive Landscape of Chinese Meta-aramid Fiber Market, 2017
China’s Para-aramid Fiber Capacity, 2014-2021E
China’s Para-aramid Fiber Output, 2011-2021E
China’s Para-aramid Fiber Apparent Consumption, 2011-2021E
China’s Para-aramid Fiber Demand Structure (by Field), 2016
China’s Para-aramid Fiber Import & Export Volume, 2011-2017
China’s Para-aramid Fiber Import & Export Price, 2011-2017
China’s Para-aramid Fiber Import Volume Structure (by Country), 2015-2016
China’s Para-aramid Fiber Export Volume Structure (by Country/Region), 2015-2016
China’s Para-aramid Fiber Import Volume Structure (by Province/City), 2015-2016
China’s Para-aramid Fiber Export Volume Structure (by Province/City), 2015-2016
Key Manufacturers of Para-aramid in China, 2016
Competitive Landscape of Chinese Para-aramid Fiber Market, 2016
Chinese Major Aramid Fiber Composite Production Enterprises
China’s Demand for Aramid Fiber in the Field of High Temperature Resistant Filter Materials, 2014-2021E
Performance Comparison between Main High Temperature Resistant Filter Materials
Chinese High Temperature Resistant Filter Materials Market Size, 2010-2021E
Chinese High Temperature Resistant Filter Materials Application Structure, 2016
Main Application Cases of Aramid Fiber in the Field of Tire Cord
Global Tire Cord Market Size, 2013-2020E
China Tire Output, 2010-2021E
Operating Revenue and Growth Rate of Tire Manufacturing in China, 2010-2021E
Global Navigable Aircraft Sales, 1994-2016
Global Navigable Aircraft Deliveries and Growth Rate, 2010-2021E
Global Navigable Aircraft Deliveries Structure (by Product), 2010-2017
Global Major Navigable Aircraft Producing Places and Their Output, 2016
Global Major Navigable Aircraft Consuming Places, 2016
Global Rotorcraft Deliveries and Growth Rate, 2010-2021E
Global Rotorcraft Deliveries Structure (by Product), 2010-2017
Global Passenger Vehicle Sales Volume, 2005-2017
Global Commercial Vehicle Sales Volume, 2005-2017
Automobile Sales in Major Countries Worldwide, 2016
Automobile Sales in China, 2014-2016
Sales Structure of Passenger Cars (by Country) in China, 2014-2016
Competitive Landscape of Chinese Automobile Market,2015-2016
Market Size of Global Protective Suit, 2016-2021E
Application of Meta-aramid Fiber in the Field of Protection
China’s Demand for Aramid Fiber in the Field of Protective Materials, 2014-2021E
Classification and Application of Aramid Paper
China’s Demand for Aramid Fiber in the Field of Optical Cable Reinforced Materials, 2014-2021E
Operating Revenue and Growth Rate of Optical Fiber & Cable Manufacturing in China, 2010-2021E
Total Output Value and Growth Rate of Fitness & Training Equipment Manufacturing in China, 2010-2021E
Sales-Output Ratio of Fitness & Training Equipment Manufacturing in China, 2006-2017
Three Major Indicators of Global Shipbuilding Industry, 2010-2017
Three Major Indicators of China Shipbuilding Industry, 2010-2017
DuPont’s Global R&D Layout
DuPont’s Net Sales and Net Income, 2011-2017
DuPont’s Sales Structure (by Segment), 2013-2017
DuPont’s Sales (by Region), 2014-2017
Sales and Operating Income of DuPont’s Protection Technologies Segment, 2012-2017
Sales Structure of DuPont’s Protection Technologies Segment (by Product), 2014-2015
Sales Structure of DuPont’s Protection Technologies Segment (by Downstream Market), 2014-2015
Sales Structure of DuPont’s Protection Technologies Segment (by Region), 2014-2015
DuPont’s Aramid Fiber Capacities, 2016
Teijin’s Global R&D Layout
Teijin’s Net Sales and Operating Income, FY2011-FY2017
Teijin’s Sales Structure (by Segment), FY2013-FY2016
Teijin’s Sales Structure (by Region), FY2013-FY2016
Teijin’s Business Development Plan, 2015-2017
Production Base Distribution of Teijin’s Advanced Fibers & Composites
Sales and Operating Income of Teijin’s Advanced Fibers & Composites Segment, FY2011-FY2017
Teijin’s Business Overview
Teijin’s Aramid Fiber Capacities, 2016
Teijin’s Aramid Fiber Products and Applications
Teijin’s Layout in China
Kolon’s Global Distribution
Kolon’s Sales and Net Income, 2011-2017
Kolon’s Sales Structure (by Segment), 2013-2017
Main Business and Products of Kolon’s Industrial Materials Segment
Sales and Operating Income of Kolon’s Industrial Materials Segment, 2011-2017
Development History of Kolon’s Aramid Fiber Business
Huvis’ Operation, 2014-2016
Huvis’ Sales Structure, 2012/2016
Hyosung’s Global Distribution
Hyosung’s Operation, 2015-2016
Capacities and Applications of Yantai Tayho Advanced Materials’ Main Products, 2016
Revenue and Net Income of Yantai Tayho Advanced Materials, 2011-2017
Revenue Structure of Yantai Tayho Advanced Materials (by Product), 2013-2017
Revenue Structure of Yantai Tayho Advanced Materials (by Region), 2013-2017
Gross Margin of Yantai Tayho Advanced Materials’ Main Products, 2011-2017
Yantai Tayho Advanced Materials’ Costs and % of Total Revenue, 2011-2017
Capacity Development History of Yantai Tayho Advanced Materials’ Main Products
Output and Sales Volume of Yantai Tayho Advanced Materials’ Main Products, 2012-2016
Aramid Fiber Composite Related Subsidiaries of Yantai Tayho Advanced Materials
Revenue and Net Income of Yantai Metastar Special Paper, 2011-2017
Revenue and Net Income of Shenma Industry, 2011-2017
Revenue Structure of Shenma Industry (by Product), 2013-2016
Revenue Structure of Shenma Industry (by Region), 2013-2016
Gross Margin of Shenma Industry (by Product), 2013-2016
Revenue and Net Income of Shenzhen Selen Science & Technology, 2011-2017
Aramid Fiber Products and Applications of Sinopec Yizheng Chemical Fibre
Main Technical Parameters of X-FIPER Aramid Fiber of SRO Aramid (Jiangsu)
Main Technical Parameters of Aramid Fiber III of Guangdong Charming
Para-aramid Fiber Development History of Suzhou Zhaoda Specially Fiber Technical
Aramid Fiber Varieties and Applications of Suzhou Zhaoda Specially Fiber Technical
Aramid Fiber Varieties and Applications of China BlueStar Chengrand Research & Design Institute of Chemical Industry
Revenue and Net Income of Xiamen Savings Environmental, 2011-2017
Revenue Structure of Xiamen Savings Environmental (by Product), 2014-2017
Revenue Structure of Xiamen Savings Environmental (by Region), 2012-2016
Gross Margin of Xiamen Savings Environmental (by Product), 2014-2017
Xiamen Savings Environmental’s R&D Costs and % of Total Revenue, 2013-2017
Output and Sales Volume of Xiamen Savings Environmental’s Main Products, 2012-2015
Revenue and Net Income of Wuxi Boton Technology, 2011-2017
Revenue Structure of Wuxi Boton Technology (by Product), 2015-2017
Revenue Structure of Wuxi Boton Technology (by Region), 2012-2016
Wuxi Boton Technology’s R&D Costs and % of Total Revenue, 2012-2016
Revenue and Net Income of Qifeng New Material, 2011-2017
Revenue and Net Income of Zibo Ou Mu Special Paper Industry, 2013-2017
Revenue and Net Income of Zhuzhou Times New Material Technology, 2014-2017
Revenue Structure of Zhuzhou Times New Material Technology by Industry, 2016
如果这份报告不能满足您的要求,我们还可以为您定制报告,请 留言说明您的详细需求。
|