|
|
|
报告导航:研究报告—
制造业—材料
|
|
2017-2021年全球及中国光纤预制棒行业研究报告 |
 |
字数:3.2万 |
页数:144 |
图表数:184 |
|
中文电子版:12000元 |
中文纸版:6000元 |
中文(电子+纸)版:12500元 |
|
英文电子版:2700美元 |
英文纸版:2900美元 |
英文(电子+纸)版:3000美元 |
|
编号:CYH067
|
发布日期:2017-09 |
附件:下载 |
 |
|
|
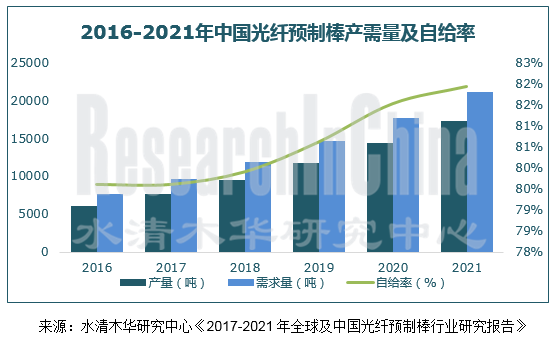
光纤预制棒(简称“光棒”)是光纤产品核心原材料,占光纤利润的70%左右。2016年,全球光纤预制棒产量和需求量分别达1.49万吨和1.38万吨,分别同比增长16.0%和10.2%。在光纤光缆市场快速发展带动下,至2021年其产量和需求量分别有望达3.02万吨和2.56万吨。
中国是全球最大的光棒生产国和需求国,2016年其产量占全球总产量的41.0%至6100吨,需求量占全球总需求量的55.4%至7668吨,供需缺口达1568吨,中国光棒产品仍处于供不应求的状态。但随着中国厂商光棒技术不断提升以及产线陆续投产,其供需缺口正逐渐收窄,2010年中国光棒供需缺口68.4%,而2016年仅为20.4%,至2021年有望降至18%左右。
全球光纤预制棒是一个高度集中的市场,全球主要光纤预制棒生产厂商约为20 家,包括康宁、住友电工、信越化学、长飞公司、亨通光电等。其中,长飞公司全球市场份额(按产量)第一,2016年为13.4%;其次为美国康宁,约12.9%。
在国家持续推进“三网融合”、“宽带中国”、“5G建设”以及“互联网+”,多项政策引导下,中国光纤光缆市场得到前所未有的发展机遇,带动光棒市场快速发展,中国光棒厂商纷纷加大光棒扩能。其中,长飞公司2016年3月开工建设长飞潜江科技园项目,一期于2017年3月投产,二三期将陆续开建,待项目全部达产后将新增光纤预制棒1500 吨/年和光纤2000万芯公里的生产能力。同时长飞公司还启动PCVD11 期扩产项目以增加光纤预制棒产能;亨通光电2017年公司重组光棒业务,投资设立全资子公司“亨通光导”,规划新增光棒产能1500吨/年。
另外,2017年8月,商务部公告对光纤预制棒反倾销期终进行为期1年的复审调查,期间对原产于日本和美国的进口光纤预制棒继续按照商务部2015年第25号公告公布的征税范围和税率征收反倾销税。受此影响,以及中国光纤预制棒供不应求现状,2015年以来,中国光纤预制棒均价有所上涨,2016年达到1011元/公斤,2017年价格将进一步上升,均价有望至1100元/公斤。
水清木华研究中心《2017-2021年全球及中国光纤预制棒行业研究报告》着重研究了以下内容:
 全球光纤预制棒市场供需、地区分布、价格、竞争格局及发展趋势; 全球光纤预制棒市场供需、地区分布、价格、竞争格局及发展趋势;
中国光纤预制棒政策环境、市场供需、进出口、竞争格局及价格及发展趋势;
全球及中国光纤光缆市场发展情况;
全球及中国13家光纤预制棒企业经营情况及光纤预制棒业务发展情况等。
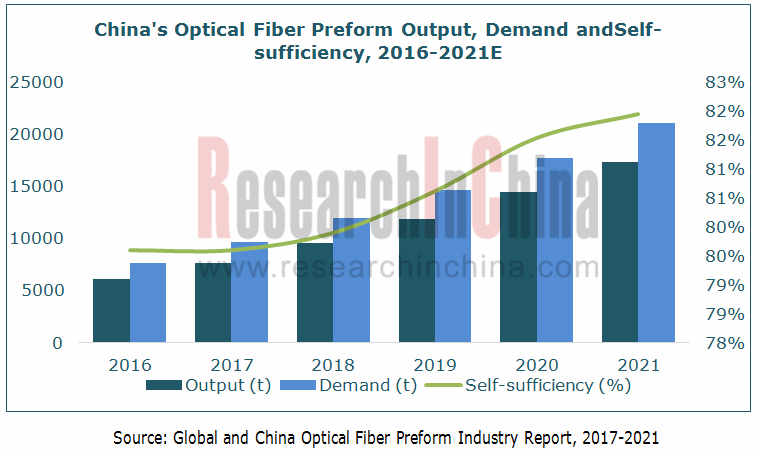
Optical fiber preform, a core raw material of optical fiber products, accounts for around 70% of the profit of optical fiber. Global optical fiber preform output and demand were 14.9kt and 13.8kt in 2016, up 16.0% and 10.2% from a year ago, respectively, and are expected to reach 30.2kt and 25.6kt in 2021 separately, driven by rapid development of the optical fiber and cable market.
China, the world’s largest producer of and source of demand for optical fiber preform, produced 6.1kt and demanded 7.668kt in 2016, 41.0% and 55.4% of the world’s total, respectively, indicating a supply-demand gap of 1.568kt, still in a state of short supply. However, as Chinese enterprises improve optical fiber preform technology and put production lines into operation, the gap has narrowed gradually, from 68.4% in 2010 to only 20.4% in 2016 and estimated 18% or so in 2021.
There are about 20 major optical fiber preform producers worldwide in this highly-concentrated market, including Corning, Sumitomo Electric Industries, Shin-Etsu Chemical, Yangtze Optical Fibre and Cable, and Hengtong Optic-electric. Yangtze Optical Fibre and Cable ranks first by global market share (based on output), 13.4% in 2016, followed by Corning (about 12.9%).
The country’s efforts to promote “tri-networks integration”, “Broadband China”, “5G Construction” and “Internet Plus” have brought unprecedented opportunities for the Chinese optical fiber and cable market, driven rapid development of the optical fiber preform market, and stimulated Chinese optical fiber preform producers to expand capacity. Yangtze Optical Fibre and Cable began construction of YOFC Qianjiang Science Park in Mar 2016, put its Phase I into production in Mar 2017, and will build Phase II and Phase III. After reaching designed capacity, the project will deliver capacity of 1.5kt/a optical fiber preform and 20 million core•km /a. Meanwhile, the company also initiated PCVD11 capacity expansion project with the aim of lifting optical fiber preform capacity. Hengtong Optic-electric reorganized its optical fiber preform business and established a wholly-owned subsidiary- Hengtong Photoconductive New Materials in 2017, planning to add 1.5kt/a optical fiber preform.
In addition, the Ministry of Commerce of the People’s Republic of China announced in Aug 2017 that it decided to conduct a one-year expiry review investigation into the anti-dumping measures imposed on the imports of optical fiber perform originated in Japan and the United States, and during the expiry review investigation of the anti-dumping measures, the imports of optical fiber perform originated in Japan and the United States will still be subject to anti-dumping duties at the scope and rate released in the Ministry of Commerce Announcement No.25 of 2015. Affected by this, coupled with short supply of the product, optical fiber preform prices have risen since 2015, hitting RMB1,011/kg in 2016 and expected to go up further to an average of RMB1,100/kg in 2017.
Global and China Optical Fiber Preform Industry Report, 2017-2021 highlights the followings:
 Global optical fiber preform market (supply & demand, regional distribution, price, competitive landscape, development trends, etc.); Global optical fiber preform market (supply & demand, regional distribution, price, competitive landscape, development trends, etc.);
Chinese optical fiber preform market (policies, supply & demand, competitive landscape, prices, development trends, etc.);
Global and Chinese optical fiber and cable market;
13 global and Chinese optical fiber preform enterprises (operation, optical fiber preform business, etc.).
第一章 光纤预制棒概述
1.1 定义
1.2 生产工艺
1.3 产业链
1.3.1 上游
1.3.2 下游
第二章 全球光纤预制棒行业发展概况
2.1 发展现状
2.2 供需分析
2.2.1 供给
2.2.2 需求
2.3 地区结构
2.3.1 美国
2.3.2 日本
2.3.3 欧洲
2.4 价格走势
2.5 竞争格局
第三章 中国光纤预制棒行业发展概况
3.1 政策环境
3.2 发展历程
3.3 供需分析
3.3.1 供给分析
3.3.2 需求分析
3.4 进出口
3.4.1 进口
3.4.2 出口
3.5 价格走势
3.5.1 原材料价格
3.5.2 光纤预制棒价格
3.6 竞争格局
第四章 全球及中国光纤光缆市场发展概况
4.1 全球
4.1.1 市场发展
4.1.2 地区结构
4.1.3 价格
4.1.4 企业
4.2 中国
4.2.1 市场发展
4.2.2 价格
4.2.3 竞争格局
第五章 全球光纤预制棒主要生产企业
5.1 康宁公司
5.1.1 企业简介
5.1.2 经营情况
5.1.3 光纤预制棒业务
5.1.4 在华发展
5.1.5 成都康宁光缆有限公司
5.2 住友电工
5.2.1 企业简介
5.2.2 经营情况
5.2.3 光纤预制棒业务
5.2.4 在华发展
5.2.5 成都中住光纤
5.3 信越化工
5.3.1 企业简介
5.3.2 经营情况
5.3.3 光纤预制棒业务
5.3.4 在华发展
5.4 日本藤仓
5.4.1 企业简介
5.4.2 经营情况
5.4.3 光纤预制棒业务
5.4.4 在华发展
5.4.5 藤仓烽火光电
5.5 普瑞斯曼
5.5.1 公司简介
5.5.2 经营情况
5.5.3 光纤预制棒业务
5.5.4 在华发展
5.6 古河电工
5.6.1 公司简介
5.6.2 经营情况
5.6.3 光纤预制棒业务
5.6.4 在华发展
5.7 特恩驰
5.7.1 企业简介
5.7.2 经营情况
5.7.3 光纤预制棒业务
5.7.4 在华发展
5.7.5 南京特恩驰
第六章 中国光纤预制棒主要生产企业
6.1 长飞公司
6.1.1 企业简介
6.1.2 经营情况
6.1.3 光纤预制棒业务
6.2 亨通光电
6.2.1 企业简介
6.2.2 经营情况
6.2.6 光纤预制棒业务
6.3 中天科技
6.3.1 企业简介
6.3.2 经营情况
6.3.3 光纤预制棒业务
6.4 烽火通信
6.4.1 企业简介
6.4.2 经营情况
6.4.3 光纤预制棒业务
6.5 富通集团
6.5.1 企业简介
6.5.2 经营情况
6.5.3 在建项目
6.5.4 光纤预制棒业务
6.6 普法公司
6.6.1 企业简介
6.6.2 经营情况
6.6.3 光纤预制棒业务
第七章 结论与预测
7.1 企业
7.2 市场
1 Overview of Optical Fiber Preform
1.1 Definition
1.2 Production Technology
1.3 Industry Chain
1.3.1 Upstream
1.3.2 Downstream
2 Global Optical Fiber Preform Industry
2.1 Status Quo
2.2 Supply & Demand
2.2.1 Supply
2.2.2 Demand
2.3 Regional Structure
2.3.1 USA
2.3.2 Japan
2.3.3 Europe
2.4 Price Trend
2.5 Competitive Landscape
3 Optical Fiber Preform Industry in China
3.1 Policy Environment
3.2 Development Course
3.3 Supply & Demand
3.3.1 Supply
3.3.2 Demand
3.4 Import & Export
3.4.1 Import
3.4.2 Export
3.5 Price Trend
3.5.1 Prices of Raw Materials
3.5.2 Prices of Optical Fiber Preform
3.6 Competitive Landscape
4 Global and Chinese Optical Fiber & Cable Market
4.1 Global
4.1.1 Market Development
4.1.2 Regional Structure
4.1.3 Price
4.1.4 Enterprise
4.2 China
4.2.1 Market Development
4.2.2 Price
4.2.3 Competitive Landscape
5 Major Global Optical Fiber Preform Producers
5.1 Corning
5.1.1 Profile
5.1.2 Operation
5.1.3 Optical Fiber Preform Business
5.1.4 Development in China
5.1.5 Corning Optical Fiber Cable Chengdu Co. Ltd.
5.2 Sumitomo Electric Industries
5.2.1 Profile
5.2.2 Operation
5.2.3 Optical Fiber Preform Business
5.2.4 Development in China
5.2.5 Chengdu SEI Optical Fiber
5.3 Shin-Etsu Chemical
5.3.1 Profile
5.3.2 Operation
5.3.3 Optical Fiber Preform Business
5.3.4 Development in China
5.4 Fujikura
5.4.1 Profile
5.4.2 Operation
5.4.3 Optical Fiber Preform Business
5.4.4 Development in China
5.4.5 Fujikura FiberHome Opto-Electronic Material Technology
5.5 Prysmian
5.5.1 Profile
5.5.2 Operation
5.5.3 Optical Fiber Preform Business
5.5.4 Development in China
5.6 Furukawa Electric
5.6.1 Profile
5.6.2 Operation
5.6.3 Optical Fiber Preform Business
5.6.4 Development in China
5.7 Twentsche Kabel Holding (TKH)
5.7.1 Profile
5.7.2 Operation
5.7.3 Optical Fiber Preform Business
5.7.4 Development in China
5.7.5 Twentsche (Nanjing) Fibre Optics
6 Major Chinese Optical Fiber Preform Companies
6.1 YOFC
6.1.1 Profile
6.1.2 Operation
6.1.3 Optical Fiber Preform Business
6.2 Hengtong Optic-electric
6.2.1 Profile
6.2.2 Operation
6.2.3 Optical Fiber Preform Business
6.3 Jiangsu Zhongtian Technology (ZTT)
6.3.1 Profile
6.3.2 Operation
6.3.3 Optical Fiber Preform Business
6.4 FiberHome Technologies
6.4.1 Profile
6.4.2 Operation
6.4.3 Optical Fiber Preform Business
6.5 Futong Group
6.5.1 Profile
6.5.2 Operation
6.5.3 Projects under Construction
6.5.4 Optical Fiber Preform Business
6.6 Potevio Fasten Optical Communication
6.6.1 Profile
6.6.2 Operation
6.6.3 Optical Fiber Preform Business
7 Summary and Forecast
7.1 Enterprise
7.2 Market
图:光纤预制棒芯棒和包层示意图
表:光纤预制棒芯棒制造工艺对比
图:2017年全球光纤预制棒芯棒工艺分布比例
表:中国光纤预制棒芯棒工艺对比
图:光纤预制棒产业链
图:中国光纤预制棒成本结构
图:光纤预制棒下游产业链
图:2010-2021年全球光纤预制棒产能与产量
图:2010-2021年全球光纤预制棒需求量
表:2010-2017年全球光纤预制棒(分国家/地区)产能及市场份额
图:2010-2017年全球(分国家/地区)光纤预制棒需求量
表:2010-2017年美国光纤预制棒产能、产量与需求量
表:2010-2016年美国光纤预制棒出口情况
表:2010-2017年日本光纤预制棒产能、产量与需求量
表:2010-2016年日本光纤预制棒出口情况
图:2000-2017年全球光纤预制棒价格
表:2010-2017年中国光纤预制棒行业相关政策
表:2017年中国光纤预制棒反倾销
表:中国光纤预制棒发展历程
图:2007-2017年中国光纤预制棒产量及同比增长
表:2017年中国光纤预制棒主要在建及规划项目
图:2010-2017年中国光纤预制棒需求量及同比增长
图:2007-2017年中国光纤预制棒自给率
图:2010-2017年中国光纤预制棒进口量及同比增长
图:2013-2017年中国光纤预制棒(分国家)进口量构成
图:2010-2017年中国光纤预制棒进口金额及同比增长
图:2010-2017年中国光纤预制棒出口量及同比增长
图:2013-2017年中国光纤预制棒(分国家)出口量构成
图:2010-2017年中国光纤预制棒出口金额及同比增长
图:2010-2017年中国锗价走势
图:2010-2017年中国光纤预制棒平均价格
图:2010-2017年中国光纤预制棒进出口价格
表:中国光纤预制棒主要生产企业股东构成及使用技术
表:2013-2017年中国主要光纤预制棒企业产能
表:2013-2017年中国主要光纤预制棒企业光棒产量
图:光纤及光缆主要结构及生产过程
图:2010-2016年全球及中国光纤产量
图:2005-2015年全球光纤光缆(分地区/国家)需求量
图:2014-2016年全球主要地区光纤需求量占比
图:2020年全球主要地区光纤光缆需求
图:2010-2018年全球主要三大地区光纤光缆需求量
图:2014-2022年全球(分地区)海底光缆收入
图:2008-2020年美国光缆市场需求规模
图:美国光缆市场出口额及同比增长
图:2013-2016年印度光纤光缆消费量
图:2013-2016年法国光纤光缆需求量
图:2014-2017年全球光纤价格趋势
表:2016年全球光纤光缆最具竞争力企业TOP10
图:2011-2021年中国光纤光缆需求量及同比增速
图:2017年中国主要电信运营商集中采购情况
图:2013-2017年中国三大电信运营商已完成集采金额
图:2012-2018年中国光纤价格走势(元/芯公里)
图:2016年中国光纤企业市场份额
表:2016年中国光纤光缆Top6企业光纤光缆产能
图:2009-2017年康宁营业收入与净利润
表:2013-2017年康宁公司(分产品)营业收入及构成
表:2012-2016年康宁公司(分地区/国家)营业收入及构成
图:2009-2017年康宁研发投入与占比
图:2011-2016年康宁电信业务部(分产品)营业收入
图:2009-2016年康宁公司在中国营业收入及占比
图:FY2008-FY2017年住友电工销售额及净利润
图:FY2008-FY2017年住友电工(分业务)销售额
图:2017财年住友电工(分业务)战略
图:FY2008-FY2016年住友电工(分地区)销售额
图:2012-2016财年住友电工研发投入及专利
图:2013-2017财年住友电工信息与通信业务销售额
图:2013-2016财年住友电工电工信息与通信业务销售额、营业利润及研发投入
图:2011-2016财年住友电工在华销售额
图:2009-2017年成都中住光纤营业收入
图:2017年信越化工(分部门)产品
图:2017年信越化工(分事业部/分地区)工厂分布
图:2011-2017财年信越化工营业收入与净利润
图:2014-2017财年信越化工(分业务)销售额构成
表:2013-2017财年信越化工(分地区)销售额及构成
图:2010-2017财年信越化工电子与功能材料部门营业收入与营业利润
图:FY2016-FY2017年信越化工电子与功能材料部门投资情况
图:FY2012-FY2017财年信越化工在中国营业收入及占比
表:信越化工在华新设的光纤预制棒合资公司概况
图:截至2017年3月底藤仓全球分布
图:2009-2017财年日本藤仓销售额与净利润
表:2017财年一季度藤仓公司经营指标情况
表:2013-2017财年藤仓(分业务)销售额及构成
图:2017财年日本藤仓(分业务)主要布局
表:2011-2016财年日本藤仓(分地区)销售额及构成
图:2012-2016财年日本藤仓(分业务)研发投入
图:FY2014-FY2017E年藤仓Power & Telecommunications(分业务)销售额
图:2011-2016财年藤仓在华销售额
图:2011-2016年藤仓烽火光电材料公司营业收入与净利润
图:2017年普瑞斯曼股权结构
图:普瑞斯曼全球布局
图:普瑞斯曼业务格局
图:截至2017年8月普瑞斯曼发展历程
图:2007-2016年普瑞斯曼销售收入及净利润
图:2017H1普瑞斯曼经营情况
图:截至2016年底普瑞斯曼全球研发中心分布
图:2016年普瑞斯曼(分业务)营业收入构成
图:2016年普瑞斯曼(分地区)营业收入构成
图:2014-2016年普瑞斯曼电信业务经营情况
图:2017H1年普瑞斯曼电信业务经营情况
图:2016年普瑞斯曼电信业务(分业务)销售额构成
图:2016年普瑞斯曼电信业务(分地区)销售额构成
图:普瑞斯曼电信业务结构及主要客户
表:截至2016年底普瑞斯曼在中国子公司分布
图:普瑞斯曼在华布局
图:古河电工全球布局
图:2020年古河电工业务规划
图:2020年古河电工全球布局规划
图:2010-2017财年古河电工净收入及营业利润
表:FY2017Q1古河电工经营情况
表:2016-2017财年古河电工(分业务)销售额
图:FY2010-FY2016年古河电工电信业务销售额及营业利润
图:2015-2017财年古河电工Communication 业务经营情况
图:古河电工Communication solutions 业务分布及子公司
表:FY2012-FY2015年古河电力电信业务(分产品)销售额及构成
图:古河电工光纤光缆产品应用
图:古河电工光纤发展趋势
图:古河电工光缆发展趋势
图:2017年古河电工电信业务全球布局战略
图:2016年古河电工光纤业务主要生产基地及在建项目
图:2016年古河电工光缆主要生产基地及在建项目
图:特恩驰全球布局
图:2009-2016年特恩驰营业收入与净利润
图:2017H1年特恩驰经营情况
图:2017年特恩驰主要收购大事件
表:2012-2017年特恩驰(分业务)收入构成
图:2012-2017年特恩驰(分地区)收入构成
图:2015-2017H1年特恩驰公司电信部门(分业务)销售额构成及业务模式
图:截至2016年底特恩驰在中国子公司分布
图:长飞光纤光缆业务结构
图:2007-2017年长飞光纤光缆公司营业收入与净利润
图:2011-2017年长飞光纤光缆公司(分产品)营业收入构成
表:2014-2016年长飞光纤光缆公司(分产品)产销量与产销率
图:2011-2017年长飞光纤光缆公司(分地区)主营业务收入
图:2011-2017年长飞光纤光缆公司(分产品)毛利率
图:2006-2016年长飞光纤光缆公司光纤预制棒产量及增速
表:长飞光纤光缆公司主要原材料供应商
图:亨通光电全球营销网络
图:2008-2017年亨通光电营业收入与净利润
表:2012-2016年亨通光电(分产品)产销量及产销率
图:2016年亨通光电(分产品)主营业务收入及占比
图:2011-2016年亨通光电光通信产品毛利率
图:2009-2016年亨通光电(分地区)营业收入
图:2017年亨通光电海外业务布局
图:2009-2017年亨通光电研发费用及占比
图:2010-2016年亨通光电光纤预制棒产能
图:2010-2016年亨通光电光纤预制棒产量与销量
表:2013-2016年亨通光电光棒外购及自供数量
表:2010-2017年亨通光电光纤预制棒扩产历程
图:中天科技主营业务布局历程
图:2009-2017年中天科技营业收入与净利润
表:2016年中天科技(分业务)主营业务收入及毛利率
图:2008-2016年中天科技(分地区)营业收入
图:2009-2017年中天科技研发费用及占比
图:2010-2016年中天科技光纤预制棒产量
表:烽火通信主要发展历程
图:烽火通信业务及子公司分布
图:2008-2017年烽火通信营业收入和净利润
图:2008-2016年烽火通信(分产品)营业收入
图:2016年烽火通信(分业务)营业收入构成
图:2008-2016年烽火通信(分地区)营业收入
图:2008-2016年烽火通信(分产品)毛利率
表:2011-2017年烽火通信研发投入及占比
表:2015-2016年烽火通信主要光纤预制棒生产公司净利润
图:2010-2016年烽火通信光纤预制棒产量
图:2017年富通集团股权结构
图:富通集团生产基地分布
图:2009-2017年富通集团营业收入与净利润
图:富通集团全球营销网络
图:2010-2017年富通集团(分业务)营业收入
图:2009-2017年富通集团(分业务)毛利率
表:2014-2017年富通集团(分产品)营业收入、毛利润和毛利率
表:2014-2017年富通集团光通信业务(分产品)产能与产量
表:2014-2017年富通集团光通信业务(分产品)销量与销售价格
表:2017年富通集团主要在建项目
表:富通集团光纤预制棒生产基地
图:2009-2017年富通集团光纤预制棒产能及产量
图:2011-2017年富通集团光纤预制棒均价
表:2013-2017年富通集团光纤预制棒前五大供应商采购金额及占比
图:2017年普法公司股权结构
图:2013-2016年普法公司营业收入与净利润
图:2006-2016年普法公司光纤预制棒产能与产量
图:2016-2017年中国光纤预制棒企业竞争格局
表:2016年中国主要光纤预制棒生产企业经营情况
图:2017-2021年中国光纤预制棒产量与需求量
Optical Fiber Preform Core and Cladding Diagram
Optical Fiber Preform Core Manufacturing Processes
Global Optical Fiber Preform Core Structure by Process, 2017
Optical Fiber Preform Core Structure by Process in China
Optical Fiber Preform Industry Chain
Optical Fiber Preform Cost Structure in China
Downstream Sectors of Optical Fiber Preform
Global Optical Fiber Preform Capacity and Output, 2010-2021
Global Demand for Optical Fiber Preform, 2010-2021E
Global Optical Fiber Preform Capacity and Market Share by Country/Region, 2010-2017
Global Demand for Optical Fiber Preform by Country/Region, 2010-2017
Optical Fiber Preform Capacity, Output and Demand in the United States, 2010-2017
Optical Fiber Preform Exports in the United States, 2010-2016
Optical Fiber Preform Capacity, Output and Demand in Japan, 2010-2017
Optical Fiber Preform Exports in Japan, 2010-2016
Global Optical Fiber Preform Prices, 2000-2017
Policies on Optical Fiber Preform Industry in China, 2010-2017
China’s Anti-dumping Measures on Optical Fiber Preform, 2017
Development Course of Optical Fiber Preform in China
Optical Fiber Preform Output and YoY Growth in China, 2007-2017
Key Optical Fiber Preform Projects Planned and under Construction in China, 2017
Optical Fiber Preform Demand and YoY Growth in China, 2010-2017
Optical Fiber Preform Self-sufficiency in China, 2007-2017
Optical Fiber Preform Import Volume and YoY Growth in China, 2010-2017
Structure of China’s Optical Fiber Preform Import Volume by Country, 2013-2017
Optical Fiber Preform Import Value and YoY Growth in China, 2010-2017
Optical Fiber Preform Export Volume and YoY Growth in China, 2010-2017
Structure of China’s Optical Fiber Preform Export Volume by Country, 2013-2017
Optical Fiber Preform Export Value and YoY Growth in China, 2010-2017
Germanium Price Trend in China, 2010-2017
Average Price of Optical Fiber Preform in China, 2010-2017
Import and Export Prices of Optical Fiber Preform in China, 2010-2017
Shareholding Structure and Technologies Applied of Major Optical Fiber Preform Manufacturers in China
Optical Fiber Preform Capacity of Key Optical Fiber Preform Producers in China, 2013-2017
Optical Fiber Preform Output of Key Optical Fiber Preform Producers in China, 2013-2017
Structure and Production Processes of Optical Fiber and Cable
Optical Fiber Output in China and Worldwide, 2010-2016
Global Demand for Optical Fiber and Cable by Country/Region, 2005-2015
Optical Fiber Demand Structure in the World’s Major Regions, 2014-2016
Demand for Optical Fiber and Cable in the World’s Major Regions, 2020E
Demand for Optical Fiber and Cable in the World’s Major Three Regions, 2010-2018E
Global Submarine Optical Cable Revenue by Region, 2014-2022E
Demand for Optical Cable in the United States, 2008-2020E
U.S. Optical Cable Exports and YoY Growth
Optical Fiber and Cable Consumption in India, 2013-2016
Demand for Optical Fiber and Cable in France, 2013-2016
Price Trend of Optical Fiber Worldwide, 2014-2017
Global Top10 Most Competitive Optical Fiber and Cable Enterprises, 2016
Optical Fiber and Cable Demand and YoY Growth in China, 2011-2021E
Centralized Purchasing by Major Chinese Telecom Carriers, 2017
Completed Centralized Purchase Amount of Three Chinese Telecom Carriers, 2013-2017
Optical Fiber Price Trend in China, 2012-2018 (RMB/core•km)
Market Share of Optical Fiber Enterprises in China, 2016
Optical Fiber and Optical Cable Capacity of Top 6 Enterprises in China, 2016
Revenue and Net Income of Corning, 2009-2017
Revenue Structure of Corning (by Product), 2013-2017
Revenue Structure of Corning (by Country/Region), 2012-2016
R&D Costs and % of Total Revenue of Corning, 2009-2017
Revenue of Corning’s Telecom Business Segment by Product, 2011-2016
Corning’s Revenue in China and Percentage, 2009-2016
Revenue and Net Income of Sumitomo Electric, FY2008-FY2017
Revenue of Sumitomo Electric by Business, FY2008-FY2017
Sumitomo Electric’s Business Strategies, FY2017
Revenue of Sumitomo Electric by Region, FY2008-FY2016
R&D Costs and Patents of Sumitomo Electric, FY2012-FY2016
Sumitomo Electric’s Revenue from Information and Communications Business, FY2013-FY2017
Revenue, Operating Income, and R&D Costs of Sumitomo Electric’s Information and Communications Business, FY2013-FY2016
Sumitomo Electric’s Revenue in China, FY2011-FY2016
Revenue of Chengdu SEI Optical Fiber Co., Ltd., 2009-2017
Products of Shin-Etsu Chemical by Division, 2017
Shin-Etsu Chemical’s Plants by Business Division/by Region, 2017
Revenue and Net Income of Shin-Etsu Chemical, FY2011-FY2017
Revenue Structure of Shin-Etsu Chemical by Business, FY2014-FY2017
Revenue Structure of Shin-Etsu Chemical by Region, FY2013-FY2017
Revenue and Operating Income of Shin-Etsu Chemical’s Electronic and Functional Materials Division, FY2010-FY2017
Investment of Shin-Etsu Chemical’s Electronic and Functional Materials Division, FY2016-FY2017
Shin-Etsu Chemical’s Revenue in China and Percentage, FY2012-FY2017
Overview of New Optical Fiber Preform Joint Ventures in China
Global Presence of Fujikura by the End of Mar 2017
Revenue and Net Income of Fujikura, FY2009-FY2017
Business Indicators of Fujikura, FY2017Q1
Revenue Structure of Fujikura by Business, FY2013-FY2017
Fujikura’s Operations, FY2017
Revenue Structure of Fujikura by Region, FY2011-FY2016
Fujikura’s R&D Costs by Business, FY2012-FY2016
Fujikura’s Power & Telecommunications Revenue by Business, FY2014-FY2017
Fujikura’s Revenue in China, FY2011-FY2016
Revenue and Net Income of Fujikura FiberHome Opto-Electronic Material Technology, 2011-2016
Equity Structure of Prysmian, 2017
Global Presence of Prysmian
Business Operations of Prysmian
Development Course of Prysmian by Aug 2017
Revenue and Net Income of Prysmian, 2007-2016
Business Performance of Prysmian, 2017H1
Global R&D Centers of Prysmian by the End of 2016
Revenue Structure of Prysmian by Business, 2016
Revenue Structure of Prysmian by Region, 2016
Performance of Prysmian’s Telecommunications Business, 2014-2016
Performance of Prysmian’s Telecommunications Business, 2017H1
Telecommunications Business Revenue of Prysmian by Business, 2016
Telecommunications Business Revenue of Prysmian by Region, 2016
Telecommunications Business Structure and Key Clients of Prysmian
Prysmian’s Subsidiaries in China by the End of 2015
Prysmian’s Presence in China
Global Presence of Furukawa Electric
Business Planning of Furukawa Electric, 2020E
Furukawa Electric’s Planning for Global Presence, 2020E
Net Revenue and Operating Income of Furukawa Electric, FY2010-FY2017
Business Performance of Furukawa Electric, FY2017Q1
Revenue of Furukawa Electric by Business, FY2016-FY2017
Revenue and Operating Income of Furukawa Electric’s Communications Solutions, FY2010-FY2016
Business Performance of Furukawa Electric’s Communications Solutions, FY2015-FY2017
Furukawa Electric’s Communications Solutions and Related Subsidiaries
Revenue Structure of Furukawa Electric’s Communications Solutions by Product, FY2012-FY2015
Application of Optical Fiber and Optical Cable Products of Furukawa Electric
Optical Fiber Development Trends of Furukawa Electric
Optical Cable Development Trends of Furukawa Electric
Furukawa Electric’s Global Strategy for Communications Solutions, 2017
Main Optical Fiber Production Bases and Projects under Construction of Furukawa Electric, 2016
Main Optical Cable Production Bases and Projects under Construction of Furukawa Electric, 2016
Global Presence of TKH
Revenue and Net Income of TKH, 2009-2016
Business Performance of TKH, 2017H1
Major Acquisitions of TKH, 2017
Revenue Structure of TKH by Business, 2012-2017
Revenue Structure of TKH by Region, 2012-2017
Revenue and Business Model of TKH’s Telecom Division by Business, 2015-2017H1
TKH’s Subsidiaries in China by the End of 2016
Business Structure of YOFC
Revenue and Net Income of YOFC, 2007-2017
Revenue Structure of YOFC by Product, 2011-2017
Output, Sales and Sales/Output Ratio of YOFC by Product, 2014-2016
Operating Revenue of YOFC by Region, 2011-2017
Gross Margin (by Product) of YOFC, 2011-2017
Optical Fiber Preform Output and Growth Rate of YOFC, 2006-2016
Key Suppliers of Raw Materials for YOFC
Global Marketing Network of Hengtong Optic-Electric
Revenue and Net Income of Hengtong Optic-Electric, 2008-2017
Output, Sales Volume and Sales-Output Ratio of Hengtong Optic-Electric by Product, 2012-2016
Operating Revenue Structure of Hengtong Optic-Electric by Product, 2016
Gross Margin of Hengtong Optic-Electric’s Optical Communications Products, 2011-2016
Revenue of Hengtong Optic-Electric by Region, 2009-2016
Overseas Operations of Hengtong Optic-Electric, 2017
R&D Costs and % of Total Revenue of Hengtong Optic-Electric, 2009-2017
Optical Fiber Preform Capacity of Hengtong Optic-Electric, 2010-2016
Optical Fiber Preform Output and Sales of Hengtong Optic-Electric, 2010-2016
Optical Fiber Preform Procurement and Self-Supply Quantity of Hengtong Optic-Electric, 2013-2016
Optical Fiber Preform Capacity Expansion History of Hengtong Optic-Electric, 2010-2017
Evolution of ZTT’s Primary Business
Revenue and Net Income of ZTT, 2009-2017
Operating Revenue and Gross Margin of ZTT by Business, 2016
Revenue of ZTT by Region, 2008-2016
R&D Costs and % of Total Revenue of ZTT, 2009-2017
Optical Fiber Preform Output of ZTT, 2010-2016
Milestones of FiberHome Technologies
Business and Subsidiaries of FiberHome Technologies
Revenue and Net Income of FiberHome Technologies, 2008-2017
Revenue of FiberHome Technologies by Product, 2008-2016
Revenue Structure of FiberHome Technologies by Business, 2016
Revenue of FiberHome Technologies by Region, 2008-2016
Gross Margin of FiberHome Technologies by Product, 2008-2016
R&D Costs and % of Total Revenue of FiberHome Technologies, 2011-2017
Net Income of Major Optical Fiber Preform Manufacturing Companies of FiberHome Technologies, 2015-2016
Optical Fiber Preform Output of FiberHome Technologies, 2010-2016
Equity Structure of Futong Group, 2017
Futong Group’s Production Bases
Revenue and Net Income of Futong Group, 2009-2017
Global Marketing Network of Futong Group
Revenue of Futong Group by Business, 2010-2017
Gross Margin of Futong Group by Business, 2009-2017
Revenue, Gross Profit and Gross Margin of Futong Group, 2014-2017
Capacity and Output of Futong Group’s Optical Communications Business by Product, 2014-2017
Sales and Selling Prices of Futong Group’s Optical Communications Business by Product, 2014-2017
Key Projects under Construction of Futong Group, 2017
Optical Fiber Preform Production Bases of Futong Group
Optical Fiber Preform Capacity and Output of Futong Group, 2009-2017
Average Prices of Optical Fiber Preform of Futong Group, 2011-2017
Futong Group’s Procurement of Raw Materials for Optical Fiber Preform from Top 5 Suppliers and % of Total Procurement, 2013-2017
Equity Structure of Potevio Fasten Optical Communication, 2017
Revenue and Net Income of Potevio Fasten Optical Communication, 2013-2016
Optical Fiber Preform Capacity and Output of Potevio Fasten Optical Communication, 2006-2016
Competitive Landscape of Global Optical Fiber Preform Market, 2016-2017
Operation of Key Optical Fiber Preform Producers in China, 2016
Optical Fiber Preform Output and Demand in China, 2017-2021E
如果这份报告不能满足您的要求,我们还可以为您定制报告,请 留言说明您的详细需求。
|