|
|
|
报告导航:研究报告—
生命科学—制药医疗
|
|
2018-2022年中国血液制品行业研究报告 |
 |
字数:4.5万 |
页数:140 |
图表数:168 |
|
中文电子版:12000元 |
中文纸版:6000元 |
中文(电子+纸)版:12500元 |
|
英文电子版:3200美元 |
英文纸版:3400美元 |
英文(电子+纸)版:3500美元 |
|
编号:ZLC-064
|
发布日期:2018-02 |
附件:下载 |
 |
|
|
在行业政策以及下游需求的推动下,中国血液制品行业步入了发展期。从批签发量来看,2016年中国血液制品批签发量总量达6411万瓶,同比增长20.4%。经历了2016年高增长后,受两票制影响,2017年批签发放缓,全年批签发总量与去年基本持平,为6429万瓶。
其中,人血白蛋白和静注人免疫球蛋白(pH4)批签发量分别为3895万瓶和1007万瓶,分别同比下降0.9%和7.5%。主要原因是甘肃所未披露血液制品批签发数据以及两票制导致的批签发放缓。同时,人凝血酶原复合物、静注乙型肝炎人免疫球蛋白(pH4)和狂犬病人免疫球蛋白批签发量增长幅度较大,分别增长26.8%、46.7%和36.8%。
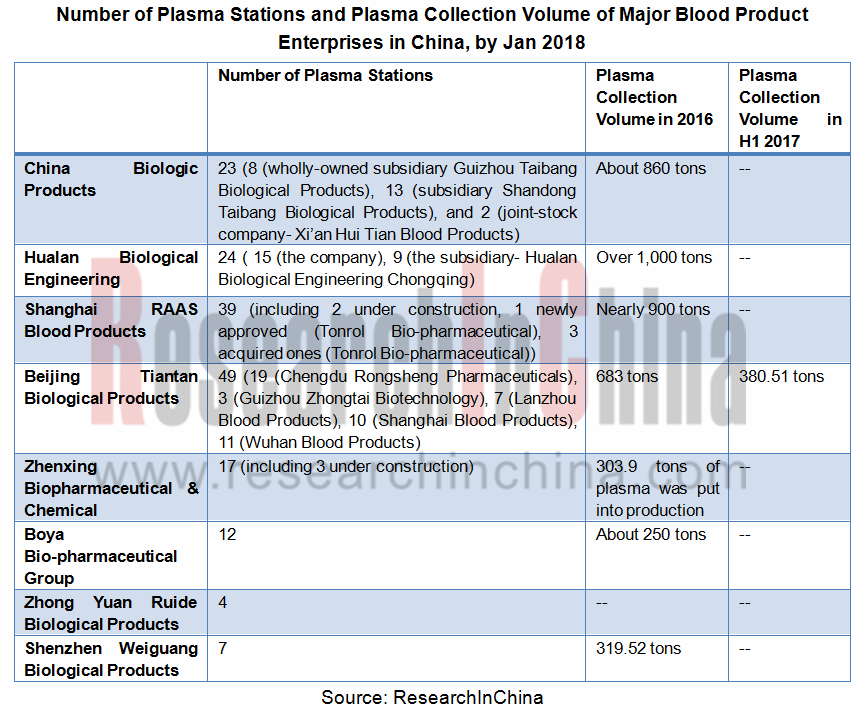
目前,中国共有30多家血液制品生产企业,行业集中度不高。其中,以泰邦生物、华兰生物、上海莱士、天坛生物等为代表的企业竞争实力相对更强。一方面,其血液制品产品线更为丰富,另一方面其血浆站相对更多,原料供应充足。

未来,中国血液制品行业主要向以下三个方面发展:
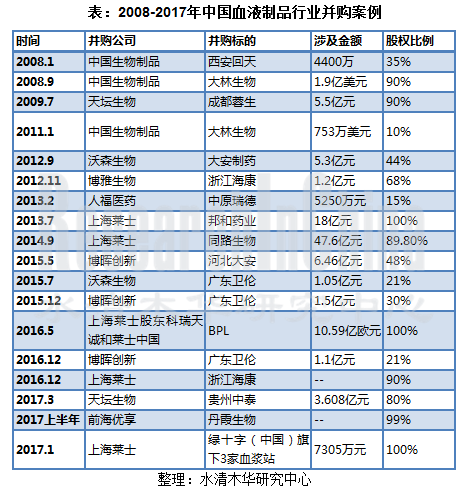
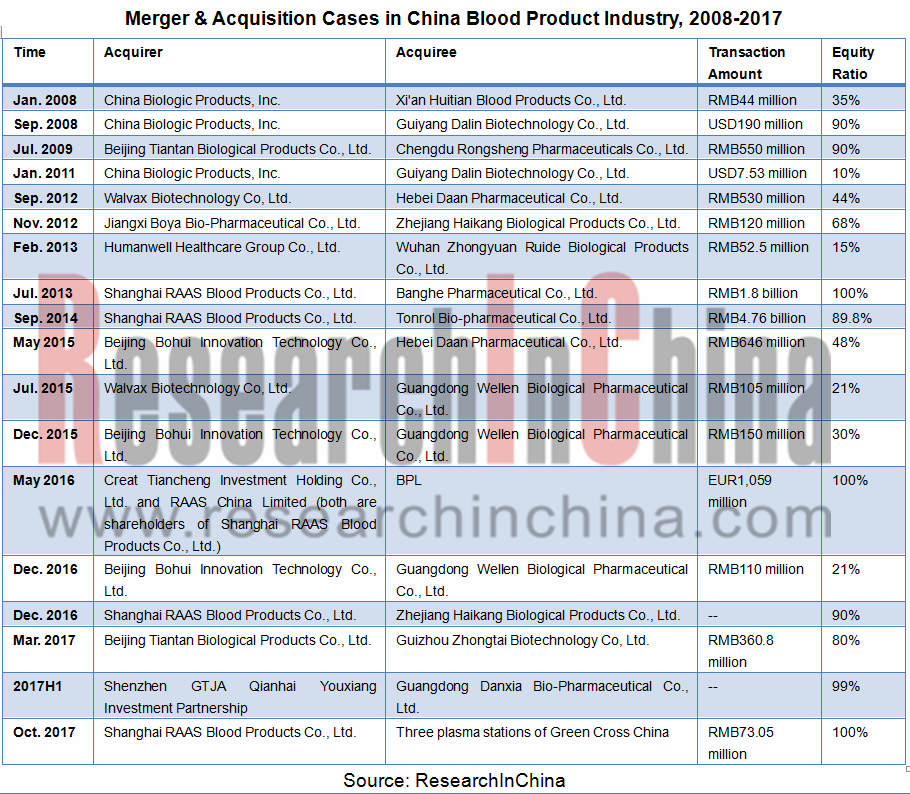
一、行业整合加快,集中度进一步提升:近年来,中国血液制品公司间并购行业逐步增多,行业整合加快,集中度逐步提升。

二、采浆量和浆站数量决定行业地位:浆站数量直接影响采浆量的多少,采浆量的多少直接影响企业原料供应,因此采浆量和浆站数量决定企业在行业的地位。目前,天坛生物已完成资产重组,采浆站数量达49家,为业内浆站数量第一,未来有望成为行业龙头。
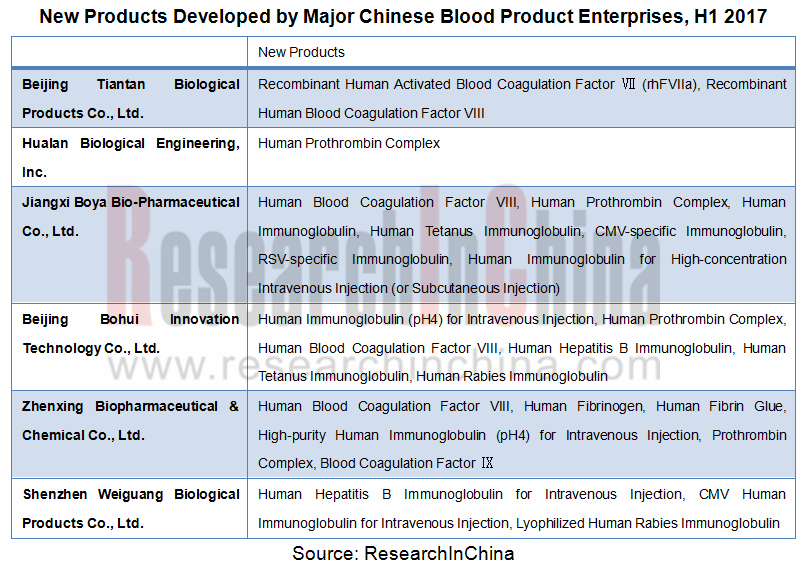
三、企业加大研发力度开发新品有利于提高血浆利用率:目前,中国血液制品企业正纷纷加大研发力度进行新品研发,一方面将提升企业综合实力,另一方面也将提升血浆的综合利用率,减少血浆资源浪费。

《2018-2022年中国血液制品行业研究报告》主要包括以下内容:
 中国血液制品行业发展分析,包括相关政策、发展现状、市场结构、供需分析、市场规模、竞争格局分析等; 中国血液制品行业发展分析,包括相关政策、发展现状、市场结构、供需分析、市场规模、竞争格局分析等;
中国血液制品行业细分市场分析,包括人血白蛋白、静注人免疫球蛋白(pH4)、人凝血因子Ⅷ、乙型肝炎人免疫球蛋白、人免疫球蛋白、人凝血酶原复合物等;
15家血液制品企业分析,包括经营情况、营收构成、毛利率、研发投资、血液制品业务及发展战略分析;
总结与预测,以及发展趋势分析。
The blood product industry in China develops under stimulation of industry policies and downstream demand. The country recorded total lot release volume of 64.11 million bottles of blood products in 2016, representing a year-on-year rise of 20.4%. After high growth in 2016, the lot release decelerated in 2017 due to two-invoice system (one invoicing for “from pharmaceutical company to primary dealer”, and the other invoicing for “from dealers to hospitals”) with full-year quantity standing at 64.29 million bottles, being on a par with the year-ago level.
Human albumin registered lot release volume of 38.95 million bottles and human immunoglobulin (pH4) for intravenous injection 10.07 million bottles in 2017, down 0.9% and 7.5% from a year ago, respectively, largely due to a slow-down in lot release caused by failure of Gansu Institute of Biological Products in disclosing data on lot release volume of blood products and two-invoice system. Meanwhile, the lot release volume of human prothrombin complex, human hepatitis B immunoglobulin (pH4) for intravenous injection, and human rabies immunoglobulin soared by 26.8%, 46.7% and 36.8%, respectively.
There are over 30 blood product manufacturers in a less concentrated industry in China. Among them, China Biologic Products, Hualan Biological Engineering, Shanghai RAAS Blood Products and Beijing Tiantan Biological Products are more competitive, as they have richer blood product lines and adequate supply of raw materials from plasma stations.
In the future, China’s blood product industry will head for the following three aspects:
1. Faster industry integration, higher concentration: over the years, the rising number of M&A cases among Chinese blood product companies gave a boost to industry integration and concentration.
2. Plasma collection volume and number of plasma stations determine position in industry: number of plasma stations has a direct impact on collection volume, and raw material supply of companies directly hinges on collection volume. In current stage, Beijing Tiantan Biological Products Co., Ltd. has completed assets restructuring, and is hopefully to be the bellwether of the industry for it boasts 49 plasma stations, ranking first in the industry.
3. Companies’ more input on research and development of new products is a boon for higher utilization of plasma: Chinese blood product companies are now racing to develop new products, with the aims of stronger comprehensive strength and higher utilization of plasma to reduce waste.
The report highlights the following:
 Analysis on development of China blood product industry, including policies, status quo, market structure, supply & demand, market size and competitive landscape; Analysis on development of China blood product industry, including policies, status quo, market structure, supply & demand, market size and competitive landscape;
Analysis on market segments of China blood product industry, covering human albumin, human immunoglobulin (pH4) for intravenous injection, blood coagulation factor VIII, hepatitis B human immunoglobulin, human immunoglobulin, human prothrombin complex and the like;
Analysis on 15 blood product enterprises, including operation, revenue structure, gross margin, R & D investment, blood product business and development strategy;
Summary & forecast and trends.
第一章 概述
1.1 血液制品定义
1.2 血液制品分类
1.3 重组血液制品
1.4 血液制品产业链
1.5 血液制品特点
第二章 中国血液制品行业发展分析
2.1 相关政策
2.2 发展现状
2.3 市场结构
2.4 供需分析
2.4.1 供应分析
2.4.2 需求分析
2.5 市场规模
2.6 竞争格局
第三章 中国血液制品行业细分市场分析
3.1 人血白蛋白
3.1.1 发展现状
3.1.2 市场结构
3.1.3 竞争格局
3.1.4 发展前景
3.2 静注人免疫球蛋白(pH4)
3.2.1 发展现状
3.2.2 竞争格局
3.2.3 发展前景
3.3 人凝血因子Ⅷ
3.3.1 发展现状
3.3.2 竞争格局
3.3.3 发展前景
3.4 乙型肝炎人免疫球蛋白
3.4.1 发展现状
3.4.2 竞争格局
3.5 人免疫球蛋白
3.5.1 发展现状
3.5.2 竞争格局
3.6 人凝血酶原复合物
3.6.1 发展现状
3.6.2 竞争格局
3.7 破伤风人免疫球蛋白
3.7.1 发展现状
3.7.2 竞争格局
3.8 狂犬病人免疫球蛋白
3.8.1 发展现状
3.8.2 竞争格局
第四章 主要企业
4.1 泰邦生物集团公司
4.1.1 公司简介
4.1.2 经营情况
4.1.3 营收构成
4.1.4 毛利率
4.1.5 研发投资
4.1.6 血液制品业务
4.1.7 贵州泰邦生物制品有限公司
4.1.8 山东泰邦生物制品有限公司
4.1.9 西安回天血液制品有限责任公司
4.2 华兰生物工程股份有限公司
4.2.1 公司简介
4.2.2 经营情况
4.2.3 营收构成
4.2.4 毛利率
4.2.5 研发投资
4.2.6 血液制品业务
4.2.7 发展战略
4.3 上海莱士
4.3.1 公司简介
4.3.2 经营情况
4.3.3 营收构成
4.3.4 毛利率
4.3.5 研发投资
4.3.6 血液制品业务
4.3.7 发展战略
4.4 天坛生物
4.4.1 公司简介
4.4.2 经营情况
4.4.3 营收构成
4.4.4 毛利率
4.4.5 研发投资
4.4.6 血液制品业务
4.4.7 发展战略
4.5 振兴生化
4.5.1 公司简介
4.5.2 经营情况
4.5.3 营收构成
4.5.4 毛利率
4.5.5 主要客户
4.5.6 研发与投资
4.5.7 血液制品业务
4.5.8 发展战略
4.6 博雅生物
4.6.1 公司简介
4.6.2 经营情况
4.6.3 营收构成
4.6.4 毛利率
4.6.5 研发与投资
4.6.6 血液制品业务
4.6.7 发展战略
4.7 中原瑞德
4.7.1 公司简介
4.7.2 经营情况
4.7.3 血液制品业务
4.7.4 发展战略
4.8 蜀阳药业
4.8.1 公司简介
4.8.2 血液制品业务
4.9 上海生物制品研究所
4.9.1 公司简介
4.9.2 血液制品业务
4.10 武汉生物制品研究所
4.10.1 公司简介
4.10.2 血液制品业务
4.11 康宝生物
4.11.1 公司简介
4.11.2 血液制品业务
4.12 绿十字(中国)
4.12.1 公司简介
4.12.2 血液制品业务
4.13 博晖创新
4.13.1 公司简介
4.13.2 经营情况
4.13.3 营收构成
4.13.4 毛利率
4.13.5 研发投资
4.13.6 血液制品业务
4.13.7 河北大安
4.13.8 广东卫伦
4.14 卫光生物
4.14.1 公司简介
4.14.2 经营情况
4.14.3 营收构成
4.14.4 毛利率
4.14.5 研发投资
4.14.6 血液制品业务
4.14.7 发展战略
4.15 南岳生物制药有限公司
4.15.1 公司简介
4.15.2 血液制品业务
第五章 总结与预测
5.1 总结预测
5.2 发展趋势
5.2.1 行业整合加快,集中度进一步提升
5.2.2 采浆量和浆站数量决定行业地位
5.2.3 采浆量逐步提升
5.2.4 企业以加强研发投入开发新产品以提升竞争力
5.2.5 血浆综合利用率进一步提升
5.2.6 下游需求带动行业发展
5.2.7 医疗卫生体制改革不断深入、医疗保险制度不断健全利好行业发展
1. Overview of Blood Products
1.1 Definition
1.2 Classification
1.3 Recombinant Blood Products
1.4 Industry Chain
1.5 Features
2. Development of China Blood Product Industry
2.1 Related Policies
2.2 Status Quo
2.3 Market Structure
2.4 Market Supply and Demand
2.4.1 Supply
2.4.2 Demand
2.5 Market Size
2.6 Competition Pattern
3. Market Segments of China Blood Product Industry
3.1 Human Albumin
3.1.1 Development Status
3.1.2 Market Structure
3.1.3 Competition Pattern
3.1.4 Prospects
3.2 Human Immunoglobulin (pH4) for Intravenous Injection
3.2.1 Development Status
3.2.2 Competition Pattern
3.2.3 Prospects
3.3 Coagulation Factor VIII
3.3.1 Development Status
3.3.2 Competition Pattern
3.3.3 Prospects
3.4 Hepatitis B Immunoglobulin
3.4.1 Development Status
3.4.2 Competition Pattern
3.5 Human Immunoglobulin
3.5.1 Development Status
3.5.2 Competition Pattern
3.6 Human Prothrombin Complex
3.6.1 Development Status
3.6.2 Competition Pattern
3.7 Tetanus Immunoglobulin
3.7.1 Development Status
3.7.2 Competition Pattern
3.8 Human Rabies Immunoglobulin
3.8.1 Development Status
3.8.2 Competition Pattern
4. Major Enterprises
4.1 China Biologic Products (CBPO)
4.1.1 Profile
4.1.2 Operation
4.1.3 Revenue Structure
4.1.4 Gross Margin
4.1.5 R&D Investment
4.1.6 Blood Products Business
4.1.7 Guizhou Taibang Biological Products Co., Ltd.
4.1.8 Shandong Taibang Biological Products Co., Ltd.
4.1.9 Xi'an Huitian Blood Products Co., Ltd.
4.2 Hualan Biological Engineering Co., Ltd.
4.2.1 Profile
4.2.2 Operation
4.2.3 Revenue Structure
4.2.4 Gross Margin
4.2.5 R&D Investment
4.2.6 Blood Products Business
4.2.7 Development Strategy
4.3 Shanghai RAAS Blood Products
4.3.1 Profile
4.3.2 Operation
4.3.3 Revenue Structure
4.3.4 Gross Margin
4.3.5 R&D Investment
4.3.6 Blood Products Business
4.3.7 Development Strategy
4.4 Beijing Tiantan Biological Products
4.4.1 Profile
4.4.2 Operation
4.4.3 Revenue Structure
4.4.4 Gross Margin
4.4.5 R&D Investment
4.4.6 Blood Products Business
4.4.7 Development Strategy
4.5 Zhenxing Biopharmaceutical & Chemical
4.5.1 Profile
4.5.2 Operation
4.5.3 Revenue Structure
4.5.4 Gross Margin
4.5.5 Major Customers
4.5.6 R&D and Investment
4.5.7 Blood Products Business
4.5.8 Development Strategy
4.6 Jiangxi Boya Bio-Pharmaceutical
4.6.1 Profile
4.6.2 Operation
4.6.3 Revenue Structure
4.6.4 Gross Margin
4.6.5 R&D and Investment
4.6.6 Blood Products Business
4.6.7 Development Strategy
4.7 Wuhan ZhongyuanRuide Biological Products
4.7.1 Profile
4.7.2 Operation
4.7.3 Blood Products Business
4.7.4 Development Strategy
4.8 Sichuan Yuanda Shuyang Pharmaceutical Co., Ltd.
4.8.1 Profile
4.8.2 Blood Products Business
4.9 Shanghai Institute of Biological Products
4.9.1 Profile
4.9.2 Blood Products Business
4.10 Wuhan Institute of Biological Products Co., Ltd.
4.10.1 Profile
4.10.2 Blood Products Business
4.11 Shanxi Kangbao Biological Product
4.11.1 Profile
4.11.2 Blood Products Business
4.12 Green Cross China
4.12.1 Profile
4.12.2 Blood Products Business
4.13 Beijing Bohui Innovation Technology
4.13.1 Profile
4.13.2 Operation
4.13.3 Revenue Structure
4.13.4 Gross Margin
4.13.5 R&D Investment
4.13.6 Blood Products Business
4.13.7 Hebei Da’an Pharmaceutical
4.13.8 Guangdong Weilun Biological Pharmaceutical
4.14 Weiguang Biological Products
4.14.1 Profile
4.14.2 Operation
4.14.3 Revenue Structure
4.14.4 Gross Margin
4.14.5 R&D Investment
4.14.6 Blood Products Business
4.14.7 Development Strategy
4.15 Nanyue Biopharming Corporation Ltd.
4.15.1 Profile
4.15.2 Blood Products Business
5. Summary and Forecast
5.1 Summary
5.2 Development Trend
5.2.1 Industry Integration Speeds Up, Concentration Rises Further
5.2.2 Plasma Collection Volume and Number of Plasma Stations Determine the Status in the Industry
5.2.3 Plasma Volume Increases Progressively
5.2.4 Enterprises Make More Input in R&D of New Products to Sharpen Competitiveness
5.2.5 Comprehensive Utilization of Blood Plasma Gets a Further Rise
5.2.6 Downstream Demand Stimulates the Development of the Industry
5.2.7 Healthcare System Reform Deepens, Gradual Perfection of Medical Insurance System Favors the Development of the Industry
图:血液的基本组成
图:血浆蛋白分离程序
表:血液制品的分类及作用
表:基因重组类血制品与传统血制品对比
表:国内外重组血液制品产品种类及对比
图:血液制品产业链
图:血浆采集与分离的生产工艺耗时
图:血液制品企业与化学制药企业运营成本及费用对比
图:血液制品生产销售周期
表:1989-2016年中国血液制品主要政策
表:中国血液制品行业发展历程
表:2014-2017年中国主要血液制品批签发量
表:2014-2017年中国血液制品产品结构(按批签发量计)
表:中国与美国、欧洲部分国家血浆采集政策对比
表:中国与欧美国家人均献浆频率及采浆量对比
图:2010-2017年中国单采血浆站数量及同比增长率
表:2014-2017年中国血液制品主要企业浆站获批情况
图:2010-2017年中国采浆量及同比增长率
表:2017年VS2009年国家医保目录血液制品纳入情况对比
图:2015-2025年中国血浆供需对比
表:血液制品取消限价后价格与原最高零售价对比
图:2010-2017年中国血液制品行业市场规模
表:截至2018年1月中国主要血液制品企业血浆站数量及采浆量
表:中国主要血液制品生产企业主要产品
图:2013-2017年中国主要血液制品企业营业收入对比
图:2013-2017年中国主要血液制品企业净利润对比
图:2013-2017年中国主要血液制品企业血液制品业务收入对比
图:2016年中国血液制品行业市场份额(分企业)
图:2010-2017年中国人血白蛋白批签发量及同比增长率
图:2010-2017年中国人血白蛋白批签发量国产与进口比例
图:2017年中国人血白蛋白批签发量及占比(分企业)
图:2013-2017年中国血液制品主要企业人血白蛋白销售收入
图:2010-2017年中国静注人免疫球蛋白(pH4)批签发量及同比增长率
图:2017年中国静注人免疫球蛋白(pH4)批签发量及占比(分企业)
图:2013-2017年中国血液制品主要企业静注人免疫球蛋白(pH4)销售收入
图:2010-2017年中国人凝血因子Ⅷ批签发量及同比增长率
图:2017年中国人凝血因子Ⅷ批签发量及占比(分企业)
图:2010-2017年中国乙型肝炎人免疫球蛋白批签发量及同比增长率
图:2017年中国乙型肝炎人免疫球蛋白批签发量及占比(分企业)
图:2010-2017年中国人免疫球蛋白批签发量及同比增长率
图:2017年中国人免疫球蛋白批签发量及占比(分企业)
图:2010-2017年中国人凝血酶原复合物批签发量及同比增长率
图:2017年中国人凝血酶原复合物批签发量及占比(分企业)
图:2010-2017年中国破伤风人免疫球蛋白批签发量及同比增长率
图:2017年中国破伤风人免疫球蛋白批签发量及占比(分企业)
图:2010-2017年中国狂犬病人免疫球蛋白批签发量及同比增长率
图:2017年中国狂犬病人免疫球蛋白批签发量及占比(分企业)
表:CBPO产品线
图:2012-2017年泰邦生物营业收入及净利润
图:2012-2017年泰邦生物营业收入(分产品)
图:2012-2017年泰邦生物营业收入构成(分产品)
图:2012-2017年泰邦生物毛利率
图:2012-2017年泰邦生物研发投入及占总营收比重
图:截至2016年底CBPO在研产品及研发进度
表:2015-2017年泰邦生物血液制品批签发
表:截至2018年1月贵州泰邦主要单采血浆站
表:2016-2017年贵州泰邦血液制品批签发量
表:山东泰邦股权结构
表:截至2018年1月山东泰邦主要单采血浆站
表:2016-2017年山东泰邦血液制品批签发量
表:西安回天股权结构
表:截至2018年1月西安回天主要单采血浆站
图:2013-2017年华兰生物营业收入及净利润
图:2013-2017年华兰生物营业收入(分业务)
图:2013-2017年华兰生物营业收入构成(分产品)
图:2013-2017年华兰生物毛利率(分产品)
图:2013-2017年华兰生物研发支出及占总营收比重
表:华兰生物血液制品各类及规格
图:2013-2017年华兰生物血液制品业务收入及占总营收比重
表:2015-2017年华兰生物血液制品批签发量
图:2016-2022年华兰生物营业收入及净利润
图:2013-2017年上海莱士营业收入及净利润
表:2013-2017年上海莱士营业收入(分产品)
图:2013-2017年上海莱士营业收入(分地区)
图:2013-2017年上海莱士营业收入构成(分地区)
图:2013-2017年上海莱士毛利率(分产品)
图:2013-2017年上海莱士研发投入及占总营收比重
表:上海莱士及下属子公司可生产的血液制品
表:2015-2017年上海莱士血液制品批签发量
图:2016-2022年上海莱士营业收入及净利润
图:2013-2017年天坛生物营业收入及净利润
图:2013-2016年天坛生物主营业务收入(分产品)
图:2013-2016年天坛生物主营业务收入构成(分产品)
图:2013-2016年天坛生物主营业务收入(分地区)
图:2013-2016年天坛生物主营业务收入构成(分地区)
图:2013-2016年天坛生物毛利率(分产品)
图:2013-2017年天坛生物研发支出及占总营收比重
表:2016年天坛生物主要药(产)品研发投入金额
表:截至2016年底天坛生物在研项目进展情况
表:天坛生物资产重组主要内容
图:2015-2017年成都蓉生营业收入及净利润
表:2015-2017年成都蓉生血液制品批签发量
图:2017-2022年天坛生物营业收入及净利润
图:2013-2017年振兴生化营业收入及净利润
图:2013-2017年振兴生化营业收入(分产品)
图:2013-2017年振兴生化营业收入构成(分产品)
图:2013-2017年振兴生化毛利率
表:2014-2016年振兴生化前五名客户销售额及占比
图:2013-2017年振兴生化研发支出及占总营收比重
表:2016年振兴生化非公开发行A股股票募集资金用途
图:2014-2017年广东双林营业收入及净利润
图:2013-2016年广东双林投浆量
表:2015-2017年广东双林血液制品批签发量
图:2013-2016年振兴生化血液制品产销量及库存量
图:2016-2022年振兴生化营业收入及净利润
图:2013-2017年博雅生物营业收入及净利润
图:2013-2017年博雅生物营业收入(分业务)
图:2013-2017年博雅生物营业收入构成(分业务)
图:2013-2016年博雅生物毛利率(分业务)
图:2013-2017年博雅生物主要血液制品毛利率
图:2013-2017年博雅生物研发支出及占总营收比重
表:2017年博雅生物新获专利情况
表:2015-2017年博雅生物营业收入(分产品)
表:2015-2017年博雅生物血液制品批签发量
图:2016-2022年博雅生物营业收入及净利润
图:中原瑞德发展历程
表:2014-2016年中原瑞德财务数据
表:截至2018年1月中原瑞德主要单采血浆站
表:2016-2017年中原瑞德血液制品批签发量
图:远大蜀阳发展历程
表:远大蜀阳血液制品及规格
表:2016-2017年远大蜀阳血液制品批签发量
表:截至2018年1月上海所主要单采血浆站
表:上海所主要血液制品产品及规格
表:2016-2017年上海所血液制品批签发量
表:截至2018年1月武汉所主要单采血浆站
表:2016-2017年武汉所血液制品批签发量
表:截至2018年1月康宝生物主要单采血浆站
表:2016-2017年康宝生物血液制品批签发量
表:截至2018年1月绿十字中国主要单采血浆站
表:2016-2017年绿十字中国血液制品批签发量
图:2014-2017年博晖创新营业收入及净利润
表:2014-2017年博晖创新营业收入(分产品)
表:2014-2017年博晖创新营业收入构成(分产品)
图:2014-2017年博晖创新毛利率(分产品)
图:2014-2017年博晖创新研发投入及占总营收比重
表:截至2017上半年博晖创新血液制品业务在研项目进展情况
表:博晖创新主要血液制品产品
表:2015-2016年博晖创新血液制品产销及库存量
表:截至2018年1月大安制药主要单采血浆站
图:2015-2017年河北大安营业收入及净利润
表:2016-2017年河北大安血液制品批签发量
表:截至2018年1月广东卫伦单采血浆站
表:2016-2017年广东卫伦血液制品批签发量
图:2014-2017年卫光生物营业收入及净利润
表:2014-2017年卫光生物主营业务收入(分产品)
表:2014-2016年卫光生物主营业务收入(分地区)
图:2014-2016年卫光生物毛利率
表:2014-2016年卫光生物毛利率(分产品)
图:2014-2017年卫光生物研发投入及占总营收比重
表:截至2017上半年卫光生物在研项目进展
表:2017年卫光生物IPO募集资金用途
表:2017上半年卫光生物单采血浆站财务数据
图:2014-2016年卫光生物采浆量
表:2014-2016年卫光生物主要产品产能、产量、销量情况
图:2014-2016年卫光生物销售均价(分产品)
表:2016-2017年卫光生物血液制品批签发量
图:2016-2022年卫光生物营业收入及净利润
表:截至2018年1月南岳生物主要单采血浆站
表:2016-2017年南岳生物血液制品批签发量
图:2017-2022E中国血液制品行业市场规模
表:国外血液制品巨头并购案例
表:2008-2017年中国血液制品行业并购案例
图:2017-2022年中国采浆量及同比增长率
图:2013-2017年中国血液制品主要企业研发投入
表:中国血液制品主要企业在研新品
Basic Components of Blood
Plasma Protein Separation Procedure
Classification and Effects of Blood Products
Comparison between Gene Recombinant Blood Products and Traditional Blood Products
Comparison between Gene Recombinant Blood Products and Traditional Blood Products in China and Overseas
Blood Product Industry Chain
Time Length of Plasma Collection and Separation Process
Comparison between Blood Product Enterprises and Chemical & Pharmaceutical Enterprises in Operating Costs and Expenses
Production & Sales Cycle of Blood Products
Main Policies on China Blood Product Industry, 1989-2017
Development History of China Blood Product Industry
Lot Release Volume of Major Blood Products in China, 2014-2017
Blood Product Structure in China (by Lot Release Volume), 2014-2017
Plasma Collection Policies in China vs. USA and European Countries
Per Capita Frequency of Plasma Donation and Plasma Collection Volume in China vs. Euro-America
Number of Plasma Collection Stations and YoY Growth Rate in China, 2008-2017
Plasma Station Approval of Major Blood Product Enterprises in China, 2014-2017
Plasma Collection Volume and YoY Growth Rate in China, 2008-2017
Comparison of Blood Products Covered in Drug Catalogue of National Basic Medical Insurance, 2017-2009
Plasma Supply and Demand in China, 2015-2025E
Comparison between the Price (After Cancellation of Limit Price) of Blood Products and the Original Retail Price Ceiling
Market Size of China Blood Product Industry, 2010-2017
Number of Plasma Stations and Plasma Volume of Major Blood Product Enterprises in China, As of Jan. 2018
Main Products of Major Blood Product Manufacturing Enterprises in China
Revenue of Major Blood Product Enterprises in China, 2013-2017
Net Income of Major Blood Product Enterprises in China, 2013-2017
Revenue from Blood Products Business of Major Blood Product Enterprises in China, 2013-2017
Market Share of China Blood Product Industry (by Enterprise), 2015
Market Share of China Blood Product Industry (by Enterprise), 2016
Market Share of China Blood Product Industry (by Enterprise), 2017
Lot Release Volume and YoY Growth Rate of Human Albumin in China, 2010-2017
Proportion of Domestic and Imported Human Albumin in China (by Lot Release Volume), 2007-2017
Market Share of Human Albumin in China (by Lot Release Volume), 2017
Market Share of Human Albumin in China (by Lot Release Volume), 2016
Human Albumin Sales of Major Human Albumin Enterprises in China, 2013-2017
Lot Release Volume of Human Immunoglobulin for Intravenous Injection in China, 2010-2017
Market Share of Human Immunoglobulin (pH4) for Intravenous Injection in China (by Lot Release Volume), 2017
Market Share of Human Immunoglobulin (pH4) for Intravenous Injection in China (by Lot Release Volume), 2016
Human Immunoglobulin (pH4) for Intravenous Injection Sales of Major Blood Products Enterprises in China, 2013-2017
Lot Release Volume of Blood Coagulation Factor VIII in China, 2010-2017
Market Share of Blood Coagulation Factor VIII in China (by Lot Release Volume), 2017
Lot Release Volume of Hepatitis B Immunoglobulin in China, 2010-2017
Market Share of Hepatitis B Immunoglobulin in China (by Lot Release Volume), 2017
Lot Release Volume of Human Immunoglobulin in China, 2010-2017
Market Share of Human Immunoglobulin in China (by Lot Release Volume), 2017
Lot Release Volume of Human Prothrombin Complex in China, 2010-2017
Market Share of Human Prothrombin Complex in China (by Lot Release Volume), 2017
Lot Release Volume of Tetanus Immunoglobulin in China, 2010-2017
Market Share of Tetanus Immunoglobulin in China (by Lot Release Volume), 2017
Lot Release Volume of Human Rabies Immunoglobulin in China, 2010-2017
Market Share of Human Rabies Immunoglobulin in China (by Lot Release Volume), 2017
Product Line of CBPO
Revenue and Operating Income of CBPO, 2012-2017
Revenue Breakdown of CBPO (by Product), 2012-2017
Revenue Structure of CBPO (by Product), 2012-2017
Gross Margin of CBPO, 2012-2017
R&D Costs and % of Total Revenue of CBPO, 2012-2017
CBPO’s Products under Research and R&D Process by the end of 2016
Lot Release Volume of Blood Products of CBPO, 2015-2017
Main Plasma Collection Stations of Guizhou Taibang Biological Products as of Jan. 2018
Lot Release Volume of Blood Products of Guizhou Taibang Biological Products, 2016-2017
Ownership Structure of Shandong Taibang Biological Products
Main Plasma Collection Stations of Shandong Taibang Biological Products as of Jan. 2018
Lot Release Volume of Blood Products of Shandong Taibang Biological Products, 2016-2017
Ownership Structure of Xi'an Huitian Blood Products
Main Plasma Collection Stations of Xi'an Huitian Blood Products as of 2018
Revenue and Net Income of Hualan Biological Engineering, 2013-2017
Revenue Breakdown of Hualan Biological Engineering (by Product), 2013-2017
Revenue Structure of Hualan Biological Engineering (by Product), 2013-2017
Gross Margin of Blood Products of Hualan Biological Engineering (by Product), 2013-2017
R&D Costs and % of Total Revenue of Hualan Biological Engineering, 2013-2017
Category and Specification of Blood Products of Hualan Biological Engineering
Revenue of Blood Products of Hualan Biological Engineering, 2013-2017
Lot Release Volume of Blood Products of Hualan Biological Engineering, 2015-2017
Revenue and Net Income of Hualan Biological Engineering, 2016-2022E
Revenue and Net Income of Shanghai RAAS Blood Products, 2013-2017
Revenue Breakdown of Shanghai RAAS Blood Products (by Product), 2013-2017
Revenue Breakdown of Shanghai RAAS Blood Products (by Region), 2013-2017
Revenue Structure of Shanghai RAAS Blood Products (by Region), 2013-2017
Gross Margin of Shanghai RAAS Blood Products (by Product), 2013-2017
R&D Costs of Shanghai RAAS Blood Products, 2013-2017
Blood Products of Shanghai RAAS Blood Products and Its Subsidiaries
Lot Release Volume of Blood Products of Shanghai RAAS Blood Products, 2015-2017
Revenue and Net Income of Shanghai RAAS Blood Products, 2016-2022E
Revenue and Net Income of Tiantan Biological Products, 2013-2017
Revenue Breakdown of TIANTANBIO (by Product), 2013-2016
Revenue Structure of TIANTANBIO (by Product), 2013-2016
Revenue Breakdown of TIANTANBIO (by Region), 2013-2016
Revenue Structure of TIANTANBIO (by Region), 2013-2016
Gross Margin of TIANTANBIO (by Product), 2013-2016
R&D Costs and % of Total Revenue of TIANTANBIO, 2013-2017
R&D Input of Major Projects of TIANTANBIO, 2016
Progress of Major R&D Projects of TIANTANBIO, by the End of 2016
Main Content of Assets Restructuring of Beijing Tiantan Biological Products
Revenue and Net Income of Chengdu Rongsheng, 2015-2017
Lot Release Volume of Main Blood Products of Chengdu Rongsheng, 2015-2017
Revenue and Net Income of TIANTANBIO, 2017-2022E
Revenue and Net Income of Zhenxing Biopharmaceutical & Chemical, 2013-2017
Revenue Breakdown of Zhenxing Biopharmaceutical & Chemical (by Product), 2013-2017
Revenue Structure of Zhenxing Biopharmaceutical & Chemical (by Product), 2013-2017
Gross Margin of Zhenxing Biopharmaceutical & Chemical, 2013-2017
Zhenxing Biopharmaceutical & Chemical’s Sales from Top 5 Customers, 2014-2016
R&D Costs and % of Total Revenue of Zhenxing Biopharmaceutical & Chemical, 2013-2017
Use of Funds Raised by Zhenxing Biopharmaceutical & Chemical through Private Issuing of A Shares, 2016
Revenue and Net Income of Shuanglin Bio-Pharmacy, 2014-2017
Production-use Plasma Volume of Guangdong Shuanglin Bio-Pharmacy, 2013-2016
Lot Release Volume of Blood Products of Guangdong Shuanglin Bio-Pharmacy, 2015-2017
Output, Sales Volume and Inventory of Blood Products of Zhenxing Biopharmaceutical & Chemical, 2013-2016
Revenue and Net Income of Zhenxing Biopharmaceutical & Chemical, 2016-2022E
Revenue and Net Income of Jiangxi Boya Bio-Pharmaceutical, 2013-2017
Revenue Breakdown of Jiangxi Boya Bio-Pharmaceutical (by Business), 2013-2017
Revenue Structure of Jiangxi Boya Bio-Pharmaceutical (by Business), 2013-2017
Gross Margin of Jiangxi Boya Bio-Pharmaceutical (by Business), 2013-2016
Gross Margin of Main Blood Products of Jiangxi Boya Bio-Pharmaceutical, 2013-2017
R&D Costs of Jiangxi Boya Bio-Pharmaceutical, 2013-2017
New Patents of Jiangxi Boya Bio-Pharmaceutical, 2017
Revenue of Jiangxi Boya Bio-Pharmaceutical by Product, 2015-2017
Lot Release Volume of Blood Products of Jiangxi Boya Bio-Pharmaceutical, 2015-2017
Revenue and Net Income of Jiangxi Boya Bio-Pharmaceutical, 2016-2022E
Development Course of ZhongyuanRuide Biological Products
Financial Data of Zhongyuan Ruide, 2014-2016
Main Plasma Collection Stations of ZhongyuanRuide Biological Products, as of Jan. 2018
Lot Release Volume of Blood Products of ZhongyuanRuide Biological Products, 2016-2017
Development History of Sichuan Yuanda Shuyang Pharmaceutical
Specification of Blood Products of Sichuan Yuanda Shuyang Pharmaceutical
Lot Release Volume of Blood Products of Sichuan Yuanda Shuyang Pharmaceutical, 2016-2017
Plasma Collection Stations of Shanghai Institute of Biological Products as of Jan. 2018
Specification of Main Blood Products of Shanghai Institute of Biological Products
Lot Release Volume of Blood Products of Shanghai Institute of Biological Products, 2016-2017
Plasma Collection Stations of Wuhan Institute of Biological Products, as of Jan. 2018
Lot Release Volume of Blood Products of Wuhan Institute of Biological Products, 2016-2017
Plasma Collection Stations of Shanxi Kangbao Biological Product as of Jan. 2018
Lot Release Volume of Blood Products of Shanxi Kangbao Biological Product, 2016-2017
Plasma Collection Stations of Green Cross China as of Jan. 2018
Lot Release Volume of Blood Products of Green Cross China, 2016-2017
Revenue and Net Income of Beijing Bohui Innovation Technology, 2014-2017
Revenue of Beijing Bohui Innovation Technology by Product, 2014-2017
Revenue Structure of Beijing Bohui Innovation Technology by Product, 2014-2017
Gross Margin of Beijing Bohui Innovation Technology by Product, 2014-2017
R&D Costs and % of Total Revenue of Beijing Bohui Innovation Technology, 2014-2017
Progress of Major Blood Product R&D Projects of Beijing Bohui Innovation Technology, as of 2017H1
Major Blood Products of Beijing Bohui Innovation Technology
Output, Sales Volume and Inventory of Blood Products of Beijing Bohui Innovation Technology, 2015-2016
Plasma Collection Stations of Hebei Da’an Pharmaceutical, as of Jan. 2018
Revenue and Net Income of Hebei Da’an Pharmaceutical, 2015-2017
Lot Release Volume of Blood Products of Hebei Da’an Pharmaceutical, 2016-2017
Plasma Collection Stations of Guangdong Weilun Biological Pharmaceutical, as of Jan.2018
Lot Release Volume of Blood Products of Guangdong Weilun Biological Pharmaceutical, 2016-2017
Revenue and Net Income of Shenzhen Weiguang Biological Products, 2014-2017
Revenue Breakdown and Structure of Shenzhen Weiguang Biological Products (by Product), 2014-2017
Revenue Breakdown and Structure of Shenzhen Weiguang Biological Products (by Region), 2014-2016
Gross Margin of Shenzhen Weiguang Biological Products, 2014-2016
Gross Margin of Shenzhen Weiguang Biological Products (by Product), 2014-2016
R&D Costs and % of Total Revenue of Shenzhen Weiguang Biological Products, 2014-2017
R&D Process of Products under Research of Shenzhen Weiguang Biological Products, as of 2017H1
Fundraising Projects of Shenzhen Weiguang Biological Products, 2017
Financial Data of Plasma Collection Stations of Shenzhen Weiguang Biological Products, 2017H1
Plasma Collection Volume of Shenzhen Weiguang Biological Products, 2014-2016
Capacity, Output and Sales Volume of Major Products of Shenzhen Weiguang Biological Products, 2014-2016
Average Sales Price of Major Products of Shenzhen Weiguang Biological Products, 2014-2016
Lot Release Volume of Blood Products of Shenzhen Weiguang Biological Products, 2016-2017
Revenue and Net Income of Shenzhen Weiguang Biological Products, 2016-2022E
Plasma Collection Stations of Nanyue Biopharming, as of Jan.2018
Lot Release Volume of Blood Products of Nanyue Biopharming, 2016-2017
Market Size of Blood Products in China, 2017-2022E
M&A Cases of Foreign Blood Product Companies
M&A Cases in China Blood Product Industry, 2008-2017
Plasma Collection Volume and YoY Change in China, 2017-2022E
R&D Investments of Major Chinese Blood Product Enterprises, 2013-2017
New Products Being Developed of Major Chinese Blood Product Enterprises
如果这份报告不能满足您的要求,我们还可以为您定制报告,请 留言说明您的详细需求。
|