|
|
|
报告导航:研究报告—
制造业—工业机械
|
|
2018-2022年全球及中国自动光学检测系统行业报告 |
 |
字数:3.2万 |
页数:190 |
图表数:186 |
|
中文电子版:12000元 |
中文纸版:6000元 |
中文(电子+纸)版:12500元 |
|
英文电子版:3200美元 |
英文纸版:3400美元 |
英文(电子+纸)版:3500美元 |
|
编号:ZJF117
|
发布日期:2018-06 |
附件:下载 |
 |
|
|
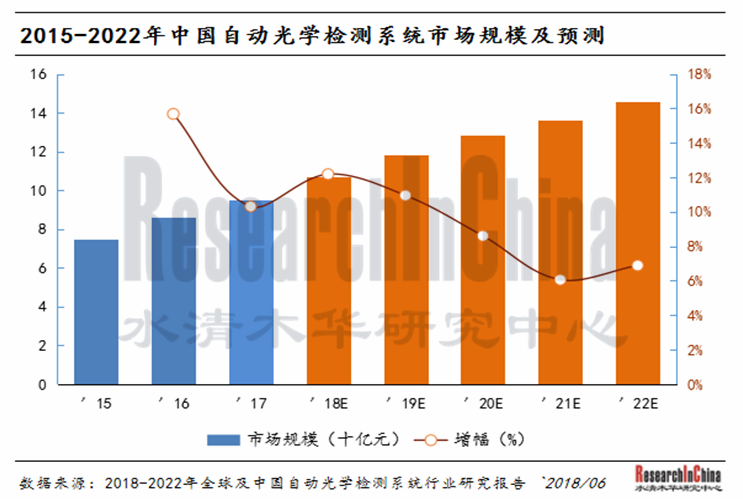
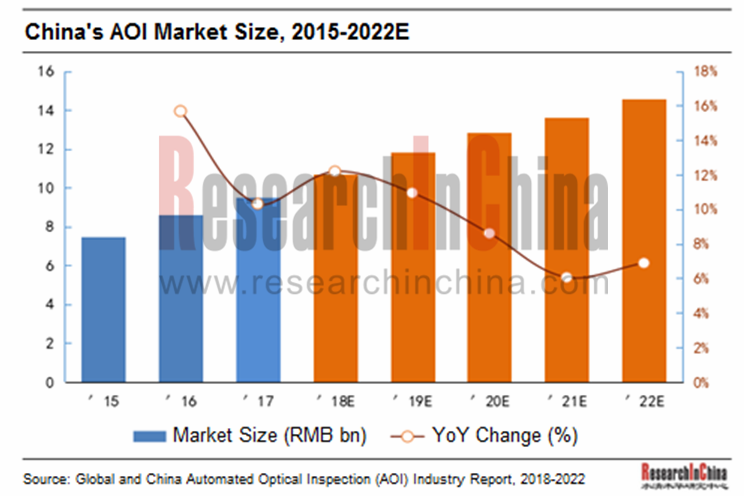
电子产品的小型化推动了各类元器件的微型化,进而拉动自动检测设备的需求不断提升,随着电子元器件产能不断向中国转移,配套的自动光学检测设备在过去几年经历了快速发展的过程,2017年中国该市场规模达到95.2亿元,较上年增长10.3%,在全球AOI市场规模中占比21.7%。未来随着人工智能,汽车电子等相关行业的快速发展,中国政府对高端装备制造支持政策的逐步落实,包括AOI在内高端设备市场将进一步得到扩张,预计2017-2022年中国AOI市场规模的年均复合增长率将达到8.9%。
AOI检测主要用在PCB市场、FPD行业、半导体以及光伏电池等其他行业。目前在中国应用最广的是PCB行业,FPD行业及半导体行业应用率较高但市场规模相对较小,2017年分别占据AOI总市场规模的63.9%、15.6%以及13.7%。
在竞争格局方面,国内AOI检测设备市场仍主要由国外厂商主导,国内的神州视觉、上海矩子智能、深圳易科讯、深圳振华兴、浙江欧威科技、深圳劲拓等渐渐崭露头角。但由于其研发实力弱,技术创新匮乏,主要应用范围集中于下游制程(如PCB),竞争较为惨烈,2017年多数企业营收及市场份额均有所下降。
相比而言,国际大厂要么以全产品线的方式占领各主要细分领域,代表企业为以色列的奥宝科技、日本的网屏以及韩国的高永科技;要么是以欧姆龙、KLA-Tencor、HB为代表的企业主要以前端产业(如半导体、FPD等)为目标,占据高端市场,随着中国电子元器件良率要求不断提升,拉动高端AOI的需求不断扩大,国际大厂的市场份额随之不断提高。此外,台湾部分厂商则假道台湾元器件产业配套关系,延伸到大陆市场,形式另一股竞争势力,如德律科技、由田新技、牧德科技等,但受政治氛围影响,2015年来逐渐式微。
《2018-2022年全球及中国自动光学检测(AOI)行业研究报告》主要进行了以下研究:
 自动光学检测行业概况(包括定义、分类、组成结构、优势、相关技术、产业链、市场特点、经营模式等); 自动光学检测行业概况(包括定义、分类、组成结构、优势、相关技术、产业链、市场特点、经营模式等);
全球自动光学检测市场(包括市场现状、市场规模、竞争格局、发展趋势等);
中国自动光学检测市场(包括行业政策、市场现状、市场规模、市场需求、竞争格局、发展前景等);
自动光学检测行业下游(包括PCB行业、FPD行业、IC行业等市场规模及市场需求等);
包括奥宝科技、康代、欧姆龙、网屏、HB、高永科技、KLA-Tencor、德律科技、由田新技、美德客以及赛凯在内的11家全球主要自动光学检测企业(包括企业简介、经营业绩、营收构成、研发支出、AOI业务、发展战略、在华业务等);
包括神州视觉、上海矩子智能、深圳易科讯、深圳振华兴、浙江欧威科技、深圳劲拓、中导光电、南京协力等在内的10家中国主要自动光学检测企业(包括企业简介、经营业绩、营收构成、研发支出、AOI业务、发展战略等)。
Miniaturization of electronic products conduces to components of all sorts being smaller and smaller and spurs the growing demand for automated inspection equipment. In the wake of a transfer of electronic components production capacity to China, the AOI equipment has been developing by leaps and bounds over the past several years. In 2017, Chinese AOI market was worth RMB9.52 billion, a surge of 10.3% from a year earlier and making up 21.7% of the global AOI market size. As the industries such as artificial intelligence and automotive electronics are advancing rapidly and China’s policies on high-end equipment manufacturing are being implemented, the market of high-end equipment inclusive of AOI will be booming and it is projected that the Chinese AOI market size will keep a CAGR of 8.9% between 2017 and 2022.
AOI is primarily served for PCB, FPD, semiconductor and photovoltaic cell, and finds most application in PCB sector. There is a limited market size of AOI applied in FPD industry and semiconductor industry. In 2017, AOI use in PCB, FPD and semiconductor seized a respective market share of 63.9%, 15.6% and 13.7% in total AOI market size.
As concerns competition, the Chinese AOI equipment market is still firmly dominated by foreign companies while Chinese players have come to the fore, such as Aleader, Jutze Intelligence, Ekt-Tech, Zhenhuaxing Technology, Ovi Technology and JT Automation Equipment. Those Chinese firms focus on the downstream process (like PCB) and compete fiercely due to weak R&D capability and lack of technological innovation, and consequently most of them saw a drop in both revenue and market share in 2017.
By comparison, the large multinational corporations represented by Israel-based Orbotech, Japan-based Screen and South Korea-based Koh Young Technology make foray into market segments with full product portfolios, or the foreign players represented by Omron, KLA-Tencor and HB target the front end industry (like semiconductor and FPD) and occupy the high-end market. Along with the higher and higher demanding on the yield of electronic components in China, the demand for high-end AOI keeps expanding and the international giants seize more and more market shares. In addition, Taiwanese vendors (like Test Research, Inc., Utechzone, and Machvision) approach the Mainland Chinese market by dint of Taiwan’s components supply relationship and form a competitive force which however was beginning to wind down owing to the deteriorating political climate since 2015.
The report highlights the followings:
 AOI industry overview (definition, classification, composition, advantages, technologies, market features, industrial chain, business model, etc.); AOI industry overview (definition, classification, composition, advantages, technologies, market features, industrial chain, business model, etc.);
Global AOI market (status quo, market size, competitive landscape, development trends, etc.);
Chinese AOI market (policy, status quo, market size, demand, competitive pattern, development prospects, etc.);
Downstream of AOI Industry (market size, demand and so forth of PCB industry, FPD industry, IC industry, etc.);
11 world-renowned companies (Orbotech, Camtek, Omron, Screen, HB, Koh Young Technology, KLA-Tencor, TRI, Utechzone, Mirtec, SAKI), involving profile, performance, revenue structure, R&D expenditure, AOI business, development strategy, operations in China, etc.);
10 Chinese AOI companies (Aleader, Jutze Intelligence, Ekt-Tech, Zhenhuaxing Technology, Ovi Technology, 3i Systems, Xieli Electronic, JT Automation Equipment, Star River Comtes, and Mingfu Automation), involving profile, performance, revenue structure, R&D expenditure, AOI business, development strategy, etc.)
第一章 自动光学检测行业概况
1.1 定义和分类
1.1.1 定义
1.1.2 分类
1.2 组成结构及优势
1.2.1 组成结构
1.2.2 优势及特点
1.3 AOI相关技术
1.3.1 概况
1.3.2 技术发展趋势
1.4 产业链
1.4.1 概况
1.4.2 上游
1.4.3 下游
1.5 行业政策
第二章 全球自动光学检测市场
2.1 市场规模
2.2 竞争格局
第三章 中国自动光学检测市场
3.1 市场现状及市场规模
3.2 市场需求
3.3 竞争格局
第四章 PCB行业检测市场
4.1 概况
4.2 PCB行业运行情况
4.3 PCB行业AOI市场规模
第五章 FPD行业检测市场
5.1 概况
5.2 TFT-LCD行业运行情况
5.3 FPD行业AOI市场规模
第六章 半导体行业检测
6.1 概况
6.2 整体市场运行情况
6.3 IC行业运行情况
6.4 半导体AOI市场规模
第七章 全球主要自动光学检测企业
7.1 奥宝科技Orbotech
7.1.1 公司简介
7.1.2经营业绩
7.1.3营收构成
7.1.4研发支出
7.1.5毛利率分析
7.1.6光学检测设备业务
7.1.7 主要AOI解决方案
7.1.8 发展战略
7.1.9 在华业务
7.2 康代Camtek
7.2.1 公司简介
7.2.2经营业绩
7.2.3营收构成
7.2.4毛利率分析
7.2.5研发支出
7.2.6光学检测设备业务
7.2.7在华业务
7.2.8康代影像科技有限公司
7.3 KLA-Tencor
7.3.1公司简介
7.3.2经营业绩
7.3.3营收构成
7.3.4研发支出
7.3.5主要产品
7.3.6在华业务
7.3.7艺高半导体设备(深圳)有限公司
7.4 欧姆龙Omron
7.4.1 公司简介
7.4.2经营业绩
7.4.3营收构成
7.4.4毛利率分析
7.4.5研发支出
7.4.6工业自动化控制事业
7.4.7光学检测设备业务
7.4.8在华业务
7.5 高永技术KohYoung Technology
7.5.1 公司简介
7.5.2经营业绩
7.5.3营收构成
7.5.4毛利率分析
7.5.5研发支出
7.5.6光学检测设备业务
7.6 网屏Screen
7.6.1 公司简介
7.6.2经营业绩
7.6.3营收构成
7.6.4研发支出
7.6.5光学检测设备业务
7.6.6在华业务
7.7 HB Technology(韩国)
7.7.1 公司简介
7.7.2经营业绩
7.7.3营收构成
7.7.4 毛利率分析
7.7.5研发支出
7.7.6光学检测设备业务
7.8 德律科技TRI
7.8.1 公司简介
7.8.2经营业绩
7.8.3营收构成
7.8.4毛利率分析
7.8.5研发支出
7.8.6主要产品产销量
7.8.7光学检测设备业务
7.8.8在华业务
7.8.9 德律泰电子(深圳)有限公司
7.9由田新技Utechzone
7.9.1 公司简介
7.9.2经营业绩
7.9.3营收构成
7.9.4毛利率分析
7.9.5研发支出
7.9.6主要产品产销量
7.9.7光学检测设备业务
7.9.9 发展战略
7.10 美德客科技Mirtec
7.10.1 公司简介
7.10.2光学检测设备业务
7.10.3在华业务
7.11赛凯SAKI
7.11.1 公司简介
7.11.2光学检测设备业务
7.11.3在华业务
7.11.4 最新进展
第八章 中国主要自动光学检测企业
8.1 深圳市劲拓自动化设备(JT Automation Equipment)
8.1.1 公司简介
8.1.2经营业绩
8.1.3营收构成
8.1.4毛利率
8.1.5研发支出
8.1.6光学检测设备业务
8.1.7发展战略
8.2北京星河康帝思科技(Star River Comtes)
8.2.1 公司简介
8.2.2经营业绩
8.2.3营收构成
8.2.4 毛利率分析
8.2.5研发支出
8.3 东莞市神州视觉科技(Aleader)
8.3.1 公司简介
8.3.2光学检测设备业务
8.4 上海矩子智能科技(Jutze Intelligence)
8.4.1 公司简介
8.4.2光学检测设备业务
8.5 深圳易科讯科技(Ekt-Tech)
8.5.1 公司简介
8.5.2光学检测设备业务
8.6 深圳振华兴科技(Zhenhua xing Technology)
8.6.1 公司简介
8.6.2光学检测设备业务
8.6.3主要客户及销售网络
8.7 浙江欧威科技(Ovi Technology)
8.7.1 公司简介
8.7.2光学检测设备业务
8.8 江苏明富自动化科技
8.8.1 公司简介
8.8.2光学检测设备业务
8.8.3 主要客户
8.9 中导光电
8.9.1 公司简介
8.9.2经营业绩
8.9.3营收构成
8.9.4光学检测设备业务
8.9.5 主要客户及销售网络
8.10 南京协力
8.10.1 公司简介
8.10.2光学检测设备业务
1. Overview of AOI Industry
1.1 Definition and Classification
1.1.1 Definition
1.1.2 Classification
1.2 Composition and Advantages
1.2.1 Composition and Structure
1.2.2 Advantages and Characteristics
1.3 AOI Related Technologies
1.3.1 Profile
1.3.2 Trends
1.4 Industry Chain
1.4.1 Profile
1.4.2 Upstream
1.4.3 Downstream
1.5 Industry Policy
2. Global AOI Market
2.1 Market Size
2.2 Competition
3. China AOI Market
3.1 Market Status and Market Size
3.2 Market Demand
3.3 Competition
4. Application of AOI in PCB
4.1 Profile
4.2 Operation of PCB Industry
4.3 AOI Market Size
5. Application of AOI in FPD
5.1 Profile
5.2 Operation of TFT-LCD Industry
5.3 AOI Market Size
6. Application of AOI in Semiconductor
6.1 Profile
6.2 Overall Market Operation
6.3 Operation of IC Industry
6.4 AOI Market Size
7. AOI Players Worldwide
7.1 Orbotech
7.1.1 Profile
7.1.2 Operation
7.1.3 Revenue Structure
7.1.4 R&D Expenses
7.1.5 Gross Margin
7.1.6 AOI Business
7.1.7 AOI Solutions
7.1.8 Development Strategy
7.1.9 Business in China
7.2 Camtek
7.2.1 Profile
7.2.2 Operation
7.2.3 Revenue Structure
7.2.4 Gross Margin
7.2.5 R&D Expenses
7.2.6 AOI Business
7.2.7 Business in China
7.2.8 Camtek Imaging Technology Co., Ltd.
7.3 KLA-Tencor
7.3.1 Profile
7.3.2 Operation
7.3.3 Revenue Structure
7.3.4 R&D Expenses
7.3.5 Main Products
7.3.6 Business in China
7.3.7 ICOS Semiconductor Equipment (Shenzhen) Co., Ltd.
7.4 Omron
7.4.1 Profile
7.4.2 Operation
7.4.3 Revenue Structure
7.4.4 Gross Margin
7.4.5 R&D Expenses
7.4.6 Industrial Automation Business
7.4.7 AOI Business
7.4.8 Business in China
7.5 KohYoung Technology
7.5.1 Profile
7.5.2 Operation
7.5.3 Revenue Structure
7.5.4 Gross Margin
7.5.5 R&D Expenses
7.5.6 AOI Business
7.6 Screen
7.6.1 Profile
7.6.2 Operation
7.6.3 Revenue Structure
7.6.4 R&D Expenditure
7.6.5 AOI Business
7.6.6 Business in China
7.7 HB Technology (Korea)
7.7.1 Profile
7.7.2 Operation
7.7.3 Revenue Structure
7.7.4 Gross Margin
7.7.5 R&D Expenses
7.7.6 AOI Business
7.8 TRI
7.8.1 Profile
7.8.2 Operation
7.8.3 Revenue Structure
7.8.4 Gross Margin
7.8.5 R&D Expenses
7.8.6 Output and Sales Volume
7.8.7 AOI Business
7.8.8 Business in Mainland China
7.8.9 Tri Electronic (Shenzhen) Co., Ltd.
7.9 Utechzone
7.9.1 Profile
7.9.2 Operation
7.9.3 Revenue Structure
7.9.4 Gross Margin
7.9.5 R&D Expenses
7.9.6 Output and Sales Volume
7.9.7 AOI Business
7.9.8 Development Strategy
7.10 Mirtec
7.10.1 Profile
7.10.2 AOI Business
7.10.3 Business in China
7.11 SAKI
7.11.1 Profile
7.11.2 AOI Business
7.11.3 Business in China
7.11.4 Latest Development
8. AOI Players in China
8.1 JT Automation Equipment
8.1.1 Profile
8.1.2 Operation
8.1.3 Revenue Structure
8.1.4 Gross Margin
8.1.5 R&D Input
8.1.6 AOI Business
8.1.7 Development Strategy
8.2 Star River Comtes
8.2.1 Profile
8.2.2 Operation
8.2.3 Revenue Structure
8.2.4 Gross Margin
8.2.5 R&D Expenses
8.3 Aleader
8.3.1 Profile
8.3.2 AOI Business
8.4 Jutze Intelligence
8.4.1 Profile
8.4.2 AOI Business
8.5 Ekt-Tech
8.5.1 Profile
8.5.2 AOI Business
8.6 Zhenhuaxing Technology
8.6.1 Profile
8.6.2 AOI Business
8.6.3 Customers and Sales Network
8.7 Ovi Technology
8.7.1 Profile
8.7.2 AOI Business
8.8 Mingfu Automation
8.8.1 Profile
8.8.2 AOI Business
8.8.3 Main Clients
8.9 3i Systems
8.9.1 Profile
8.9.2 Operation
8.9.3 Revenue Structure
8.9.4 AOI Business
8.9.5 Customers and Sales Network
8.10 Xieli Electronic
8.10.1 Profile
8.10.2 AOI Business
光学检测设备分类
AOI系统组成
AOI设备优势
AOI设备行业相关技术
AOI设备产业链
光学检测设备上游原材料主要供货来源国
AOI主要应用行业及检测项目
SMT工艺流程
AOI设备在SMT生产线中的应用
AOI在太阳能电池生产线中的应用
2006-2017年中国AOI行业相关政策
2015-2022年全球AOI市场规模及同比增长
2015-2022年全球AOI市场规模(分应用行业)
2015-2017全球主要AOI厂商及其AOI业务收入
国外及中国AOI设备厂商优势和劣势对比
2015-2022年中国AOI市场规模
2015年中国主要AOI市场需求领域
2015-2022年中国主要AOI市场需求领域市场规模
2017年中国AOI市场主要厂商市场份额
中国主要AOI厂家及AOI业务收入
PCB产业链
AOI在PCB行业应用
2015-2022年全球PCB产值及同比增长
2016-2022年全球PCB细分市场产值
2015-2022年全球PCB产值构成(分区域)
2015-2022年中国大陆PCB产值及同比增长
2015-2022年全球应用于PCB检测的AOI市场规模及同比增长
2014-2022年中国应用于PCB检测的AOI市场规模及同比增长
AOI在TFT-LCD生产线中的应用
TFT-LCD生产过程主要检查设备
2015-2022年全球大尺寸TFT-LCD面板出货量及同比增长
2016-2022年全球大尺寸TFT-LCD面板出货量(分应用领域)
2015-2022年全球应用于FPD行业检测的AOI市场规模及同比增长
2015-2022年中国应用于FPD行业检测的AOI市场规模
AOI在晶圆制造中的应用
AOI在晶圆测试中应用
AOI在IC封装中应用
AOI在IC测试中应用
2015-2022年全球半导体行业销售额及同比增长
2015-2022年全球半导体行业销售额构成(分产品)
2015-2022年全球半导体行业销售额构成(分区域)
2016-2017年全球Top10半导体供应商收入
2015-2022年全球集成电路行业销售额及同比增长
2010-2017年中国集成电路行业销售额及同比增长
2011-2017年中国集成电路行业销售额在全球集成电路销售额中占比
2015-2022年全球半导体设备销售额(分区域)
2015-2022年全球半导体制程控制设备市场规模
2015-2022年中国半导体制程控制设备市场规模测算表
2015-2022年中国半导体AOI市场规模测算表
2009-2018年奥宝科技营业收入及净利润
2014-2018年奥宝科技营收构成(分业务)
2014-2017 年奥宝科技营收构成(分区域)
2010-2018年奥宝科技研发支出、同比增长及其占营业收入比例
2010-2018年奥宝科技毛利、同比增长及毛利率
奥宝科技主要产品及其竞争者(分行业)
2010-2017年奥宝科技主要产品安装量
奥宝科技核心市场的新技术
奥宝科技应用于PCB行业检测的AOI
奥宝科技应用于FPD行业检测的AOI
2010-2017年奥宝科技来自中国的收入、同比增长及其占总营业收入比例
2009-2018年康代营业收入及净利润
2015-2017年康代营收构成(分区域)
2009-2018年康代毛利、同比增长及毛利率
2009-2018年康代研发支出、同比增长及其占营业收入比例
Camtek康代半导体领域主要客户
Eagle系列AOI产品
Condor系列AOI产品
Gannet系列AOI产品
Falcon系列AOI产品
Phoenix系列AOI产品
Dragon系列AOI产品
Orion系列AOI产品
LAM系列AOI产品
康代主要子公司
2011-2018财年KLA-Tencor营业收入及净利润
2014-2018财年KLA-Tencor营收构成(分业务)
2015-2017财年KLA-Tencor营收构成(分区域)
2013-2018财年 KLA-Tencor研发支出及其占营业收入比例
KLA-Tencor主要产品
KLA-Tencor主要客户
欧姆龙集团员工结构
2009-2017财年欧姆龙营业收入及净利润
2010-2017财年欧姆龙营收构成(分业务)
2009-2017财年欧姆龙营收构成(分区域)
2009-2017 财年欧姆龙毛利、同比增长及毛利率
2009-2017财年欧姆龙研发支出、同比增长及其占营业收入比例
2013-2018财年欧姆龙工业自动化控制事业营业收入及营业利润
2010-2017财年欧姆龙工业自动化控制事业营收构成(分区域)
2010-2015财年欧姆龙工业自动化控制事业研发支出、同比增长及其占该部门收入比例
欧姆龙光学检测设备主要产品
2010-2018财年欧姆龙大中华地区销售收入
高永技术事业成长模型
2009-2017年高永技术营业收入及同比增长
2016-2017年高永技术分区域销售收入
2012-2017年高永技术毛利、同比增长及毛利率
2013-2017年高永技术研发支出及其占营业收入比例
高永技术SMI解决方案
高永技术半导体解决方案
2010-2018财年网屏营业收入及同比增长
2011-2018财年网屏营收构成(分部门)
2011-2018财年网屏营收构成(分区域)
2010-2018财年网屏旗下媒体与精密技术公司营收构成
2010-2018财年网屏研发支出、同比增长及其占营业收入比例
2013-2017财年网屏持有的专利数量
网屏集团主要AOI设备
2010-2019财年网屏PCB相关装备收入及同比增长
2013-2018财年网屏GP中国收入
2009-2017年HB Technology营业收入及同比增长
2015-2017年HB Technology营收构成(分产品及销售渠道)
2010-2017 年HB Technology毛利、同比增长及毛利率
2010-2017年HB Technology研发支出及其占营业收入比例
2013-2017年HB Technology AOI产能
2010-2017年HB Technology AOI产品产量及平均销售价格
HB主要AOI产品
2010-2017年德律科技营业收入及净利润
2011-2016年德律科技营收构成(分产品)
2010-2017年德律科技营收构成(分区域)
2010-2017年德律科技毛利、同比增长及毛利率
2010-2017年德律科技研发支出、同比增长及其占营业收入比例
2011-2015年德律科技主要产能及产量
2010-2015年德律科技主要产品销量
德律科技主要产品型号及其适用领域
TRI主要3D SPI AOI 产品
TRI主要AXI产品
德律科技全球网点分布
2010-2017年由田新技营业收入及净利润
2010-2017年由田新技营收构成(分产品)
2010-2017年由田新技营收构成(分区域)
2010-2017年由田新技毛利、同比增长及毛利率
2010-2017年由田科技研发支出、同比增长及其占营业收入比例
2016年由田新技主要研发成果
2015-2016年由田新技主要产品产量及产值
2015-2016年由田新技主要产品销量
2009-2015年由田新技主要产品销售额
由田新技光学检测设备主要产品及功能
PCB AVI主要性能指标
FPD AOI主要产品
Touch Panel AOI主要产品
其他AOI产品
由田新技短期发展计划
由田新技长期发展计划
美德客应用于PCB 的AOI
美德客应用于LED的AOI
2012-2017年赛凯推出的AOI新产品
赛凯主要2D AOI设备
赛凯主要3D AOI/SPI设备
赛凯主要AXI产品
赛凯全球公司及分销商分布
赛凯在中国的分销商
2010-2018年劲拓股份营业收入及同比增长
2016-2017年劲拓股份营收构成(分产品)
2011-2017年劲拓股份营收构成(分区域)
2011-2017年劲拓股份毛利率(分产品)
2011-2017年劲拓股份研发支出、同比增长及其占营业收入比例
2009-2015年劲拓股份AOI设备发展历程
2010-2017年劲拓股份AOI设备收入及同比增长
2015-2022年劲拓股份营业收入及净利润预测
2010-2017年星河科技营业收入及净利润
2014-2016年星河科技分产品营业收入
2010-2017年星河科技毛利率
2010-2017年星河科技研发支出及其占营业收入比例
神州视觉主要AOI产品
神州视觉主要客户
矩子智能主要AOI产品
易科讯主要AOI产品
易科讯主要客户
振华兴科技主要AOI产品
振华兴新AOI产品
振华兴科技主要客户
振华兴科技销售网络
欧威科技主要AOI产品
欧威科技主要客户
明富自动化主要AOI产品
明富自动化主要客户
2014-2017年中导光电收入及净利润
2016-2017年中导光电收入结构(分产品)
2017年3i System前五大供应商及采购金额排名
中导光电平板显示AOI产品
中导光电平板显示屏AOI主要客户
中导光电光伏电池AOI主要客户
2017年3i System前五大客户及销售收入排名
IMPRESS Q系列AOI产品性能指标
IMPRESS Q+系列AOI产品性能指标
Classification of Optical Inspection Equipment
Composition of AOI System
Advantages of AOI Equipment
Related Technologies of AOI Equipment Industry
AOI Equipment Industry Chain
AOI Equipment Upstream Raw Materials Source Countries
AOI Application Industries and Test Items
SMT Process
AOI Equipment Application in SMT Production Line
AOI Application in Solar Cell Production Line
Policies on China AOI Industry, 2006-2017
Global AOI Market Size and YoY, 2015-2022E
Global AOI Market Size (by Applications), 2015-2022E
Major Global AOI Manufacturers and Their AOI Revenue, 2015-2017
A Comparison of the Advantages and Disadvantages of Foreign and Chinese AOI Equipment Manufacturers
China's AOI Market Size, 2015-2022E
Major AOI Demanding Fields in China, 2017
Market Size of Major AOI Demanding Fields in China, 2015-2022E
Market Share of Major AOI Manufacturers in China, 2017
Major Chinese AOI Manufacturers and Their AOI Revenue
PCB Industry Chain
Application of AOI in PCB Industry
Global PCB Output Value and YoY, 2015-2022E
Global PCB Output Value by Market Segments, 2016-2022E
Global PCB Output Value Structure (by Region), 2014-2021E
Mainland China’s PCB Output Value and YoY, 2015-2022E
Global PCB Test Applied AOI Market Size and YoY, 2015-2022E
China’s PCB Test Applied AOI Market Size and YoY, 2014-2022E
Application of AOI in TFT-LCD Production Line
Main Inspection Equipment of TFT-LCD Production Process
Global Large Size TFT-LCD Panel Shipments and YoY, 2015-2022E
Global Large Size TFT-LCD Panel Shipments by Applications, 2016-2022E
Market Size and YoY of AOI Applied in FPD Test Worldwide, 2015-2022E
Market Size of AOI Applied in FPD Test in China, 2015-2022E
Application of AOI in Wafer Manufacturing
Application of AOI in Wafer Probing
Application of AOI in IC Packaging
Application of AOI in IC Testing
Global Semiconductor Industry Sales and YoY, 2015-2022E
Global Semiconductor Industry Sales Structure (by Product), 2015-2022E
Global Semiconductor Industry Sales Structure (by Region), 2015-2022E
Revenue of Global Top 10 Semiconductor Suppliers, 2016-2017
Global IC Industry Sales and YoY, 2015-2022E
China’s IC Industry Sales and YoY, 2010-2017
China’s IC Industry Sales as a Percentage of the World’s, 2011-2017
Global Semiconductor Equipment Sales (by Region), 2015-2022E
Global Semiconductor Process Control Equipment Market Size, 2015-2022E
Calculation Table of China’s Semiconductor Process Control Equipment Market Size, 2015-2022E
Calculation Table of China’s Semiconductor AOI Market Size, 2015-2022E
Orbotech’s Revenue and Net Income, 2009-2018
Orbotech’s Revenue Breakdown (by Business), 2014-2018
Orbotech’s Revenue Breakdown (by Region), 2014-2017
Orbotech’s R&D Expenses, YoY, and % of Total Revenue, 2010-2018
Orbotech’s Gross Profit, YoY, and Gross Margin, 2010-2018
Orbotech’s Main Products and Its Competitors (by Industry)
Installs of Orbotech’s Main Products, 2010-2017
New Technologies of Orbotech’s Core Markets
Orbotech’s AOIs Applied in PCB Test
Orbotech’s AOIs Applied in FPC Test
Orbotech’s Revenue from China, YoY, and % of Total Revenue, 2010-2017
Camtek’s Revenue and Net Income, 2009-2018
Camtek’s Revenue Breakdown (by Region), 2015-2017
Camtek’s Gross Profit, YoY, and Gross Margin, 2009-2018
Camtek’s R&D Expenses, YoY, and % of Total Revenue, 2009-2018
Camtek’s Major Customers in Semiconductor Field
Camtek’s Major AOI Product in Semiconductor Field
Eagle Series AOI Products
Condor Series AOI Products
Gannet Series AOI Products
Falcon Series AOI Products
Phoenix Series AOI Products
Dragon Series AOI Products
Orion Series AOI Products
LAM Series AOI Products
Major Subsidiaries of Camtek
KLA-Tencor’s Revenue and Net Income, FY2011-FY2018
KLA-Tencor’s Revenue Breakdown (by Business), FY2014-FY2018
KLA-Tencor’s Revenue Breakdown (by Region), FY2015-FY2017
KLA-Tencor’s R&D Expenses and % of Total Revenue, FY2013-FY2018
Main Products of KLA-Tencor
KLA-Tencor’s Major Customers
Staff Structure of Omron
Omron’s Revenue and Net Income, FY2009-FY2017
Omron’s Revenue Breakdown (by Business), FY2010-FY2017
Omron’s Revenue Breakdown (by Region), FY2009-FY2017
Omron’s Gross Profit, YoY, and Gross Margin, FY2009-FY2017
Omron’s R&D Expenses, YoY, and % of Total Revenue, FY2009-FY2017
OMRON Industrial Automation’s Revenue and Operating Income, FY2013-FY2018E
OMRON Industrial Automation’s Revenue Breakdown (by Region), FY2010-FY2017
OMRON Industrial Automation’s R&D Expenses, YoY, and % of the Department’s Revenue, FY2010-FY2015
Main AOI Products of Omron
Omron’s Sales in Greater China Region, FY2010-FY2018
KohYoung Technology’s Business Growth Model
KohYoung Technology’s Revenue and YoY, 2009-2017
Revenue Structure of KohYoung Technology by Region, 2016-2017
KohYoung Technology’s Gross Profit, YoY, and Gross Margin, 2012-2017
KohYoung Technology’s R&D Expenses and % of Total Revenue, 2013-2017
KohYoung Technology’s SMI Solutions
KohYoung Technology’s Semiconductor Solutions
Screen’s Revenue and YoY, FY2010-FY2018
Screen’s Revenue Breakdown (by Business Unit), FY2011-FY2018
Screen’s Revenue Breakdown (by Region), FY2011-FY2018
Revenue Structure of Screen Media and Precision Technology Company, FY2010-FY2018
Screen’s R&D Expenditure, YoY, and % of Total Revenue, FY2010-FY2018
Number of Patents Held by Screen, FY2013-FY2017
Screen’s Main AOI Equipment
Screen’s PCB Related Equipment Revenue and YoY, FY2010-FY2019E
Revenue of Screen GP China, FY2013-FY2018
HB Technology’s Revenue and YoY, 2009-2017
HB Technology’s Revenue Breakdown (by Product & Marketing Channel), 2015-2017
HB Technology’s Gross Profit, YoY, and Gross Margin, 2010-2017
HB Technology’s R&D Expenses and % of Total Revenue, 2010-2017
HB Technology’s AOI Capacity, 2013-2017
Output and Average Selling Price of HB Technology’s AOI Products, 2010-2017
HB’s Main AOI Products
TRI’s Revenue and Net Income, 2010-2017
TRI’s Revenue Breakdown (by Product), 2011-2016
TRI’s Revenue Breakdown (by Region), 2010-2017
TRI’s Gross Profit, YoY, and Gross Margin, 2010-2017
TRI’s R&D Expenses, YoY, and % of Total Revenue, 2010-2017
Capacity and Output of TRI’s Main Products, 2011-2015
Sales Volume of TRI’s Main Products, 2010-2015
TRI’s Main Product Models and Their Applications
Main 3D SPI AOI Products of TRI
Main AXI Products of TRI
Global Network Distribution of TRI
Utechzone’s Revenue and Net Income, 2010-2017
Utechzone’s Revenue Breakdown (by Product), 2010-2017
Utechzone’s Revenue Breakdown (by Region), 2010-2017
Utechzone’s Gross Profit, YoY, and Gross Margin, 2010-2017
Utechzone’s R&D Expenses, YoY, and % of Total Revenue, 2010-2017
R&D Results of Utechzone, 2016
Output and Output Value of Utechzone’s Main Products, 2015-2016
Sales Volume of Utechzone’s Main Products, 2015-2016
Sales of Utechzone’s Main Products, 2012-2015
Main Products and Functions of Utechzone’s Optical Inspection Equipment
Main Performance Index of PCB AVI
Main Products of FPD AOI
Main Products of Touch Panel AOI
Other AOI Products
Short-term Development Plan of Utechzone
Long-term Development Plan of Utechzone
Mirtec’s AOIs Applied in SMT
Mirtec’s AOIs Applied in LED
SAKI’s Newly Launched Products, 2012-2017
SAKI’s Main 2D AOI Equipment
SAKI’s Main 3D AOI/SPI Equipment
SAKI’s Main AXI Products
Distribution of SAKI’s Companies and Distributors Worldwide
SAKI’s Distributors in China
JT Automation Equipment’s Revenue and YoY, 2010-2018
JT Automation Equipment’s Revenue Breakdown (by Product), 2016-2017
JT Automation Equipment's Revenue Breakdown (by Region), 2011-2017
JT Automation Equipment's Gross Margin (by Product), 2011-2017
JT Automation Equipment’s R&D Expenses, YoY, and % of Total Revenue, 2011-2017
Development History of JT Automation Equipment’s AOI Equipment, 2009-2015
Revenue and YoY of JT Automation Equipment’s AOI Equipment, 2010-2017
Automation Equipment’s Revenue and Net Income, 2015-2022E
Star River Comtes’ Revenue and Net Income, 2010-2017
Star River Comtes’ Revenue Breakdown by Product, 2014-2016
Star River Comtes’ Gross Margin , 2010-2017 (%)
Star River Comtes’ R&D Expenses and % of Total Revenue, 2010-2017
Main AOI Products of ALeader
Main Customers of ALeader
Main AOI Products of Jutze Intelligence
Main AOI Products of ekt-Tech
Main Customers of ekt-Tech
Main AOI Products of ZhenHuaXing Technology
New AOI Products of ZhenHuaXing Technology
Main Customers of ZhenHuaXing Technology
Sales Network of ZhenHuaXing Technology
Main AOI Products of Ovi Technology
Main Customers of Ovi Technology
Main AOI Products of Mingfu Automation
Main Customers of Mingfu Automation
3i Systems’ Revenue and Net Income, 2014-2017
Revenue Structure of 3i Systems’ by Product, 2016-2017
3i Systems’ Procurement from Top 5 Suppliers, 2017
Main Flat Display AOI Products of 3i Systems
3i Systems Display Panel AOI Customers
3i Systems PV Cell AOI Customers
3i Systems’ Revenue from Top 5 Customers, 2017
Performance Indicators of IMPRESS Q Series AOI Products
Performance Indicators of IMPRESS Q+ Series AOI Product
如果这份报告不能满足您的要求,我们还可以为您定制报告,请 留言说明您的详细需求。
|