|
|
|
报告导航:研究报告—
制造业—工业机械
|
|
2018-2022年全球及中国工业激光器行业研究报告 |
 |
字数:5.0万 |
页数:164 |
图表数:220 |
|
中文电子版:12000元 |
中文纸版:6000元 |
中文(电子+纸)版:12500元 |
|
英文电子版:3400美元 |
英文纸版:3600美元 |
英文(电子+纸)版:3700美元 |
|
编号:ZHP073
|
发布日期:2018-06 |
附件:下载 |
 |
|
|
工业激光器在整个激光产业链中占据重要地位,占激光设备成本的30%左右。2017年工业激光器市场发展特点如下:
一、市场规模快速增长:2017年全球工业激光器市场规模为43.1亿美元,同比大幅增长26.1%,主要得益于新型工业激光器业务的快速发展;预计2018-2022年的年均复合增长率在7.0%左右。其中,中国2017年工业激光器市场规模为45亿元(约6.7亿美元,美元兑人民币汇率1:6.75),同比增长11.0%,全球占比15.5%。近两年中国不断突破工业激光器技术壁垒,预计2018-2022年的市场增速可维持在10.0%以上。
二、新型工业激光器挤压传统工业激光器市场份额:2017年全球光纤激光器、二极管/准分子激光器市场增速均在30%以上。其中二极管/准分子激光器受手机显示屏应用的驱动,市场增速高达56%。而高功率光纤激光器在金属切割领域的应用挤压了传统CO2激光器的市场份额,使得CO2激光器2017年市场规模同比减少14%。
三、中国工业激光器制造商生产研发能力不断提高:2013年以来,中国本土生产商相继研发1万瓦光纤激光器、1.2万瓦光纤激光器、2万瓦光纤激光器等产品,逐步实现进口替代。
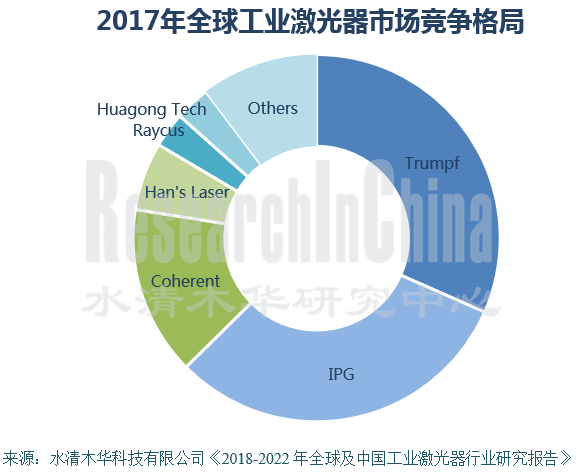
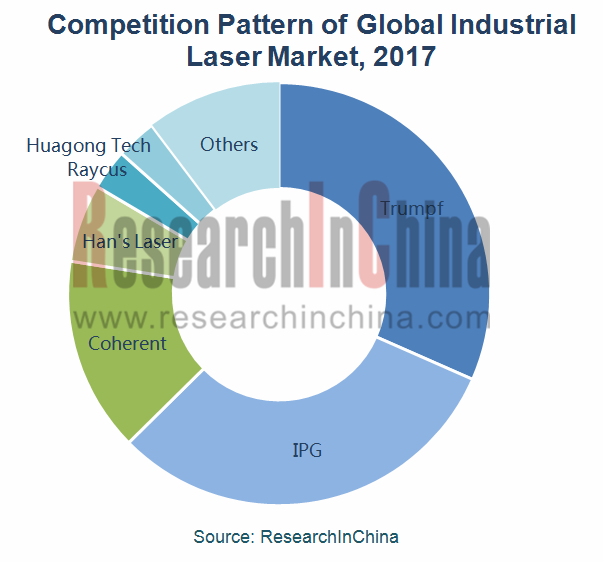
竞争格局方面:全球工业激光器市场格局相对稳定,主要制造商包括德国的Trumpf,美国的Coherent、IPG,中国的大族激光、华工科技、武汉锐科等。2017年全球前五大制造商的市场份额占比合计超过80.0%。其中Trumpf和IPG的市场份额均超过30%,而中国最大的大族激光的全球份额仅为6%。各大企业通过兼并重组等方式不断提高市场竞争力,全球工业激光器市场将出现大者恒强的局面。
市场应用方面:工业激光器主要应用在材料加工、微加工及打标领域。其中材料加工是工业激光器最大的应用领域,2017年(全球)应用占比为53.4%;受钣金切割市场增长的带动,预计2022年市场占比可增长至57.0%。而打标则是市场占比最小且增速最慢的应用领域,2017年(全球)市场增速为7.3%,主要受UID标记、二维数据矩阵码,ID卡的新型应用市场的带动。
水清木华研究中心《2018-2022年全球及中国工业激光器行业研究报告》着重研究了以下内容:
 工业激光器的分类、技术现状、产业链等情况; 工业激光器的分类、技术现状、产业链等情况;
全球工业激光器发展环境、市场规模、市场结构、应用现状、竞争格局、发展趋势等情况;
中国工业激光器发展环境、发展现状、市场规模、市场结构、进出口、竞争格局、市场价格、发展趋势等情况;
工业激光器细分产品(CO2激光器、固体激光器、光纤激光器、半导体激光器、紫外激光器等)市场规模、市场结构、竞争格局等情况;
上游(增益介质、泵浦源等)市场现状;下游激光加工设备市场规模、主要企业、细分市场现状、应用现状等情况;
国外10家、中国13家工业激光器制造商的经营情况、工业激光器业务等情况。
Industrial laser, playing a key role in the laser industry chain, makes up roughly 30% of laser equipment cost. The industrial laser market in 2017 is featured as follows:
1. Rapid market expansion: global industrial laser market was USD4.31 billion in 2017, a year-on-year surge of 26.1%, largely thanks to a boom in new industrial laser business, and is expected to maintain a CAGR of about 7.0% between 2018 and 2022. Specifically, the Chinese industrial laser market was RMB4.5 billion (USD670 million by an exchange rate of 1:6.75), up 11.0% from a year ago and accounting for 15.5% of the global market, and is predicted to sustain a growth rate of over 10.0% during 2018-2022, as the country has broken technical barriers of industrial laser in recent two years.
2. Higher market share of new industrial lasers: global fiber laser and diode/ excimer laser markets grew by over 30% in 2017. The diode/ excimer laser market expanded by up to 56%, being spurred by its use for phone display. The application of high-power fiber laser in metal cutting squeezed the market share of conventional CO2 laser whose market size contracted by 14% in 2017.
3. Enhanced production and R&D capabilities of Chinese industrial laser manufacturers: local Chinese producers have developed 10,000W fiber laser, 12,000W fiber laser and 20,000W fiber laser successively since 2013, realizing import substitution in a progressive way.
Competitive landscape: Global industrial laser market pattern has remained stable, occupied primarily by Trumpf, Coherent, IPG, Han’s Laser, Huagong Tech and Wuhan Raycus Fiber Laser Technologies. Global top5 manufacturers held a combined market share of over 80.0% in 2017. To be specific, Trumpf and IPG each seized more than 30%, while Han’s Laser, the largest one in China, shared only 6%. Companies continue to enhance market competitiveness through mergers and reorganization, finally leading to a pattern of the bigger ones getting stronger.
As for application, industrial laser is mostly used in material processing, micro-machining and marking, of which material processing is the largest applied field of industrial laser, with a 53.4% share in global market in 2017, a figure projected to climb to 57.0% in 2022 driven by sheet metal cutting market growth; industrial laser applied in marking has the lowest share and grows at the slowest rate, and it grew 7.3% worldwide in 2017, being primarily incentivized by new applied markets including unique identifier (UID), 2D data matrix code and ID card.
Global and China Industrial Laser Industry Report, 2018-2022 highlights the following:
 Industrial laser (classification, technical status, industry chain, etc.); Industrial laser (classification, technical status, industry chain, etc.);
Global industrial laser industry (development environment, market size, market structure, application status, competitive landscape, development tendency, etc.);
China industrial laser industry (development environment, status quo, market size, market structure, import and export, competitive pattern, market price, development trend, etc.)
Industrial laser market segments, e.g., CO2 laser, solid-state laser, fiber laser, semiconductor laser, UV laser (market size, market structure, competitive pattern, etc.);
Upstream markets (gain medium, pump source, etc.); downstream laser processing equipment market (market size, major companies, market segment, applications, etc.);
10 foreign and 13 Chinese industrial laser manufacturers (operation, industrial laser business, etc.).
第一章 工业激光器行业概述
1.1 简介
1.2 分类
1.3 技术现状
1.4 产业链
第二章 全球工业激光器产业现状
2.1 激光产业
2.1.1 市场规模
2.1.2 产业格局
2.2 市场规模及结构
2.2.1 市场规模
2.2.2 市场结构
2.3 应用现状
2.3.1 材料加工
2.3.2 激光微加工
2.3.3 打标机
2.4 竞争格局
2.5 发展趋势
第三章 中国工业激光器产业现状
3.1 发展环境
3.1.1 政策环境
3.1.2 产业环境
3.2 发展现状
3.3 市场规模
3.4 市场结构
3.5 进出口
3.5.1 出口
3.5.2 进口
3.6 竞争格局
3.7 市场价格
3.8 发展趋势
第四章 工业激光器细分市场
4.1 CO2激光器
4.1.1 概述
4.1.2 市场规模
4.1.3 应用现状
4.1.4 竞争格局
4.2 固体激光器
4.2.1 概述
4.2.2 市场规模
4.2.3 应用结构
4.2.4 竞争格局
4.3 光纤激光器
4.3.1 概述
4.3.2 市场规模
4.3.3 市场结构
4.3.4 市场价格
4.3.5 竞争格局
4.4 其他
4.4.1 半导体激光器
4.4.2 皮秒激光器
4.4.3 紫外激光器
第五章 上游产业
5.1 增益介质
5.1.1 二氧化碳
5.1.2 光纤
5.1.3 晶体材料
5.2 泵浦源
第六章 激光加工设备市场
6.1 市场规模
6.2 重点企业
6.2.1 全球
6.2.2 中国
6.3 细分市场
6.3.1 激光切割设备
6.3.2 激光焊接设备
6.3.3 激光标记设备
6.3.4 激光雕刻设备
6.4 应用领域
第七章 国外主要工业激光器制造商
7.1 通快
7.1.1 公司简介
7.1.2 经营情况
7.1.3 工业激光器业务
7.1.4 在华布局
7.2 Coherent
7.2.1 公司简介
7.2.2 经营情况
7.2.3 工业激光器业务
7.2.4 在华布局
7.3 IPG
7.3.1 公司简介
7.3.2 经营情况
7.3.3 工业激光器业务
7.3.4 在华布局
7.4 Prima
7.4.1 公司简介
7.4.2 经营情况
7.4.3 工业激光器业务
7.4.4 在华发展
7.5 其他企业
7.5.1 Novanta(GSI集团)
7.5.2 Nufern
7.5.3 NKT Photonics
7.5.4 IMRA
7.5.5 Bystronic
7.5.6 大通激光
第八章 中国主要工业激光器制造商
8.1 大族激光
8.1.1 公司简介
8.1.2 经营情况
8.1.3 工业激光器业务
8.1.4 发展战略
8.2 华工科技
8.2.1 公司简介
8.2.2 经营情况
8.2.3 工业激光器业务
8.2.4 发展战略
8.3 大恒科技
8.3.1 公司简介
8.3.2 经营情况
8.3.3 工业激光器业务
8.4 天弘激光
8.4.1 公司简介
8.4.2 经营情况
8.4.3 主要客户及供应商
8.4.4 工业激光器业务
8.4.5 发展战略
8.5 金运激光
8.5.1 公司简介
8.5.2 经营情况
8.5.3 工业激光器业务
8.5.4 发展战略
8.6 新松
8.6.1 公司简介
8.6.2 经营情况
8.6.3 工业激光器业务
8.7 创鑫激光
8.7.1 公司简介
8.7.2 工业激光器业务
8.7.3 发展战略
8.8 武汉锐科
8.8.1 公司简介
8.8.2 经营情况
8.8.3 发展战略
8.9 武汉光谷科威晶
8.9.1 公司简介
8.9.2 经营情况
8.9.3 工业激光器业务
8.10 其他企业
8.10.1 中科中美
8.10.2 国科激光
8.10.3 西安中科梅曼
8.10.4 天元激光
1. Overview of Industrial Laser
1.1 Introduction
1.2 Classification
1.3 Technical Status
1.4 Industrial Chain
2. Global Industrial Laser Industry
2.1 Laser Industry
2.1.1 Market Size
2.1.2 Industrial Pattern
2.2 Industrial Laser Market Size and Structure
2.2.1 Market Size
2.2.2 Market Structure
2.3 Application
2.3.1 Material Processing
2.3.2 Laser Micro-processing
2.3.3 Marking Machine
2.4 Competitive Landscape
2.5 Trends
3. China Industrial Laser Industry
3.1 Development Environment
3.1.1 Policy Environment
3.1.2 Industrial Environment
3.2 Development Status
3.3 Market Size
3.4 Market Structure
3.5 Import and Export
3.5.1 Export
3.5.2 Import
3.6 Competitive Landscape
3.7 Market Price
3.8 Trends
4. Industrial Laser Market Segments
4.1 CO2 Laser
4.1.1 Overview
4.1.2 Market Size
4.1.3 Application
4.1.4 Competitive Landscape
4.2 Solid-state Laser
4.2.1 Overview
4.2.2 Market Size
4.2.3 Application
4.2.4 Competitive Landscape
4.3 Fiber Laser
4.3.1 Overview
4.3.2 Market Size
4.3.3 Market Structure
4.3.4 Market Price
4.3.5 Competitive Landscape
4.4 Others
4.4.1 Semiconductor Laser
4.4.2 Picosecond Laser
4.4.3 UV Laser
5. Upstream Industries
5.1 Gain Medium
5.1.1 Carbon Dioxide
5.1.2 Optical Fiber
5.1.3 Crystal Material
5.2 Pumping Source
6. Laser Processing Equipment Market
6.1 Market Size
6.2 Key Enterprises
6.2.1 Global
6.2.2 China
6.3 Market Segments
6.3.1 Laser Cutting Equipment
6.3.2 Laser Welding Equipment
6.3.3 Laser Marking Equipment
6.3.4 Laser Engraving Equipment
6.4 Applied Fields
7. Main Foreign Industrial Laser Manufacturers
7.1 TRUMPF
7.1.1 Profile
7.1.2 Operation
7.1.3 Industrial Laser Business
7.1.4 Layout in China
7.2 Coherent
7.2.1 Profile
7.2.2 Operation
7.2.3 Industrial Laser Business
7.2.4 Layout in China
7.3 IPG
7.3.1 Profile
7.3.2 Operation
7.3.3 Industrial Laser Business
7.3.4 Layout in China
7.4 Prima
7.4.1 Profile
7.4.2 Operation
7.4.3 Industrial Laser Business
7.4.4 Development in China
7.5 Others
7.5.1 Novanta (GSI)
7.5.2 Nufern
7.5.3 NKT Photonics
7.5.4 IMRA
7.5.5 Bystronic
7.5.6 Access Laser
8. Major Chinese Industrial Laser Manufacturers
8.1 Han’s Laser
8.1.1 Profile
8.1.2 Operation
8.1.3 Industrial Laser Business
8.1.4 Development Strategy
8.2 Huagong Tech
8.2.1 Profile
8.2.2 Operation
8.2.3 Industrial Laser Business
8.2.4 Development Strategy
8.3 Daheng New Epoch Technology
8.3.1 Profile
8.3.2 Operation
8.3.3 Industrial Laser Business
8.4 Suzhou Tianhong Laser
8.4.1 Profile
8.4.2 Operation
8.4.3 Main Customers and Suppliers
8.4.4 Industrial Laser Business
8.4.5 Development Strategy
8.5 Wuhan Golden Laser
8.5.1 Profile
8.5.2 Operation
8.5.3 Industrial Laser Business
8.5.4 Development Strategy
8.6 SIASUN
8.6.1 Profile
8.6.2 Operation
8.6.3 Industrial Laser Business
8.7 Maxphotonics
8.7.1 Profile
8.7.2 Industrial Laser Business
8.7.3 Development Strategy
8.8 Wuhan Raycus Fiber Laser Technologies
8.8.1 Profile
8.8.2 Operation
8.8.3 Development Strategy
8.9 Wuhan Co-Walking Laser Tech.
8.9.1 Profile
8.9.2 Operation
8.9.3 Industrial Laser Business
8.10 Others
8.10.1 ZKZM
8.10.2 Beijing GK Laser Technology
8.10.3 Xi’an Sino-Meiman Laser Tech.
8.10.4 SkyEra Laser Technologies
图:激光器工作原理
图:激光器结构
表:激光器类型及适用领域
表:主要激光器性能对比
表:主要工业激光器所适用的加工工艺
表:工业激光器的分类
图:工业激光加工产业链
图:2017年全球激光系统应用结构
图:2012-2022年全球激光材料加工及光刻市场规模及增速
图:2017年全球激光产业格局
图:2014-2022年德国激光器市场规模
图:2013-2022年全球工业激光器市场规模(销售收入)及增速
图:2013-2022年全球工业激光器(分产品)销售收入构成
图:2017/2022年全球工业激光器(分功率)销售收入构成
图:2017年全球工业激光器(分领域)应用现状
图:2014-2022年全球材料加工用激光器销售收入及增速
图:2016-2022年全球材料加工用激光器(分领域)销售收入构成
图:2016-2022年全球材料加工用激光器(分产品)销售收入构成
图:2014-2022年激光微加工用激光器销售收入及增速
图:2016-2022年全球激光微加工用激光器(分领域)销售收入构成
图:2016-2022年全球激光微加工用激光器(分产品)销售收入构成
图:2014-2022年全球打标机用激光器销售收入及增速
图:2016-2022年全球打标机用激光器(分产品)销售收入构成
图:2017年全球工业激光器市场竞争格局
表:2015-2018年全球激光器行业并购事件
表:中国激光产业相关政策
图:2017年中国激光企业区域分布
图:2017年中国激光产值(分地区)构成
表:华东地区激光产业现状
表:华南地区激光产业现状
表:华中地区激光产业现状
表:东北/华北地区激光产业现状
表:西部地区激光产业现状
图:2014-2022年中国工业激光器销售收入及增速
图:2014-2022中国工业激光器销量及增速
图:2017年中国工业激光器(分领域)应用现状
图:2015-2022年中国工业激光器(分产品)销量构成
图:2009-2017年中国激光器贸易逆差
表:2017年中国激光器关税税率
表:2009-2017年中国激光器出口数量及金额
图:2016年中国激光器(分地区)出口量构成
图:2016年中国激光设备出口结构
表:2009-2017年中国激光器进口数量及金额
图:2016年中国激光器(分地区)进口量构成
图:2017年中国工业激光器市场竞争格局
图:2014-2022年中国主要工业激光器市场价格走势
图:2018年中国主要工业激光器产品价格
表:全球主要工业激光器产品应用现状与发展趋势
表:CO2激光器发展历程
图:2014-2022年全球工业用CO2激光器销售收入及增速
图:2014-2022年中国工业用CO2激光器销售收入及增速
图:2014-2022年中国工业用CO2激光器销量及增速
表:CO2激光器应用现状
图:CO2激光器价值链
图:固体激光器结构
图:2014-2022年全球工业用固体激光器销售收入及增速
图:2014-2022年中国工业用固体激光器销售收入及增速
图:2014-2022年中国工业用固体激光器销量及增速
图:2017年全球固体激光器应用结构
图:2017年全球年固体激光器需求比重
图:半导体泵浦固体激光器价值链
图:光纤激光器结构
图:2014-2022年全球工业用光纤激光器销售收入及增速
图:2014-2022年中国工业用光纤激光器销售收入及增速
图:2014-2022年中国工业用光纤激光器销量及增速
图:2017/2021年全球工业用光纤激光器(分地区)销售收入构成
图:2013-2018年中国工业用光纤激光器(分产品)销量构成
图:2016年中国工业用低功率光纤激光器销量结构
图:2016年中国工业用中功率光纤激光器销量结构
图:2016年中国工业用高功率光纤激光器销量结构
图:2013-2018年中国工业用光纤激光器(分应用领域)销量构成
图:2012/2017年进口IPG光纤激光器价格
图:2017年进口光纤激光器与国产光纤激光器价格对比
图:光纤激光器价值链
图:2017年全球光纤激光器市场竞争格局
表:半导体激光器分类
图:2014-2022年全球半导体激光器市场规模
图:直接半导体激光器价值链
表:纳秒、皮秒、飞秒激光加工性能的比较
表:皮秒激光与光纤激光的对比
图:2016年指纹识别领域皮秒激光切割设备市场竞争格局
图:2014-1018年指中国紫外激光器销量
图:激光器组成部件
图:2011-2022年全球二氧化碳产量
图:2016年全球二氧化碳(分地区)消费结构
图:2018年中国CO2企业装置开工率
图:2015-2017年中国CO2市场价格走势
图:2011-2022年中国光纤光缆行业销售收入及增速
表:2017年全球主要光纤光缆厂商产能
表:全球激光晶体材料发展历程
图:2010-2022年全球激光晶体市场规模
图:2016年全球激光晶体(分地区)市场规模构成
表:全球主要YAG激光晶体材料制造商
表:主要激光器泵浦方式
图:2008-2017年全球激光器占激光设备成本比重
图:2015-2022年全球激光加工设备销售收入及增速
图:2014-2022年中国激光加工设备销售收入及增速
表:全球主要综合类激光设备公司
图:2016年全球激光设备市场竞争格局
表:中国主要激光设备企业
图:2016年中国激光设备市场竞争格局
表:全球中小功率激光设备主要公司
表:激光设备在各行业的应用特点
图:2016/2021年中国激光加工设备市场结构
表:激光切割设备的优点
表:不同激光切割设备特点
表:光纤和二氧化碳激光切割质量对比
图:2014-2022年中国激光切割设备市场规模
图:2013-2016年中国大功率切割设备销量
表:2017年中国超高功率(≥10KW)激光切割机生产商
图:2016年中国大功率切割设备市场份额
图:2016年中国中小功率切割设备市场份额
图:激光焊接工作原理
图:2014-2022年中国激光焊接设备市场规模
图:2017年中国激光焊接设备市场结构
图:激光焊接在动力电池领域的应用
图:激光焊接在汽车上的应用
表:2013-2018年中国汽车板激光拼焊机国产化大事记
图:2016-2020年中国焊接机器人市场规模
图:2014-2022年中国激光标记设备市场规模
表:激光打标与传统赋码的对比
表:激光打标与热转印的对比
图:2014-2022年中国激光雕刻设备市场规模
图:2016年全球激光加工系统应用结构
图:2014-2018年中国激光加工设备(分应用领域)销售额
图:通快全球布局
图:通快全球子公司分布
图:FY2013-2017通快销售额
图:FY2016通快各部门销售额
图:FY2010-2017通快激光业务销售额
表:通快主要工业激光器产品
图:SPI主要客户
图:通快在华布局
表:通快在华公司及业务
图:Coherent全球布局
图:FY2015-2017相干营业收入
图:FY2015-2017相干EBITDA%
图:FY2014-2017相干经营指标
表:FY2015-2017相干营业收入(分部门)分布
图:FY2015-2017相干产品应用领域分布
表:Coherent主要激光器生产基地
表:Coherent主要激光器产品及应用
表:罗芬全球生产基地
表:Rofin-Sinar发展历程
图:Rofin-Sinar主要激光器产品
表:Rofin-Sinar激光器生产基地
图:2015-2017年IPG运营指标
表:2015-2017年IPG各地区营业收入及比重
表:2015-2017年IPG销售额分布(按应用领域分类)
图:截至2017年IPG兼并与重组大事记
图:2011-2017年IPG高功率激光器销售收入及占比
表:IPG产品线
图:IPG主要客户
图:2012-2017年IPG前5大客户收入及占比
图:IPG光纤激光器核心竞争力
图:2011-2017年IPG中国区销售收入及占比
图:普瑞玛业务部门
图:2014-2017年普瑞玛销售额
表:2016-2017年普瑞玛(分地区)营业收入
图:2016-2017年普瑞玛(分业务)营业收入及毛利率
图:Prima Power主要客户
表:2010-2017年NOVANTA销售额及毛利润
表:2015-2017年NOVANTA(分业务)销售额
表:2015-2017年NOVANTA(分业务)毛利润
表:NOVANTA激光产品线
表:2015-2017年NOVANTA主要国家/地区销售额
图:Nufern主要产品线
图:NKT Phoyonics主要激光器产品
图:Fianium主要激光器应用情况
表:2017年百超(分地区)营业额及员工分布
表:Bystronic主要产品
图:大通激光主要工业激光器产品
图:2018年大族激光股权结构
图:大族激光全球布局
图:2007-2017年大族激光营业收入及毛利率
表:2013-2017年大族激光(分产品)营业收入构成
图:2013-2017年大族激光(分地区)营业收入构成
图:2006-2017年大族激光不同功率激光器收入构成
表:大族激光工业激光器产业链优势
图:2018年华工科技股权结构
图:华工科技全球布局
图:2007-2017年华工科技营业收入及毛利率
图:2012-2017年华工科技(分产品)营业收入构成
图:2007-2017华工科技海外业务收入及毛利率
图:华工科技业务布局
图:2018年大恒科技股权结构
图:2010-2017年大恒科技营业收入及毛利率
图:2013-2017年大恒科技(分产品)营业收入构成
图:2010-2017年大恒科技(分地区)营业收入构成
图:大恒科技激光设备销售网络
表:大恒科技激光器配套
图:2017年天弘激光股权结构
图:2012-2017年天弘激光营业收入及毛利率
图:2013-2017年天弘激光(分产品)营业收入构成
图:2014-2017年天弘激光主要客户
图:2014-2017年天弘激光主要供应商
图:2018年金运激光股权结构
图:金运激光全球布局
图:2007-2017年金运激光营业收入和毛利率
图:2013-2017年金运激光(分产品)营业收入构成
图:2013-2017年金运激光(分地区)营业收入构成
表:金运激光主要激光器产品应用
图:2018年新松股权结构
图:2007-2017年新松营业收入及毛利率
图:2012-2017年新松(分产品)营业收入构成
图:2014-2017年新松(分地区)营业收入构成
图:新松激光业务格局
图:2017年创鑫激光股权结构
表:创鑫激光主要工业激光器产品及应用
图:2017年武汉锐科股权结构
图:2015-2017年武汉锐科营业收入及净利润
图:2015-2017年武汉锐科(分产品)营业收入构成
图:2015-2017年武汉锐科(分地区)营业收入构成
表:武汉锐科主要激光器产品
表:武汉锐科激光器研发历程
图:1997-2016年武汉锐科激光器公开专利数量
图:2017年武汉光谷科威晶股权结构
图:2007-2018年武汉光谷科威晶激光器销量
表:中科中美激光器主要参数
图:西安中科梅曼主要客户
Working Principle of Laser
Structure of Laser
Types and Applications of Laser
Performance Comparison of Main Lasers
Applicable Processing Technologies of Major Industrial Lasers
Classification of Industrial Laser
Industrial Laser Processing Industry Chain
Application Structure of Global Laser System, 2017
Market Size and YoY Growth of Global Laser Materials Processing and Lithography, 2012-2022E
Global Laser Industry Pattern, 2017
Germany’s Laser Market Size, 2014-2022E
Global Industrial Laser Market Size and YoY Growth by Sales, 2013-2022E
Sales Structure of Global Industrial Laser by Product, 2013-2022E
Sales Structure of Global Industrial Laser by Power, 2017/2022E
Applications of Global Industrial Laser, 2017
Sales and YoY Growth of Global Material-processing Laser, 2014-2022E
Sales Structure of Global Material-processing Laser by Application, 2016-2022E
Sales Structure of Global Material-processing Laser by Product, 2016-2022E
Sales and YoY Growth of Global Micro-processing Laser, 2014-2022E
Sales Structure of Global Micro-processing Laser by Application, 2016-2022E
Sales Structure of Global Micro-processing Laser by Product, 2016-2022E
Sales and YoY Growth of Global Marking Machine-used Laser, 2014-2022E
Sales Structure of Global Marking Machine-used Laser by Product, 2016-2022E
Competitive Landscape of Global Industrial Laser Market, 2017
M&A Cases in Global Laser Industry, 2015-2018
Policies on Laser Industry in China
Regional Distribution of Laser Companies in China, 2017
Laser Output Value Structure in China by Region, 2017
Laser Industry in East China
Laser Industry in South China
Laser Industry in Central China
Laser Industry in Northeast/North China
Laser Industry in West China
Sales Revenue and YoY Growth of Industrial Laser in China, 2014-2022E
Sales Volume and YoY Growth of Industrial Laser in China, 2014-2022E
Application of Industrial Laser in China, 2017
Sales Volume Structure of Industrial Laser in China by Product, 2015-2022E
China’s Laser Trade Deficit, 2009-2017
China’s Laser Tariff, 2016
China’s Laser Export Volume and Value, 2009-2017
China’s Laser Export Volume Structure by Region, 2016
China’s Laser Equipment Export Structure, 2016
China’s Laser Import Volume and Value, 2009-2017
China’s Laser Import Volume Structure by Region, 2016
Competitive Pattern of Industrial Laser Market in China, 2017
Price Trend of Main Industrial Lasers in China, 2014-2022E
Prices of Main Industrial Lasers in China, 2018
Application and Development Trend of Main Industrial Lasers Worldwide
Development Course of CO2 Laser
Sales Revenue and YoY Growth of Global Industrial CO2 Laser, 2014-2022E
Sales Revenue and YoY Growth of Industrial CO2 Laser in China, 2014-2022E
Sales Volume and YoY Growth of Industrial CO2 Laser in China, 2014-2022E
Application of CO2 Laser
Value Chain of CO2 Laser
Structure of Solid State Laser
Sales Revenue and YoY Growth of Global Industrial Solid State Laser, 2014-2022E
Sales Revenue and YoY Growth of Industrial Solid State Laser in China, 2014-2022E
Sales Volume and YoY Growth of Industrial Solid State Laser in China, 2014-2022E
Application Structure of Solid State Laser, 2017
Demand Structure of Solid State Laser, 2017
Value Chain of Diode Pump Solid State Laser
Structure of Fiber Laser
Sales Revenue and YoY Growth of Global Industrial Fiber Laser, 2014-2022E
Sales Revenue and YoY Growth of Industrial Fiber Laser in China, 2014-2022E
Sales Volume and YoY Growth of Industrial Fiber Laser in China, 2014-2022E
Sales Structure of Global Industrial Fiber Laser by Region, 2017/2021E
Sales Structure of Industrial Fiber Laser in China by Product, 2013-2018
Sales Structure of Low-power Industrial Fiber Laser in China, 2016
Sales Structure of Medium-power Industrial Fiber Laser in China, 2016
Sales Structure of High-power Industrial Fiber Laser in China, 2016
Sales Structure of Industrial Fiber Laser in China by Application, 2013-2018
Price of Imported IPG Fiber Lasers, 2012/2017
Price Comparison between Imported Fiber Laser and Homemade Fiber Laser, 2017
Value Chain of Fiber Laser
Competitive Pattern of Global Fiber Laser Market, 2017
Classification of Semiconductor Laser
Global Semiconductor Laser Market Size, 2014-2022E
Value Chain of Direct Diode Laser
Processing Performance Comparison among Nanosecond, Picosecond and Femtosecond Lasers
Comparison between Picosecond Laser and Fiber Laser
Competitive Pattern of Picosecond Laser Cutting Equipment Market in Fingerprint Recognition Field, 2016
UV Laser Sales in China, 2014-1018
Components of Laser
Global CO2 Output, 2011-2022E
Global CO2 Consumption Structure by Region, 2016
Operating Rate of CO2 Facilities in China, 2018
CO2 Price Trend in China, 2015-2017
Sales Revenue and YoY Growth of Optical Fiber and Cable Industry in China, 2011-2022E
Capacity of Major Optical Fiber and Cable Manufacturers Worldwide, 2017
Development Course of Global Laser Crystals
Global Laser Crystal Market Size, 2010-2022E
Global Laser Crystal Market Size Structure by Region, 2016
Major YAG Laser Crystals Manufacturers Worldwide
Main Laser Pumping Methods
Laser Costs as a Percentage of Laser Equipment Costs Worldwide, 2008-2017
Sales Revenue and YoY Growth of Global Laser Processing Equipment, 2015-2022E
Sales Revenue and YoY Growth of Laser Processing Equipment in China, 2014-2022E
Major Comprehensive Laser Equipment Companies Worldwide
Competitive Pattern of Global Laser Equipment Market, 2016
Major Laser Equipment Companies in China
Competitive Pattern of Laser Equipment Market in China, 2016
Major Small and Medium Power Laser Equipment Companies Worldwide
Application Characteristics of Laser Equipment in Various Industries
China’s Laser Processing Equipment Market Structure, 2016/2021E
Merits of Laser Cutting Equipment
Characteristics of Different Laser Cutting Equipment
Cutting Quality Comparison between Fiber Laser and CO2 Laser
China’s Laser Cutting Equipment Market Size, 2014-2022E
Large-power Cutting Equipment Sales in China, 2013-2016
Ultrahigh Power (≥10KW) Laser Cutting Machine Manufacturers in China, 2017
Market Share of Large Power Cutting Equipment in China, 2016
Market Share of Small and Medium Power Cutting Equipment in China, 2016
Working Principle of Laser Welding
China’s Laser Welding Equipment Market Size, 2014-2022E
China’s Laser Welding Equipment Market Structure, 2017
Application of Laser Welding in Power Battery Field
Application of Laser Welding to Automotive
Milestones of Localization of Automotive Sheet Laser Welding Machines in China, 2013-2018
Welding Robot Market Size in China, 2016-2020E
China’s Laser Marking Equipment Market Size, 2014-2022E
Comparison between Laser Marking and Traditional Encoding
Comparison between Laser Marking and Heat Transfer Printing
China’s Laser Engraving Equipment Market Size, 2014-2022E
Application Structure of Global Laser Processing Systems, 2016
Laser Equipment Sales in China by Application, 2014-2018
Global Presence of Trumpf
Presence of TRUMPF’s Subsidiaries Worldwide
Trumpf’s Revenue, FY2013-FY2017
TRUMPF’s Revenue by Division, FY2016
TRUMPF’s Revenue from Laser Business, FY2010-FY2017
Main Industrial Lasers of Trumpf
Major Customers of SPI
Presence of Trumpf in China
TRUMPF’s Companies and Business in China
Global Presence of Coherent
Revenue of Coherent, FY2015-FY2017
EBITDA of Coherent, FY2015-FY2017
Operation Indices of Coherent, FY2014-FY2017
Coherent’s Revenue by Division, FY2015-FY2017
Application Structure of Coherent’s Products, FY2015-FY2017
Key Laser Production Bases of Coherent
Key Lasers and Applications of Coherent
Rofin’s Manufacturing Bases Worldwide
Development Course of Rofin-Sinar
Major Laser Products of Rofin-Sinar
Rofin-Sinar Laser Manufacturing Bases
IPG’s Operational Indicators, 2015-2017
IPG Revenue Structure by Region, 2015-2017
IPG’s Revenue Structure by Application, 2015-2017
IPG’s M&As as of 2017
IPG’s Sales Revenue from High-power Lasers and Proportion, 2011-2017
Product Lines of IPG
IPG’s Major Customers
IPG’s Revenue from Top 5 Clients and % of Total Revenue, 2012-2017
Core Competitiveness of IPG’s Optical Fiber Lasers
IPG’s Revenue in China and Proportion, 2011-2017
Business Segments of Prima
Prima’s Revenue, 2014-2017
Prima’s Revenue by Region, 2016-2017
Prima’s Revenue and Gross Margin by Business, 2016-2017
Major Customers of Prima Power
Novanta’s Revenue and Gross Profit, 2010-2017
Novanta’s Revenue by Business, 2015-2017
Novanta’s Gross Profit by Business, 2015-2017
Laser Product Lines of NOVANTA
Sales of NOVANTA by Country/Region, 2015-2017
Key Product Lines of Nufern
Key Lasers of NKT Phoyonics
Application of Fianium’s Main Lasers
Bystronic’s Turnover and Staff Distribution by Region, 2017
Bystronic’s Main Products
Key Industrial Lasers of Access Laser
Equity Structure of Han’s Laser, 2018
Global Presence of Han’s Laser
Revenue and Gross Margin of Han’s Laser, 2007-2017
Revenue Structure of Han’s Laser by Product, 2013-2017
Revenue Structure of Han’s Laser by Region, 2013-2017
Structure of Han’s Laser’s Revenue from Lasers of Different Power, 2006-2017
Superiority of Han’s Laser in Industrial Laser Industry Chain
Equity Structure of Huagong Tech, 2018
Global Presence of Huagong Tech
Revenue and Gross Margin of Huagong Tech, 2007-2017
Revenue Structure of Huagong Tech by Product, 2012-2017
Overseas Business Revenue and Gross Margin of Huagong Tech, 2007-2017
Equity Structure of Daheng New Epoch Technology, 2018
Revenue and Gross Margin of Daheng New Epoch Technology, 2010-2017
Revenue Structure of Daheng New Epoch Technology by Product, 2013-2017
Revenue Structure of Daheng New Epoch Technology by Region, 2010-2017
Laser Equipment Marketing Network of Daheng New Epoch Technology
Laser Supporting of Daheng New Epoch Technology
Equity Structure of Suzhou Tianhong Laser, 2017
Revenue and Gross Margin of Suzhou Tianhong Laser, 2012-2017
Revenue Structure of Suzhou Tianhong Laser by Product, 2013-2017
Major Customers of Suzhou Tianhong Laser, 2014-2017
Major Suppliers of Suzhou Tianhong Laser, 2014-2017
Equity Structure of Wuhan Golden Laser, 2018
Global Presence of Wuhan Golden Laser
Revenue and Gross Margin of Wuhan Golden Laser, 2007-2017
Revenue Structure of Wuhan Golden Laser by Product, 2013-2017
Revenue Structure of Wuhan Golden Laser by Region, 2013-2017
Application of Key Lasers of Wuhan Golden Laser
Equity Structure of Siasun, 2018
Revenue and Gross Margin of Siasun, 2007-2017
Revenue Structure of Siasun by Product, 2012-2017
Revenue Structure of Siasun by Region, 2014-2017
Business Structure of Siasun
Equity Structure of Maxphotonics, 2017
Key Industrial Lasers and Application of Maxphotonics
Equity Structure of Wuhan Raycus Fiber Laser Technologies, 2017
Revenue and Net Income of Wuhan Raycus, 2015-2017
Revenue Structure of Wuhan Raycus by Product, 2015-2017
Revenue Structure of Wuhan Raycus by Region, 2015-2017
Key Lasers of Wuhan Raycus Fiber Laser Technologies
Laser R&D History of Wuhan Raycus Fiber Laser Technologies
Quantity of Issued Patents of Wuhan Raycus Fiber Laser Technologies, 1997-2016
Equity Structure of Wuhan Co-Walking Laser Tech, 2017
Laser Sales Volume of Wuhan Co-Walking Laser Tech, 2007-2018
Key Parameters of ZKZM’s Lasers
Major Customers of Xi’an Sino-Meiman Laser Tech
如果这份报告不能满足您的要求,我们还可以为您定制报告,请 留言说明您的详细需求。
|