|
|
|
报告导航:研究报告—
制造业—工业机械
|
|
2018-2022年全球及中国碳纤维及碳纤维复合材料行业研究报告 |
 |
字数:6.3万 |
页数:184 |
图表数:213 |
|
中文电子版:12000元 |
中文纸版:6000元 |
中文(电子+纸)版:12500元 |
|
英文电子版:3400美元 |
英文纸版:3600美元 |
英文(电子+纸)版:3700美元 |
|
编号:ZHP074
|
发布日期:2018-07 |
附件:下载 |
 |
|
|
碳纤维作为新一代增强纤维,既拥有碳材料的固有本征特性,又兼具纺织纤维的柔软可加工性,是目前已大量生产的高性能纤维中具有最高的比强度和最高的比模量的纤维。
2017年,全球碳纤维需求量约8.42万吨,2012-2017年的年均复合增长率为12.7%;在新能源汽车、风电等市场需求的带动下,预计2018-2022年全球碳纤维需求量的年均增速维持在10.0%左右。其中中国2017年市场需求量为2.35万吨,全球占比27.9%,同比增长19.9%;预计2018年可达到2.63万吨,2022年可接近40.00万吨。
2017年在市场需求稳步增长的同时,全球主要碳纤维厂商纷纷提价,带动碳纤维市场规模同比增长14.2%,至24亿美元。碳纤维主要与粘合基材一起合成碳纤维复合材料,然后再投放市场,碳纤维与碳纤维复合材料的市场规模大概为1:10。2017年全球碳纤维复合材料市场规模约251亿美元,同比增长12.1%,预计2018年达到284亿美元,2022年可突破450亿美元。
碳纤维复合材料最先被应用在体育休闲、航空航天领域,20世纪才开始被应用在工业领域。但由于碳纤维使用成本较高,目前全球碳纤维复合材料主要应用带航空航天领域(2017年全球航空航天领域碳纤维需求占比约60%),作为飞机的结构材料,2018-2022年全球航空航天用碳纤维复合材料市场规模将保持9.0%以上的增长速度。而近年需求增长较快的则是汽车领域,2013-2017年全球汽车用碳纤维复合材料市场规模年均复合增长率为29.0%;在汽车轻量化与新能源汽车发展的带动下,2018-2022年市场规模增速将保持在30.0%以上。
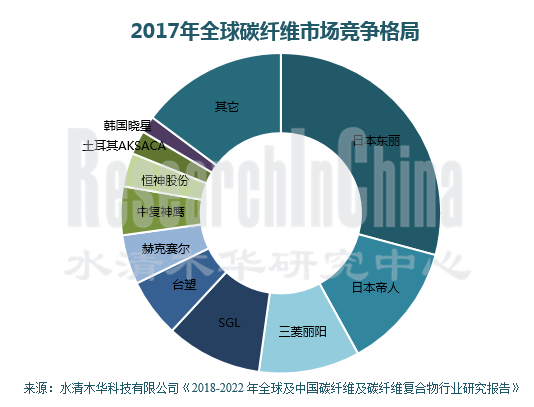
全球碳纤维市场格局稳定,规模较大的企业主要有日本东丽、日本帝人、日本三菱丽阳、美国 Hexcel(赫氏)、德国 SGL(西格里)、中国台塑等。2017年全球前5大厂商市场规模合计占比为67.8%。其中最大的是日本东丽,全球占比29.2%,中国最大的中复神鹰全球占比5.0%。
在细分产品方面,2017年大丝束碳纤维70%以上的市场份额由日本东丽和SGL占据;小丝束碳纤维50%以上的市场份额由日本东丽、日本帝人和三菱丽阳占据。由此可见日本生产商在碳纤维市场具有较强的市场竞争力。
由于生产工艺复杂、技术含量高,加之政治因素限制技术和设备等引进,中国碳纤维产业无论在生产技术还是生产规模方面,与外国都存在一定的差距。近年受政策支持,中国碳纤维产业快速发展,逐渐打破国外技术封锁,相继实现T300、T700及T800级碳纤维产业化。
水清木华研究中心《2018-2022年全球及中国碳纤维及碳纤维复合材料行业研究报告》着重研究了以下内容:
 碳纤维的分类、技术水平、产业链等情况; 碳纤维的分类、技术水平、产业链等情况;
全球碳纤维发展现状、供需现状、竞争格局、专利情况、价格、发展趋势等情况;
中国碳纤维政策环境、发展现状、供需现状、产业结构、进出口、竞争格局、市场价格、发展趋势等情况;
碳纤维复合材料市场规模、市场结构、成本结构、专利现状、竞争格局等情况;
上游(原丝)市场现状;下游(航空航天、汽车、风电、体育休闲等)市场规模、应用现状等情况;
国外11家、中国20家碳纤维及其复合材料制造商的经营情况、碳纤维业务等情况。
As a new generation of reinforced fiber boasting intrinsic properties of carbon material and excellent processability of textile fiber, carbon fiber is the one with the highest specific strength and specific modulus among mass-produced high-performance fibers.
The global demand for carbon fiber approximated 84.2 kt in 2017, showing a CAGR of 12.7% between 2012 and 2017. With the growing demand from such markets as new energy vehicle and wind power, the world’s demand for carbon fiber will grow at an annual average rate of 10.0% or so from 2018 to 2022. In 2017, the demand for carbon fiber in Chinese market reached 23.5 kt, soaring 19.9% from a year earlier and sharing 27.9% of global total, and the figure will rise to 26.3 kt in 2018 and close to 400 kt in 2022.
In 2017, the world-renowned carbon fiber producers raised prices successively in the wake of a steady growth in market demand, driving the carbon fiber market size to jump by 14.2% year on year and hit USD2.4 billion. Carbon fiber is primarily bonded with adhesive substrate into carbon fiber composites and then launched into the market. The market size of carbon fiber to that of carbon fiber composites stands at roughly 1:10. The global carbon fiber composites market was worth about USD25.1 billion in 2017, up 12.1% on an annualized basis, and the figure is expected to be USD28.4 billion in 2018 and more than USD45.0 billion in 2022.
Carbon fiber composites were first utilized in fields like sports & leisure, aviation and aerospace, and it did not get used in industrial fields until the 20th century. As carbon fiber has high cost of use, the carbon fiber composites mainly find application as a kind of structural material in the aviation and aerospace field currently around the globe (the global demand for carbon fiber from aviation and aerospace made up about 60% in 2017). During 2018-2022, the global market size of carbon fiber composites used in aviation and aerospace will maintain a growth rate of at least 9.0%. It is in recent years that the demand from automotive sector for carbon fiber is growing by leaps and bounds. The market size of carbon fiber composites used for cars presented a CAGR of 29.0% between 2013 and 2017, and is anticipated to keep a growth rate of above 30.0% from 2018 to 2022.
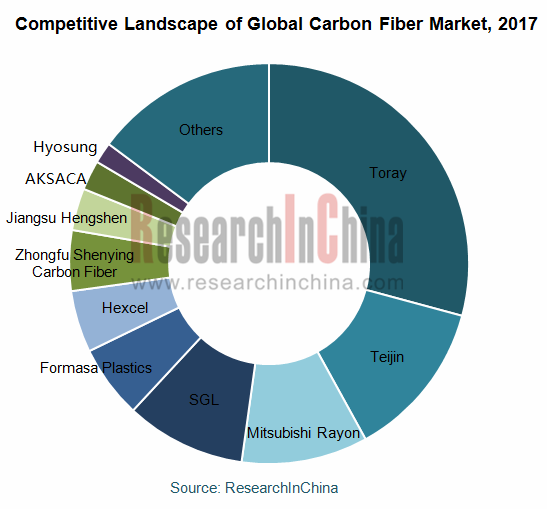
The global carbon fiber market remained stable, with key players consisting of Japanese Toray, Teijin, Mitsubishi Rayon, U.S. Hexcel, German SGL, and China’s Formosa Plastics. In 2017, the world’s top five giants had the combined market size as a percentage of 67.8%, of which Toray led the pack and held 29.2%. As concerns Chinese peers, Zhongfu Shenying Carbon Fiber, the biggest producer of carbon fiber in China, seized 5.0% shares worldwide.
As far as segmented products are concerned, in 2017, over 70% of large-tow carbon fiber market shares were firmly held by Toray and SGL, and more than 50% of small-tow carbon fiber market shares went to Toray, Teijin and Mitsubishi Rayon. It follows that Japanese vendors are quite competitive in the global carbon fiber market.
Due to sophisticated manufacturing process and high technical content as well as technical constraints and lack of equipment, Chinese carbon fiber industry is left behind overseas countries in terms of either technologies or production scale. Nevertheless, the carbon fiber industry is advancing aggressively with the policy support in China in recent years, with breakthroughs made in technologies and industrialization of T300, T700 and T800 carbon fiber successively brought into reality.
Global and China Carbon Fiber and CFRP Industry Report, 2018-2022 highlights the following:
 Carbon fiber (classification, level of technology, industry chain, etc.); Carbon fiber (classification, level of technology, industry chain, etc.);
Global carbon fiber market (status quo, supply & demand, competitive landscape, patents, prices, development trends, etc.);
Chinese carbon fiber market (policies, development status, supply & demand, industrial layout, import & export, competitive pattern, prices, development tendencies, etc.);
Carbon fiber composites market (size, structure, cost structure, patents, competition, etc.);
Upstream carbon fiber precursor and downstream (aviation & aerospace, automobile, wind power, sports & leisure, etc.) (market size, applications, etc.);
11 foreign and 20 Chinese carbon fiber manufacturers (operation, carbon fiber business, etc.).
第一章 碳纤维概述
1.1 定义及性质
1.2 工艺流程
1.3 分类
1.4 应用
1.5 技术水平
1.6 产业链
第二章 全球碳纤维市场
2.1 发展现状
2.2 供需分析
2.2.1 供给
2.2.2 需求
2.3 竞争格局
2.3.1 碳纤维
2.3.2 PAN基碳纤维
2.3.3 沥青基碳纤维
2.4 生产技术与装备
2.5 专利现状
2.6 成本与价格
2.7 发展趋势
第三章 中国碳纤维市场
3.1 政策环境
3.2 发展现状
3.3 供需分析
3.3.1 供给
3.3.2 需求
3.4 产业布局
3.5 竞争格局
3.6 生产技术与装备
3.7 价格
3.8 技术水平
3.9 进出口分析
3.9.1 碳纤维
3.9.2 碳纤维预浸料
3.9.3 其他碳纤维制品
3.10 发展趋势
第四章 碳纤维复合材料
4.1 市场规模
4.2 市场结构
4.2.1 碳纤维复合材料
4.2.2 树脂基碳纤维复合材料
4.3 成本结构
4.4 专利现状
4.5 竞争现状
第五章 上下游产业链分析
5.1 上游碳纤维原丝
5.1.1 全球
5.1.2 中国
5.2 下游应用领域
5.2.1 航空航天
5.2.2 汽车
5.2.3 风电
5.2.4 体育休闲
5.2.5 其它
第六章 海外重点企业
6.1 日本东丽
6.1.1 公司简介
6.1.2 经营情况
6.1.3 碳纤维业务
6.1.4 在华业务
6.2 日本帝人
6.2.1 公司简介
6.2.2 经营情况
6.2.3 碳纤维业务
6.2.4 在华业务
6.3 三菱化学控股集团
6.3.1 公司简介
6.3.2 经营情况
6.3.3 碳纤维业务
6.4 日本吴羽
6.4.1 公司简介
6.4.2 经营情况
6.4.3 碳纤维业务
6.4.4 在华业务
6.5 美国赫克塞尔
6.5.1 公司简介
6.5.2 经营情况
6.5.3 碳纤维业务
6.6 比利时索尔维
6.6.1 公司简介
6.6.2 经营状况
6.6.3 碳纤维业务
6.7 德国西格里
6.7.1 公司简介
6.7.2 经营状况
6.7.3 碳纤维业务
6.8 台塑
6.8.1 公司简介
6.8.2 经营情况
6.8.3 碳纤维业务
6.9 其他
6.9.1 韩国晓星
6.9.2 韩国泰光
6.9.3土耳其AKSACA
第七章 中国大陆碳纤维厂商
7.1 恒神股份
7.1.1 公司简介
7.1.2 经营状况
7.1.3 客户及供应商
7.1.4 碳纤维业务
7.2 吉林碳谷
7.2.1 公司简介
7.2.2 经营状况
7.2.3 主要客户及供应商
7.2.4 碳纤维业务
7.3 方大炭素
7.3.1 企业简介
7.3.2 经营情况
7.3.3 研发
7.3.4 碳纤维业务
7.4 康得新
7.4.1 企业简介
7.4.2 经营情况
7.4.3 研发
7.4.4 碳纤维业务
7.5 吉林炭素
7.5.1 公司简介
7.5.2 经营状况
7.5.3 碳纤维业务
7.6 金发科技
7.6.1 公司简介
7.6.2 碳纤维业务
7.7 吉研高科
7.7.1 公司简介
7.7.2 碳纤维业务
7.8 江苏天鸟
7.8.1 公司简介
7.8.2 碳纤维业务
7.9 江苏航科
7.9.1 公司简介
7.9.2 碳纤维业务
7.10 中简科技
7.10.1 公司简介
7.10.2 经营状况
7.10.3 碳纤维业务
7.11 光威复材
7.11.1 公司简介
7.11.2 经营情况
7.12 其他企业
7.12.1 中复神鹰
7.12.2 威海拓展
7.12.3 河南永煤
7.12.4 沈阳中恒
7.12.5 兴科控股
7.12.6 上海石化
7.12.7 蓝星纤维
7.12.8 嘉兴中宝
7.12.9 浙江精业
1. Overview of Carbon Fiber
1.1 Definition and Properties
1.2 Process Flow
1.3 Classification
1.4 Application
1.5 Technical Level
1.6 Industry Chain
2. Global Carbon Fiber Market
2.1 Status Quo
2.2 Supply and Demand
2.2.1 Supply
2.2.2 Demand
2.3 Competitive Landscape
2.3.1 Carbon Fiber
2.3.2 PAN-based Carbon Fiber
2.3.3 Pitch-based Carbon Fiber
2.4 Production Technology and Equipment
2.5 Status Quo of Patents
2.6 Cost and Price
2.7 Development Trend
3. Chinese Carbon Fiber Market
3.1 Policy
3.2 Status Quo
3.3 Supply and Demand
3.3.1 Supply
3.3.2 Demand
3.4 Industrial Layout
3.5 Competitive Landscape
3.6 Production Technology and Equipment
3.7 Price
3.8 Technical Level
3.9 Import & Export
3.9.1 Carbon Fiber
3.9.2 Carbon Fiber Prepreg
3.9.3 Other Carbon Fiber Products
3.10 Development Trend
4. Carbon Fiber Composites
4.1 Market Size
4.2 Market Structure
4.2.1 Carbon Fiber Composites
4.2.2 Carbon Fiber Reinforced Polymer (CFRP)
4.3 Cost Structure
4.4 Status Quo of Patents
4.5 Current Competition
5. Upstream and Downstream Industry Chains
5.1 Upstream Carbon Fiber Precursor
5.1.1 Global
5.1.2 China
5.2 Downstream Applications
5.2.1 Aviation & Aerospace
5.2.2 Automobile
5.2.3 Wind Power
5.2.4 Sport & Leisure
5.2.5 Others
6. Key Overseas Companies
6.1 Toray
6.1.1 Profile
6.1.2 Operation
6.1.3 Carbon Fiber Business
6.1.4 Business in China
6.2 Teijin
6.2.1 Profile
6.2.2 Operation
6.2.3 Carbon Fiber Business
6.2.4 Business in China
6.3 Mitsubishi Chemical Corporation
6.3.1 Profile
6.3.2 Operation
6.3.3 Carbon Fiber Business
6.4 Kureha
6.4.1 Profile
6.4.2 Operation
6.4.3 Carbon Fiber Business
6.4.4 Business in China
6.5 Hexcel
6.5.1 Profile
6.5.2 Operation
6.5.3 Carbon Fiber Business
6.6 Solvay
6.6.1 Profile
6.6.2 Operation
6.6.3 Carbon Fiber Business
6.7 SGL Carbon
6.7.1 Profile
6.7.2 Operation
6.7.3 Carbon Fiber Business
6.8 Formosa Plastics
6.8.1 Profile
6.8.2 Operation
6.8.3 Carbon Fiber Business
6.9 Others
6.9.1 Hyosung
6.9.2 Taekwang
6.9.3 AKSACA
7. Carbon Fiber Manufacturers in Mainland China
7.1 Jiangsu Hengshen
7.1.1 Profile
7.1.2 Operation
7.1.3 Customers and Suppliers
7.1.4 Carbon Fiber Business
7.2 Jilin Tangu Carbon Fiber
7.2.1 Profile
7.2.2 Operation
7.2.3 Customers and Suppliers
7.2.4 Carbon Fiber Business
7.3 Fangda Carbon New Material
7.3.1 Profile
7.3.2 Operation
7.3.3 R&D
7.3.4 Carbon Fiber Business
7.4 Jiangsu Kangde Xin Composite Material
7.4.1 Profile
7.4.2 Operation
7.4.3 R&D
7.4.4 Carbon Fiber Business
7.5 Jilin Carbon
7.5.1 Profile
7.5.2 Operation
7.5.3 Carbon Fiber Business
7.6 KingfaSci.&Tech
7.6.1 Profile
7.6.2 Carbon Fiber Business
7.7 Jiyan High-tech Fibers
7.7.1 Profile
7.7.2 Carbon Fiber Business
7.8 Jiangsu Tianniao High Technology
7.8.1 Profile
7.8.2 Carbon Fiber Business
7.9 Jiangsu Hangke Composite Materials Technology
7.9.1 Profile
7.9.2 Carbon Fiber Business
7.10 Sinofibers Technology
7.10.1 Profile
7.10.2 Operation
7.10.3 Carbon Fiber Business
7.11 Weihai Guangwei Composites
7.11.1 Profile
7.11.2 Operation
7.12 Others
7.12.1 Zhongfu Shenying Carbon Fiber
7.12.2 WeihaiTuozhan Fiber
7.12.3 HNEC Yongmei Carbon Fiber
7.12.4 Shenyang Zhongheng New Materials
7.12.5 Xingke Holdings
7.12.6 Shanghai Petrochemical
7.12.7 BluestarFibres
7.12.8 Jiaxing Sinodia Carbon Fiber
7.12.9 Zhejiang Jingye Biochemical
图:碳纤维的轻量特性
图:碳纤维产业成长历史
表:碳纤维与常规材料性能对比
图:PAN基碳纤维生产工艺流程
图:PAN基碳纤维热处理过程
表:2017年碳纤维产业链附加值
表:碳纤维按不同类别分类
表:不同碳纤维性能对比
图:PAN基碳纤维性能分类
表:不同碳纤维复合材料及用途
表:碳纤维及其复合材料种类和主要应用
图:不同性能碳纤维性能对比
图:碳纤维产业链
表:全球碳纤维发展历程
图:2013-2022年全球碳纤维市场规模及增速
图:2009-2018年全球碳纤维产能及增长率
图:2017年全球碳纤维(分产品)产能结构
表:2017年全球主要碳纤维生产企业产能
图:2017年全球碳纤维(分国家/地区)产能构成
图:2017年全球PNA基碳纤维产能(分国家/地区)产能构成
图:2011-2022年全球碳纤维需求量及增长率
图:2017年全球碳纤维(分地区)需求结构
图:2017年全球碳纤维(分应用领域)需求结构
图:2017年全球碳纤维(分产品)需求结构
图:全球碳纤维生产企业三大梯队
图:2017年全球碳纤维生产商产能结构
图:2017年全球PAN基碳纤维(小丝束)企业市场份额
图:2017年全球PAN基碳纤维(大丝束)企业市场份额
表:2017年全球及中国主要企业碳纤维经营情况对比
表:全球主要沥青基碳纤维生产商
表:国外主要企业原丝工艺技术及性能参数对比表
图:2008-2018年全球碳纤维专利数量
图:2017年全球碳纤维(分地区)专利数量结构
图:碳纤维生产过程及生产成本
图:2007-2018年全球碳纤维平均销售价格
表:原始碳纤维和回收碳纤维的成本比较
图:英国RCF公司回收碳纤维的工艺流程
表:碳纤维产业相关政策
图:2015-2022年中国碳纤维市场规模
图:2015-2022年中国碳纤维产能
图:2012-2022年中国碳纤维产量
图:2017年中国碳纤维(分产品)产量构成
表:2017年中国主要碳纤维生产企业及其产能
表:2017年中国碳纤维拟/在建项目
图:2013-2022年中国碳纤维国产化率
图:2011-2022年中国碳纤维需求量及增长率
图:2011-2022年中国碳纤维需求量占全球比重
图:2017年中国碳纤维(分应用领域)需求结构
图:2017年中国碳纤维(分省市)需求结构
图:2017年中国碳纤维需求量TOP5城市
图:中国碳纤维生产企业分布
图:2017年中国碳纤维(分省份)产能构成
图:2017年中国碳纤维市场竞争格局
图:中国碳纤维产业链企业布局
表:中国碳纤维生产企业技术装备情况
表:2009-2018年日本T700级碳纤维进口价格
表:中国碳纤维行业低、高端产品市场价格对比
表:中复神鹰碳纤维性能指标参数
表:中国碳纤维产品发展阶段
图:2015年中国进口碳纤维及制品主要应用领域占比
图:2010-2017年中国碳纤维进出口量
图:2010-2017年中国碳纤维进出口平均价格
图:2016年中国碳纤维(分地区)进口量构成
图:2016年中国碳纤维(分地区)出口量构成
图:2012-2017年中国碳纤维预浸料进出口量
图:2012-2017年中国碳纤维预浸料进出口平均价格
图:2016年中国碳纤维预浸料(分地区)进口量构成
图:2016年中国碳纤维预浸料出口目的地分布(按出口量)
图:2010-2017年中国其他碳纤维制品进出口量
图:2010-2017年中国其他碳纤维制品进出口平均价格
图:2016年中国其他碳纤维制品(分地区)进口量构成
图:2016年中国其他碳纤维制品(分地区)出口量构成
表:《中国制造2025》碳纤维复合材料发展规划
图:2013-2022年全球碳纤维复合材料市场规模及增长率
图:2012-2022年全球树脂基碳纤维复合材料需求量
图:2017年全球碳纤维复合材料(分地区)市场规模占比
图:2017年全球碳纤维复合材料(分基体)市场规模占比
图:2017年碳纤维复合材料(分应用领域)需求结构
图:2017年树脂基碳纤维复合材料(分应用领域)市场规模构成
图:2017年树脂基碳纤维复合材料(分地区)市场规模构成
图:2017年树脂基碳纤维复合材料(分生产工艺)产量构成
图:碳纤维复合材料成本结构
表:截止2017年全球碳纤维复合材料专利数量
图:截止2017年全球CFRTP专利分布
表:中国主要的碳纤维复合材料生产商
表:全球主流厂商PAN碳纤维原丝制备路线
图:2017年全球碳纤维原丝(分国家)产能构成
图:2017年中国碳纤维原丝(分企业)产能构成
图:2013-2022年全球碳纤维复合材料应用结构
图:碳纤维在航空航天领域的应用历程
图:2017年全球航空航天领域细分市场出货量构成
图:2017年全球航空材料(分产品)市场份额
图:2017年全球航空材料(分用途)市场份额
图:波音787客机碳纤维复合材料应用情况
图:A380机身结构
图:B787机身结构
表:全球主要碳纤维生产企业在航空航天领域中的拓展
图:2017年全球航空材料碳纤维(分市场)需求结构
图:商业飞机产业发展计划
图:2017年全球航空航天领域碳纤维复合材料(分客户)需求结构
图:2013-2022年全球航空和国防用碳纤维复合材料市场规模
图:碳纤维复合材料在汽车上的应用
表:CFRP汽车零部件轻量化实例
表:全球主要整车厂商的碳纤维应用案例及供应商
表:2011-2018年全球主要碳纤维生产企业在汽车工业中的拓展
图:主要制造商在车用碳纤维领域的专利布局
表:碳纤维在汽车领域的应用实例
图:2013-2016年宝马碳纤维工厂产能
图:碳纤维在宝马汽车零部件中的应用比例
图:宝马i3的碳纤维车身生产工艺
图:2020年全球汽车领域碳纤维使用量
图:2017年主要汽车材料价格
图:碳纤维和钢铁制造汽车的成本对比
图:2013-2022年全球汽车用碳纤维复合材料市场规模及增速
图:碳纤维复合零件的制造工艺及用途
图:聚丙烯腈碳纤维混合沥青碳纤维后性能显著提升
图:碳纤维叶片
图:碳纤维在风机叶片中的应用
图:碳纤维复合材料在风机上的应用实例
图:2009-2017年全球新增及累计风电装机容量
表:2014-2017年全球(分区域)风电装机(单位:MW)
图:2013-2022年全球风电用碳纤维复合材料市场规模
图:碳纤维复合材料在体育用品中的应用
图:2017年全球体育休闲(分产品)碳纤维复合材料需求量构成
图:2013-2022年全球体育休闲用碳纤维复合材料市场规模
图:碳纤维复合材料在建筑和民用工程上的补强作用
图:碳纤维复合材料在医疗器械上的应用
图:碳纤维复合材料船舶上的应用
图:日本东丽全球布局
图:日本东丽全球业务发展历程
图:2010-2017财年日本东丽净销售额和净利润
图:2014-2016财年日本东丽(分部门)销售收入构成
图:2017财年日本东丽(分部门)销售收入构成
表:2016-2017财年日本东丽(分地区)销售收入
图:2010-2017财年日本东丽碳纤维业务净销售额与营业利润
图:2012-2017财年东丽碳纤维部门(按应用领域)销售收入占比
表:2017年东丽碳纤维工厂及其产能
图:2017-2018财年东丽碳纤维相关投资项目
图:日本东丽GR项目发展
表:日本东丽在华企业
图:帝人全球布局
图:2010-2017财年帝人净销售额和净利润
图:2014-2017财年帝人(分部门)销售收入构成
图:2017财年帝人(分部门)销售收入构成
图:2011-2016财年日本Teijin先进纤维及其复合材料部门销售收入和营业利润
图:2016财年帝人(分地区)销售收入构成
表:帝人集团下属碳纤维公司
表:日本东邦碳纤维主要应用领域
图:2010-2017财年三菱化学控股净销售额与净利润
图:2014-2016财年三菱化学控股(分业务)销售收入构成
图:2017财年三菱化学控股(分业务)销售收入构成
表:三菱丽阳基本信息
表:三菱丽阳下属碳纤维公司一览表
表:三菱丽阳碳纤维主要应用领域
表:三菱丽阳碳纤维业务发展情况
图:2010-2017财年日本吴羽净销售额和净利润
图:2013-2017财年日本Kureha(分业务)销售收入构成
图:2010-2017财年日本Kureha先进材料部门销售收入及营业利润
图:2013-2017财年日本Kureha先进材料部门主要产品销售收入
图:Hexcel生产基地全球分布
图:2010-2018年美国Hexcel净销售额与净利润
图:2013-2018美国Hexcel(分业务)销售收入构成
图:2013-2017年美国Hexcel(分地区)销售收入构成
图:Solvay全球布局
图:2010-2017年Solvay销售额与净利润
图:2016-2017年Solvay(分业务)销售额构成
图:2016-2017年Solvay(分地区)销售额构成
图:2016-2017年Solvay(分应用领域)销售额构成
图:德国SGL全球生产基地分布
图:2010-2017年德国SGL销售收入与净利润
图:2014-2017年德国SGL(分业务)销售收入构成
图:2013-2017年德国SGL(分地区)销售收入构成
图:2016-2017年德国SGL(分消费领域)销售收入构成
图:2013-2017年德国SGL碳纤维及复合材料部门销售收入及EBITDA
图:2016年德国SGL碳纤维及复合材料部门(分市场)销售收入构成
图:2017年德国SGL碳纤维及复合材料部门(分市场)销售收入构成
表:台塑事业部门及主营业务
图:2010-2017年台塑营业收入及净利润
图:2014-2017年台塑(分部门)营业收入构成
图:2010-2017年台塑碳纤维销售收入及平均价格
图:2010-2017年台塑碳纤维产能、产量及开工率
图:2010-2017年台塑碳纤维销量和产销率
图:韩国晓星全球布局
表:2015-2017年韩国晓星经营情况
表:2018Q1年韩国晓星经营情况
图:2013-2018年恒神股份营业收入和净利润
图:2013-2017年恒神股份(分产品)营业收入构成
图:2013-2017年恒神股份前五名客户贡献收入及占比
表:2017年恒神股份主要客户销售额及占比
图:2013-2017年恒神股份前五大供应商采购金额及占比
表:2017年恒神股份主要供应商采购金额及占比
图:2013-2017年吉林碳谷营业收入和净利润
表:2014-2017年吉林碳谷(分地区)营业收入及占比
表:2017年吉林碳谷主要客户销售额及占比
表:2017年吉林碳谷主要供应商采购额及占比
表:吉林碳谷碳纤维原丝相关技术
图:2013-2017年吉林碳谷碳纤维原丝销量
图:方大炭素(分产品)产能分布
图:2010-2018年方大炭素营业收入与净利润
图:2010-2017年方大炭素(分产品)营业收入构成
图:2010-2017年方大炭素(分地区)营业收入构成
图:2009-2017年方大炭素(分产品)毛利率
图:2011-2017年方大炭素研发投入及占比
图:2012-2017年江城碳纤维营业收入和净利润
图:2010-2018年康得新营业收入与净利润
图:2013-2017年康得新(分产品)营业收入构成
图:2010-2017年康得新(分地区)营业收入构成
图:2011-2017年康得新毛利率
图:2011-2017年康得新研发投入与占比
图:2010-2017年吉林炭素营业收入和净利润
图:2013-2017年金发碳纤维净利润
图:2014-2017年吉研高科营业收入和净利润
图:2017年江苏天鸟(分业务)营业收入构成
Lightweight Properties of Carbon Fiber
History of Carbon Fiber Industry
Performance Comparison of Carbon Fiber and Conventional Materials
Production Process of PAN-based Carbon Fiber
Heat Treatment Process of PAN-based Carbon Fiber
Added Value of Carbon Fiber Industry Chain, 2017
Classification of Carbon Fiber by Type
Performance Comparison of Different Carbon Fibers
Classification of PAN-based Carbon Fiber by Performance
Different Carbon Fiber Composites and Their Uses
Types and Main Application of Carbon Fibers and Their Composites
Performance Comparison of Different Carbon Fibers
Carbon Fiber Industry Chain
History of Global Carbon Fiber Development
Global Carbon Fiber Market Size and Growth Rate, 2013-2022E
Global Carbon Fiber Capacity and Growth Rate, 2009-2018
Global Carbon Fiber Capacity Structure (by Product), 2017
Capacity of World’s Major Carbon Fiber Production Enterprises, 2017
Global Carbon Fiber Capacity Structure (by Country/Region), 2017
Global PAN-based Carbon Fiber Capacity Structure (by Country/Region), 2017
Global Carbon Fiber Demand and Growth Rate, 2011-2022E
Global Carbon Fiber Demand Structure (by Region), 2017
Global Carbon Fiber Demand Structure (by Application), 2017
Global Carbon Fiber Demand Structure (by Product), 2017
Three Echelons of Global Carbon Fiber Manufacturers
Capacity Structure of Global Carbon Fiber Producers, 2017
Market Share of Global PAN-based Carbon Fiber (Small Tow) Enterprises, 2017
Market Share of Global PAN-based Carbon Fiber (Large Tow) Enterprises, 2017
Comparison of Carbon Fiber Operations between World’s and China’s Major Enterprises, 2017
World’s Major Pitch-based Carbon Fiber Producers
Comparison Table of Precursor Technology and Performance Parameters of Major Foreign Companies
Number of Global Carbon Fiber Patents, 2008-2018
Numerical Structure of Global Carbon Fiber Patents (by Region), 2017
Carbon Fiber Production Process and Cost
Average Selling Price of Global Carbon Fiber, 2007-2018
Cost Comparison of Original Carbon Fiber and Recycled Carbon Fiber
Carbon Fiber Recycling Process of RCF
Policies on Carbon Fiber Industry
China’s Carbon Fiber Market Size, 2015-2022E
China’s Carbon Fiber Capacity, 2015-2022E
China’s Carbon Fiber Production, 2012-2022E
China’s Carbon Fiber Production Structure (by Product), 2017
China’s Major Carbon Fiber Producers and Their Capacity, 2017
China’s Carbon Fiber Projects (Proposed & under Construction), 2017
China’s Carbon Fiber Localization Rate, 2013-2022E
China’s Carbon Fiber Demand and Growth Rate, 2011-2022E
China’s Carbon Fiber Demand as a Percentage of Global Demand, 2011-2022E
China’s Carbon Fiber Demand Structure (by Application), 2017
China’s Carbon Fiber Demand Structure (by Province/Municipality), 2017
Top 5 Cities of Carbon Fiber in China by Demand, 2017
Distribution of Chinese Carbon Fiber Producers
China’s Carbon Fiber Capacity Structure (by Province), 2017
Competition Pattern of China’s Carbon Fiber Market, 2017
Competition Pattern of China’s Carbon Fiber Market, 2016
Corporate Layout of China’s Carbon Fiber Industry Chain
Technical Equipment of Chinese Carbon Fiber Manufacturers
Import Price of Japan’s T700 Carbon Fiber, 2009-2018
Market Price Comparison of High-end and Low-end Products in China’s Carbon Fiber Industry
Performance Parameters of Zhongfu Shenying Carbon Fiber
Stages of China’s Carbon Fiber Product Development
Structure of China’s Imported Carbon Fiber and Products by Applications, 2015
China’s Carbon Fiber Export and Import Volume, 2010-2017
Average Price of China’s Carbon Fiber Exports and Imports, 2010-2017
Structure of China’s Carbon Fiber Import Volume (by Region), 2016
Structure of China’s Carbon Fiber Export Volume (by Region), 2016
China’s Carbon Fiber Prepreg Export and Import Volume, 2012-2017
Average Price of China’s Carbon Fiber Prepreg Exports and Imports, 2012-2017
Structure of China’s Carbon Fiber Prepreg Import Volume (by Region), 2016
Distribution of China’s Carbon Fiber Prepreg Export Destinations (by Export Volume), 2016
China’s Other Carbon Fiber Products Export and Import Volume, 2010-2017
Average Price of China’s Other Carbon Fiber Products Exports and Imports, 2010-2017
Structure of China’s Other Carbon Fiber Products Import Volume (by Region), 2016
Structure of China’s Other Carbon Fiber Products Export Volume (by Region), 2016
Development Plan for Carbon Fiber Composites in “Made in China 2025”
Global Carbon Fiber Composites Market Size and Growth Rate, 2013-2022E
Global Demand for Carbon Fiber Reinforced Polymer (CFRP), 2012-2022E
Structure of Global Carbon Fiber Composites Market Size by Region, 2017
Structure of Carbon Fiber Composites Market Size by Substrate, 2017
Demand Structure of Carbon Fiber Composites by Application, 2017
Structure of Carbon Fiber Reinforced Polymer (CFRP) Market Size by Application, 2017
Structure of Carbon Fiber Reinforced Polymer (CFRP) Market Size by Region, 2017
Structure of Carbon Fiber Reinforced Polymer (CFRP) Output by Production Process, 2017
Cost Structure of Carbon Fiber Composites
Global Number of Patents about Carbon Fiber Composites, by 2017
Distribution of CFRTP Patents Worldwide as of 2017
Major Carbon Fiber Composites Producers in China
PAN Carbon Fiber Precursor Preparation Routes of Global Mainstream Producers
Structure of Global Carbon Fiber Precursor Capacity by Country, 2017
Structure of China’s Carbon Fiber Precursor Capacity by Enterprise, 2017
Global Carbon Fiber Application Structure, 2013-2022E
History of Carbon Fiber Applied in Aerospace
Global Shipment Structure of Carbon Fiber Applied in Aerospace Market Segments, 2017
Market Share of Global Aeronautical Materials by Product, 2017
Market Share of Global Aeronautical Materials by Application, 2017
Application of Carbon Fiber Composites in Boeing 787 Dreamliner
A380 Fuselage Structure
B787 Fuselage Structure
Expansion of Major Global Carbon Fiber Producers in Aerospace Field
Demand Structure of Carbon Fiber Composites in Global Aerospace Field, 2017
Commercial Aircraft Industry Development Plan
Demand Structure of Carbon Fiber Composites in Global Aerospace Field by Customer, 2017
Global Market Size of Carbon Fiber Composites for Aerospace and National Defense, 2013-2022E
Application of Carbon Fiber Composites in Automobiles
Examples of Lightweight CFRP Automotive Parts
Carbon Fiber Application Cases and Suppliers of Global Automakers
Expansion of Major Global Carbon Fiber Producers in Automobile Industry, 2011-2018
Major Manufacturers’ Patents about Vehicle Carbon Fiber
Cases of Carbon Fiber Applied in Automotive Field
Capacity of BMW’s Carbon Fiber Plant, 2013-2016
Application Proportion of Carbon Fiber in BMW’s Auto Parts
Carbon-fiber Body Production Process of BMW i3
Carbon Fiber Consumption in Automotive Field Worldwide, 2020E
Prices of Main Materials for Automobile, 2017
Cost Comparison between Carbon-fiber Cars and Steel Cars
Global Automotive Carbon Fiber Composites Market Size and Growth Rate, 2013-2022E
Manufacturing Process of and Application of CFRP Parts
Significant Improvement in Performance of PAN-based Carbon Fiber Mixed with Pitch-based Carbon Fiber
Carbon Fiber Blades
Application of Carbon Fiber in Wind Turbine Blades
Application Cases of Carbon Fiber Composites in Wind Turbines
Global Cumulative and New Wind Power Capacity, 2009-2017
Global Installed Wind Power Capacity Structure by Region, 2014-2017
Global Market Size of Carbon Fiber Composites for Wind Power, 2013-2022E
Use of Carbon Fiber Composites for Sporting Goods
Demand Structure of Carbon Fiber Composites in Global Sports & Leisure Market by Product, 2017
Global Market Size of Carbon Fiber Composites for Sports & Leisure, 2013-2022E
Reinforcing Action of Carbon Fiber Composites in Buildings and Civil Engineering
Use of Carbon Fiber Composites for Medical Devices
Use of Carbon Fiber Composites for Shipping
Global Layout of Toray
Global Business Development Course of Toray
Revenue and Net Income of Toray, FY2010-FY2017
Revenue Structure of Toray by Division, FY2014-FY2016
Revenue Structure of Toray by Division, FY2017
Revenue of Toray by Region, FY2016-FY2017
Net Sales and Operating Income of Toray's Carbon Fiber Division, FY2010-FY2017
Revenue Structure of Toray's Carbon Fiber Division by Application, FY2012-FY2017
Carbon Fiber Factories and Capacity of Toray, 2017
Carbon Fiber-related Investment Projects of Toray, FY2017-FY2018
Progress of Toray's GR Projects
Toray’s Companies in China
Global Presence of Teijin
Revenue and Net Income of Teijin, FY2010-FY2017
Revenue Structure of Teijin by Division, FY2014-FY2016
Revenue Structure of Teijin by Division, FY2017
Revenue and Operating Income of Teijin’s Advanced Fibers and Composites Division, FY2011-FY2016
Revenue Structure of Teijin by Region, FY2016
Carbon Fiber Companies under Teijin
Main Applications of Toho’s Carbon Fibers
Revenue and Net Income of Mitsubishi Chemical Holdings, FY2010-FY2017
Revenue Structure of Mitsubishi Chemical Holdings by Business, FY2014-FY2016
Revenue Structure of Mitsubishi Chemical Holdings by Business, FY2017
Basic Information of Mitsubishi Rayon
Carbon Fiber Companies under Mitsubishi Rayon
Main Applications of Mitsubishi Rayon’s Carbon Fibers
Development of Mitsubishi Rayon’s Carbon Fiber Business
Revenue and Net Income of Kureha, FY2010-FY2017
Revenue Structure of Kureha by Business, FY2013-FY2017
Revenue and Operating Income of Kureha’s Advanced Materials Division, FY2010-FY2017
Revenue from Main Products of Kureha’s Advanced Materials Division, FY2013-FY2017
Production Bases of Hexcel Worldwide
Revenue and Net Income of Hexcel, 2010-2018
Revenue Structure of Hexcel by Business, 2013-2018
Revenue Structure of Hexcel by Region, 2013-2017
Global Presence of Solvay
Revenue and Net Income of Solvay, 2010-2017
Revenue Structure of Solvay by Business, 2016-2017
Revenue Structure of Solvay by Region, 2016-2017
Revenue Structure of Solvay by Application, 2016-2017
Production Bases of SGL Carbon Worldwide
Revenue and Net Income of SGL Carbon, 2010-2017
Revenue Structure of SGL Carbon by Business, 2014-2017
Revenue Structure of SGL Carbon by Region, 2013-2017
Revenue Structure of SGL Carbon by Consumption, 2016-2017
Revenue and EBITDA of SGL Carbon’s Carbon Fibers and Composites Division, 2013-2017
Revenue Structure of SGL Carbon’s Carbon Fibers and Composites Division by Market, 2016
Revenue Structure of SGL Carbon’s Carbon Fibers and Composites Division by Market, 2017
Business Divisions and Operating Business of Formosa Plastics
Revenue and Net Income of Formosa Plastics, 2010-2017
Revenue Structure of Formosa Plastics by Division, 2014-2017
Revenue and Average Price of Formosa Plastics’ Carbon Fiber, 2010-2017
Carbon Fiber Capacity, Output and Utilization of Formosa Plastics, 2010-2017
Carbon Fiber Sales Volume and Sales-Output Ratio of Formosa Plastics, 2010-2017
Global Presence of Hyosung
Operation of Hyosung, 2015-2017
Operation of Hyosung, 2018Q1
Revenue and Net Income of Jiangsu Hengshen, 2013-2018
Revenue Structure of Jiangsu Hengshen by Product, 2013-2017
Revenue from Top 5 Customers and % of Total Revenue of Jiangsu Hengshen, 2013-2017
Revenue Contribution of Key Customers of Jiangsu Hengshen, 2017
Procurement from Top 5 Suppliers and % of Total Procurement of Jiangsu Hengshen Fiber Material, 2013-2017
Procurement Breakdown of Key Suppliers of Jiangsu Hengshen Fiber Material, 2017
Revenue and Net Income of Jilin Tangu Carbon Fiber, 2013-2017
Revenue Breakdown of Jilin Tangu Carbon Fiber by Region, 2014-2017
Revenue Contribution of Key Customers of Jilin Tangu Carbon Fiber, 2017
Procurement Breakdown of Key Suppliers of Jilin Tangu Carbon Fiber, 2017
Carbon Fiber Precursor Technologies of Jilin Tangu Carbon Fiber
Carbon Fiber Precursor Sales Volume of Jilin Tangu Carbon Fiber, 2013-2017
Capacity Distribution of Fangda Carbon New Material by Product
Revenue and Net Income of Fangda Carbon New Material, 2010-2018
Revenue Structure of Fangda Carbon New Material by Product, 2010-2017
Revenue Structure of Fangda Carbon New Material by Region, 2010-2017
Gross Margin of Fangda Carbon New Material by Product, 2009-2017
R&D Costs and % of Total Revenue of Fangda Carbon New Material, 2011-2017
Revenue and Net Income of Jilin Fangda Jiangcheng Carbon Fiber, 2012-2017
Revenue and Net Income of Kangde Xin Composite Material, 2010-2018
Revenue Structure of Kangde Xin Composite Material by Product, 2013-2017
Revenue Structure of Kangde Xin Composite Material by Region, 2010-2017
Gross Margin of Kangde Xin Composite Material, 2011-2017
R&D Costs and % of Total Revenue of g Kangde Xin Composite Material, 2011-2017
Revenue and Net Income of Jilin Carbon, 2010-2017
Net Income of Kingfa Carbon Fiber Materials, 2013-2017
Revenue and Net Income of Jiyan High-tech Fibers, 2014-2017
Revenue Structure of Jiangsu Tianniao High Technology by Business, 2017
Revenue and Net Income of Sinofibers Technology, 2014-2017
Revenue Structure of Sinofibers Technology by Product, 2014-2017
Revenue and Net Income of Weihai Guangwei Composites, 2014-2017
Revenue Structure of Weihai Guangwei Composites by Product, 2014-2017
Carbon Fiber Product Capacity of Weihai Guangwei Composites, 2017
Output and Sales of Major Carbon Fiber Products of Weihai Guangwei Composites, 2016-2017
如果这份报告不能满足您的要求,我们还可以为您定制报告,请 留言说明您的详细需求。
|