|
|
|
报告导航:研究报告—
制造业—材料
|
|
2018-2023年全球及中国光纤预制棒行业研究报告 |
 |
字数:4.0万 |
页数:166 |
图表数:197 |
|
中文电子版:13000元 |
中文纸版:8000元 |
中文(电子+纸)版:13500元 |
|
英文电子版:3200美元 |
英文纸版:3400美元 |
英文(电子+纸)版:3500美元 |
|
编号:CYH077
|
发布日期:2018-07 |
附件:下载 |
 |
|
|
光纤预制棒(简称“光棒”)在整个光纤光缆产业链中占据重要地位,占光纤利润的70%左右。2017年全球光棒需求量达1.53万吨,同比增长11.1%。在FTTx等宽带需求增长拉动下,预计2023年全球光棒需求量有望达到3.15万吨,复合增长率约12.2%(2018-2023年)。其中,中国是全球光棒需求最高的国家,2017年占全球需求量的60.5%,预计至2023年提升至61.6%。
中国也是全球光棒产量最大的国家,2017年产量为7550吨,供需缺口约1750吨,市场仍处于供不应求的状态。随着光纤光缆需求的持续增长,市场供不应求的局面还将延续,预计2022年以后,中国光棒有望实现完全自给,2023年中国光棒产量和需求量分别有望达2.02万吨和1.94万吨。
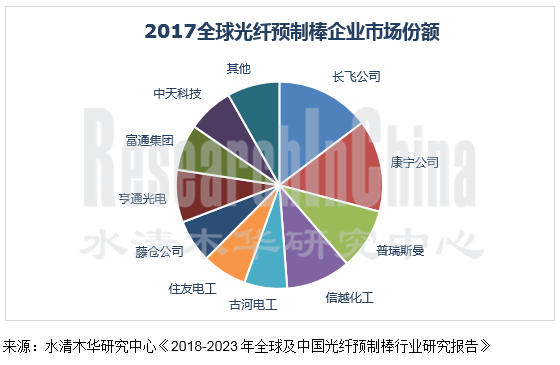
受技术限制,全球光纤预制棒企业集中度较高,全球光棒厂家仅有约20家,主要集中在日本、美国和中国等国家或地区,包括康宁、住友电工、信越化学、长飞光纤、亨通光电等。其中,长飞光纤全球市场份额第一,按产能,2017年为14.7%;其次为美国康宁,约14.4%。
由于光通信行业高景气度影响,近两年,中国光纤预制棒产业化项目布局明显增多,除了如长飞光纤、亨通光电、富通集团等中国主要光棒企业大幅扩能增产外,通鼎互联、中利科技、鑫茂科技、杭电股份等中国主要光纤光缆企业也开始布局光棒项目,根据披露项目,预计至2023年全国光纤预制棒产能有望超过25000吨,产能过剩迹象明显。
2018年7月10日,中国政府公告将继续对原产于日本、美国的光纤预制棒征收反倾销税,且实施期为五年,此举除了对中国光棒企业的发展起到了很好的保护作用外,也促进中国光棒加大了研发力度和产能,从根本上促进了中国光纤光缆产业自主创新,有利于中国光通信产业发展。另外,也促使中国光棒价格的进一步上涨,2018年中国光棒价格有望提升至1225元/公斤。
水清木华研究中心《2018-2023年全球及中国光纤预制棒行业研究报告》着重研究了以下内容:
 全球光纤预制棒市场供需、地区分布、价格、竞争格局及发展趋势; 全球光纤预制棒市场供需、地区分布、价格、竞争格局及发展趋势;
中国光纤预制棒政策环境、市场供需、进出口、竞争格局及价格及发展趋势;
全球及中国光纤光缆市场发展情况;
全球及中国13家光纤预制棒企业经营情况及光纤预制棒业务发展情况等。
Optical fiber preform, playing an important role in the optical fiber and cable industry chain, seizes about 70% profits of optical fiber. In 2017, the global demand for optical fiber preform rose 11.1% year on year and reached 15.3kt, and is expected to hit 31.5kt in 2023 with the CAGR of 12.2% between 2018 and 2023 because of the growing demand for broadband like FTTx (Fiber To The X). China is the largest consumer of optical fiber preform around the globe, as a percentage of 60.5% in global demand and the expected 61.6% in 2023.
China, the world’s largest producer of optical fiber preform as well, produced 7.55 kt in 2017, leaving a supply-demand gap of 1.75kt or so and still being in short supply. The short supply will continue as the demand for optical fiber and cable is growing. It is estimated after 2022, optical fiber preform in China will be self-sufficient, and the output and demand will amount to 20.2kt and 19.4kt in 2023, respectively.
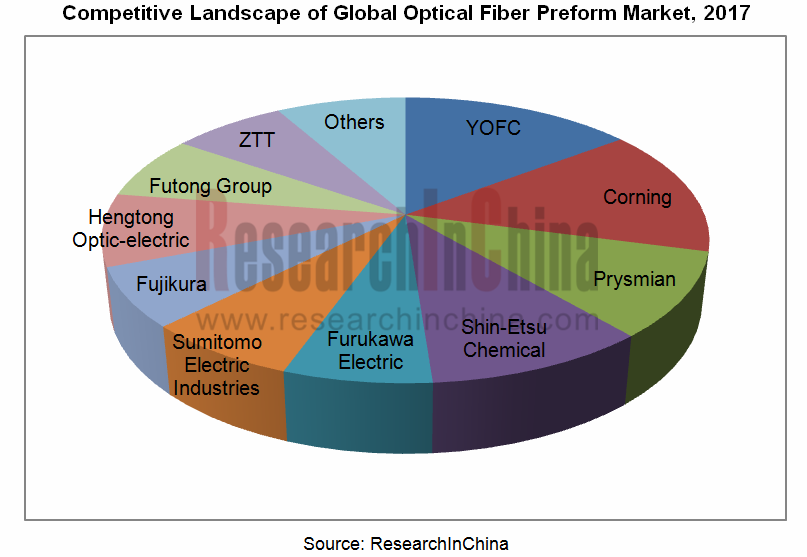
Due to technical constraints, global optical fiber perform market is characterized by high concentration, only about 20 players distribute in Japan, USA and China, including Corning, Sumitomo Electric Industries, Shin-Etsu Chemical, Yangtze Optical Fiber and Cable (YOFC), and Hengtong Optic-electric, etc. Among them, YOFC topped with share of 14.7% in terms of capacity in 2017, followed by Corning with 14.4%.
Allured by high prosperity of optical communication industry, there has been a remarkable increase of optical fiber preform industrialization projects across China over the recent two years. Apart from such giants’ capacity expansion as YOFC, Hengtong Optic-electric and Futong Group, the key optical fiber and cable companies like Tongding Interconnection Information, Zhongli Sci-Tech, Tianjin Xinmao Science & Technology, and Hangzhou Cable also foray into optical fiber preform field. As estimated, the production capacity of optical fiber preform in China will be at least 25kt till 2023, showing a clear sign of overcapacity.
On July 10, 2018, Chinese government announced to continue imposing anti-dumping duties on optical fiber preform originated from Japan and the United States with 5-year implementation period. This move not only protects Chinese optical fiber preform companies but encourages local peers to make more investments into R&D and rev up production of optical fiber preform, practically conducing to independent innovation of optical fiber and cable industry and making for the development of optical communication in China. Additionally, the price of optical fiber preform is driven upwards and is expected to stand at RMB1,225/kg in 2018.
Global and China Optical Fiber Preform Industry Report, 2018-2023 highlights the following:
 Global optical fiber preform market (supply & demand, regional distribution, price, competitive landscape and development trend); Global optical fiber preform market (supply & demand, regional distribution, price, competitive landscape and development trend);
Chinese optical fiber preform market (Policy climate, supply & demand, import & export, price, competition pattern and development trend);
Development of global and China optical fiber & cable market;
13 global and Chinese optical fiber preform companies (operation, optical fiber preform business, etc.).
第一章 光纤预制棒概述
1.1 定义
1.2 生产工艺
1.3 产业链
1.3.1 上游
1.3.2 下游
第二章 全球光纤预制棒行业发展概况
2.1 发展现状
2.2 供需分析
2.2.1 供给
2.2.2 需求
2.3 地区结构
2.3.1 美国
2.3.2 日本
2.3.3 欧洲
2.4 价格
2.5 竞争格局
第三章 中国光纤预制棒行业发展概况
3.1 政策环境
3.1.1 主要政策
3.1.2 反倾销调查
3.2 发展历程
3.3 供需分析
3.3.1 供给分析
3.3.2 需求分析
3.4 进出口
3.4.1 进口
3.4.2 出口
3.5 价格走势
3.5.1 原材料价格
3.5.2 光纤预制棒价格
3.6 竞争格局
第四章 全球及中国光纤光缆市场发展概况
4.1 全球
4.1.1 市场发展
4.1.2 地区结构
4.1.3 价格
4.1.4 企业
4.2 中国
4.2.1 市场发展
4.2.2 价格
4.2.3 竞争格局
第五章 全球光纤预制棒主要生产企业
5.1 康宁公司
5.1.1 企业简介
5.1.2 经营情况
5.1.3 光纤预制棒业务
5.1.4 在华发展
5.1.5 成都康宁光缆有限公司
5.1.6 康宁(海南)光通信有限公司
5.2 住友电工
5.2.1 企业简介
5.2.2 经营情况
5.2.3 光纤预制棒业务
5.2.4 在华发展
5.2.5 成都中住光纤
5.3 信越化工
5.3.1 企业简介
5.3.2 经营情况
5.3.3 光纤预制棒业务
5.3.4 在华发展
5.4 日本藤仓
5.4.1 企业简介
5.4.2 经营情况
5.4.3 光纤预制棒业务
5.4.4 在华发展
5.4.5 藤仓烽火光电
5.5 普瑞斯曼
5.5.1 公司简介
5.5.2 经营情况
5.5.3 光纤预制棒业务
5.5.4 在华发展
5.6 古河电工
5.6.1 公司简介
5.6.2 经营情况
5.6.3 光纤预制棒业务
5.6.4 在华发展
5.7 特恩驰
5.7.1 企业简介
5.7.2 经营情况
5.7.3 光纤预制棒业务
5.7.4 在华发展
5.7.5 南京特恩驰
第六章 中国光纤预制棒主要生产企业
6.1 长飞光纤光缆
6.1.1 企业简介
6.1.2 经营情况
6.1.3 光纤预制棒业务
6.2 亨通光电
6.2.1 企业简介
6.2.2 经营情况
6.2.6 光纤预制棒业务
6.3 中天科技
6.3.1 企业简介
6.3.2 经营情况
6.3.3 光纤预制棒业务
6.4 烽火通信
6.4.1 企业简介
6.4.2 经营情况
6.4.3 光纤预制棒业务
6.5 富通集团
6.5.1 企业简介
6.5.2 经营情况
6.5.3 在建项目
6.5.4 光纤预制棒业务
6.6 普法公司
6.6.1 企业简介
6.6.2 经营情况
6.6.3 光纤预制棒业务
第七章 结论与预测
7.1 企业
7.2 市场
1. Overview of Optical Fiber Preform
1.1 Definition
1.2 Production Technology
1.3 Industry Chain
1.3.1 Upstream
1.3.2 Downstream
2. Global Optical Fiber Preform Industry
2.1 Status Quo
2.2 Supply & Demand
2.2.1 Supply
2.2.2 Demand
2.3 Regional Structure
2.3.1 USA
2.3.2 Japan
2.3.3 Europe
2.4 Price
2.5 Competitive Landscape
3. Optical Fiber Preform Industry in China
3.1 Policy Environment
3.1.1 Major Policies
3.1.2 Anti-Dumping Investigation
3.2 Development History
3.3 Supply & Demand
3.3.1 Supply
3.3.2 Demand
3.4 Import & Export
3.4.1 Import
3.4.2 Export
3.5 Price Trend
3.5.1 Raw Materials
3.5.2 Optical Fiber Preform
3.6 Competitive Landscape
4. Global and Chinese Optical Fiber & Cable Market
4.1 Global
4.1.1 Market Development
4.1.2 Regional Structure
4.1.3 Price
4.1.4 Enterprise
4.2 China
4.2.1 Market Development
4.2.2 Price
4.2.3 Competitive Landscape
5. Major Global Optical Fiber Preform Companies
5.1 Corning
5.1.1 Profile
5.1.2 Operation
5.1.3 Optical Fiber Preform Business
5.1.4 Development in China
5.1.5 Corning Optical Fiber Cable Chengdu Co. Ltd.
5.1.6 Corning (Hainan) Optical Communication Co., Ltd.
5.2 Sumitomo Electric Industries
5.2.1 Profile
5.2.2 Operation
5.2.3 Optical Fiber Preform Business
5.2.4 Development in China
5.2.5 Chengdu SEI Optical Fiber
5.3 Shin-Etsu Chemical
5.3.1 Profile
5.3.2 Operation
5.3.3 Optical Fiber Preform Business
5.3.4 Development in China
5.4 Fujikura
5.4.1 Profile
5.4.2 Operation
5.4.3 Optical Fiber Preform Business
5.4.4 Development in China
5.4.5 Fujikura FiberHome Opto-Electronic Material Technology
5.5 Prysmian
5.5.1 Profile
5.5.2 Operation
5.5.3 Optical Fiber Preform Business
5.5.4 Development in China
5.6 Furukawa Electric
5.6.1 Profile
5.6.2 Operation
5.6.3 Optical Fiber Preform Business
5.6.4 Development in China
5.7 TwentscheKabel Holding (TKH)
5.7.1 Profile
5.7.2 Operation
5.7.3 Optical Fiber Preform Business
5.7.4 Development in China
5.7.5 Twentsche (Nanjing) Fibre Optics
6. Major Chinese Optical Fiber Preform Companies
6.1 YOFC
6.1.1 Profile
6.1.2 Operation
6.1.3 Optical Fiber Preform Business
6.2 Hengtong Optic-electric
6.2.1 Profile
6.2.2 Operation
6.2.3 Optical Fiber Preform Business
6.3 Jiangsu Zhongtian Technology (ZTT)
6.3.1 Profile
6.3.2 Operation
6.3.3 Optical Fiber Preform Business
6.4 FiberHome Technologies
6.4.1 Profile
6.4.2 Operation
6.4.3 Optical Fiber Preform Business
6.5 Futong Group
6.5.1 Profile
6.5.2 Operation
6.5.3 Projects under Construction
6.5.4 Optical Fiber Preform Business
6.6 Potevio Fasten Optical Communication
6.6.1 Profile
6.6.2 Operation
6.6.3 Optical Fiber Preform Business
7. Summary and Forecast
7.1 Enterprise
7.2 Market
图:光纤预制棒芯棒和包层示意图
表:光纤预制棒芯棒制造工艺对比
图:2017年全球光纤预制棒芯棒工艺分布比例
表:中国光纤预制棒芯棒工艺对比
图:光纤预制棒产业链
图:中国光纤预制棒成本结构
图:光纤预制棒下游产业链
图:2013-2023年全球光纤预制棒产能与产量
图:2013-2023年全球光纤预制棒需求量
表:2014-2018年全球光纤预制棒(分国家/地区)产能及市场份额
图:2010-2018年全球(分国家/地区)光纤预制棒需求量
表:2010-2017年美国光纤预制棒产能、产量与需求量
表:2010-2017年美国光纤预制棒出口情况
表:2010-2017年日本光纤预制棒产能、产量与需求量
表:2010-2017年日本光纤预制棒出口情况
图:2000-2018年全球光纤预制棒价格
表:2010-2018年中国光纤预制棒行业相关政策
表:2018年中国光纤预制棒反倾销
表:中国光纤预制棒发展历程
图:2008-2018年中国光纤预制棒产量及同比增长
表:2018年中国光纤预制棒主要在建及规划项目
图:2010-2018年中国光纤预制棒需求量及同比增长
图:2007-2018年中国光纤预制棒自给率
图:2010-2017年中国光纤预制棒进口量及同比增长
图:2013-2017年中国光纤预制棒(分国家)进口量构成
图:2010-2017年中国光纤预制棒进口金额及同比增长
图:2010-2017年中国光纤预制棒出口量及同比增长
图:2013-2017年中国光纤预制棒(分国家)出口量构成
图:2010-2017年中国光纤预制棒出口金额及同比增长
图:2010-2018年中国锗价走势
图:2010-2018年中国光纤预制棒平均价格
图:2010-2017年中国光纤预制棒进出口价格
表:中国光纤预制棒主要生产企业股东构成及使用技术
表:2013-2018年中国主要光纤预制棒企业产能
表:2013-2018年中国主要光纤预制棒企业光棒产量
图:光纤及光缆主要结构及生产过程
图:2010-2017年全球及中国光纤产量
图:2010-2017年全球和中国光缆产量
图:2014-2018年全球主要地区光纤需求量占比
图:2020年全球主要地区光纤光缆需求
图:2010-2018年全球主要三大地区光纤光缆需求量
图:2014-2022年全球(分地区)海底光缆收入
图:2008-2020年美国光缆市场需求规模
图:美国光缆市场出口额及同比增长
图:2014-2017年全球光纤价格趋势
表:2017年全球光纤光缆最具竞争力企业TOP10
图:2011-2023年中国光纤光缆需求量及同比增速
图:2017年中国主要电信运营商集中采购情况
图:2013-2017年中国三大电信运营商已完成集采金额
图:2012-2018年中国光纤价格走势(元/芯公里)
表:2017年中国主要企业(分运营商)光纤市场份额
表:2017年中国主要企业(分运营商)光缆市场份额
图:2009-2018年康宁营业收入与净利润
表:2013-2018年康宁公司(分产品)营业收入及构成
表:2013-2017年康宁公司(分地区/国家)营业收入及构成
图:2009-2018年康宁研发投入与占比
图:2011-2017年康宁电信业务部(分产品)营业收入
图:2009-2017年康宁公司在中国营业收入及占比
图:FY2008-FY2018年住友电工销售额及净利润
图:FY2008-FY2018年住友电工(分业务)销售额
图:2018财年住友电工(分业务)战略
图:FY2008-FY2017年住友电工(分地区)销售额
图:2013-2022财年住友电工研发投入
图:2016-2018财年住友电工(分业务)研发投入
图:2022年住友电工发展目标
图:2022年住友电工(分业务)营业利润构成
图:2022年住友电工(分业务)下一代研发策略
图:2013-2018财年住友电工信息与通信业务销售额
图:2020财年住友电工电工信息与通信业务发展策略
图:2011-2017财年住友电工在华销售额
图:2009-2017年成都中住光纤营业收入
表:2018年信越化工(分部门)产品
图:2018年信越化工(分事业部/分地区)工厂分布
图:2010-2017财年信越化工营业收入与净利润
图:2013-2017财年信越化工(分业务)销售额构成
表:2013-2017财年信越化工(分地区)销售额及构成
图:2009-2017财年信越化工电子与功能材料部门营业收入与营业利润
图:FY2016-FY2018年信越化工电子与功能材料部门投资情况
图:FY2012-FY2017财年信越化工在中国营业收入及占比
表:信越化工在华新设的光纤预制棒合资公司概况
图:2009-2018财年日本藤仓销售额与净利润
表:2013-2017财年藤仓(分业务)销售额及构成
图:2018财年日本藤仓主要布局
表:2012-2017财年日本藤仓(分地区)销售额及构成
图:2012-2017财年日本藤仓(分业务)研发投入
图:FY2016-FY2018E年藤仓Power & Telecommunications(分业务)销售额
图:2011-2017财年藤仓在华销售额
图:2011-2017年藤仓烽火光电材料公司营业收入与净利润
图:2018年普瑞斯曼股权结构
图:普瑞斯曼全球布局
图:普瑞斯曼业务格局
图:普瑞斯曼发展及收购历程
图:2007-2017年普瑞斯曼销售收入及净利润
图:2018Q1普瑞斯曼经营情况
图:截至2017年底普瑞斯曼全球研发中心分布
图:2017年普瑞斯曼(分业务)营业收入构成
图:2017年普瑞斯曼(分地区)营业收入构成
图:2015-2017年普瑞斯曼电信业务经营情况
图:2018Q1年普瑞斯曼电信业务经营情况
图: 2017年普瑞斯曼电信业务(分业务)销售额构成
图:2017年普瑞斯曼电信业务(分地区)销售额构成
图:普瑞斯曼电信业务结构及主要客户
图:2015-2017年通用电缆经营情况
表:截至2017年底普瑞斯曼在中国子公司分布
图:普瑞斯曼在华布局
图:2017财年古河电工全球布局
图:2020年古河电工业务规划
图:2020年古河电工全球布局规划
图:2010-2018财年古河电工净收入及营业利润
表:2016-2018财年古河电工(分业务)经营情况
表:2017-2020财年古河电工(分业务)经营数据预测
图:2018-2020财年古河电工(分业务)研发投入
图:2016-2017财年古河电工(分地区)销售额构成
图:FY2009-FY2017财年古河电工电信业务销售额及营业利润
图:2016-2018财年古河电工Communication 业务经营情况
图:2017-2025财年古河电工电信业务销售额目标
图:2018-2021财年古河电工扩大电信市场份额
图:古河电工Communication solutions 业务分布及子公司
表:FY2012-FY2015年古河电工电信业务(分产品)销售额及构成
图:古河电工光纤光缆产品应用
图:古河电工光纤发展趋势
图:古河电工光缆发展趋势
图:2018-2020财年古河电工光纤光缆业务扩能
图:2016-2018年古河电工光纤业务主要生产基地及在建项目
图:特恩驰全球布局
图:2009-2017年特恩驰营业收入与净利润
表:2012-2017年特恩驰(分业务)收入构成
表:2012-2017年特恩驰(分产品)收入
图:2016-2017年特恩驰(分产品)收入构成
图:2012-2017年特恩驰(分地区)收入构成
图:2008-2017年特恩驰研发投入与占比
图:2016-2017年特恩驰公司电信部门(分业务)销售额构成及业务模式
图:截至2017年底特恩驰在中国子公司分布
图:长飞光纤光缆公司业务结构
图:2007-2017年长飞光纤光缆公司营业收入与净利润
表:2015-2017年长飞光纤光缆公司(分产品)主营业务收入
图:2011-2017年长飞光纤光缆公司(分产品)营业收入构成
图:2011-2017年长飞光纤光缆公司(分地区)营业收入
图:2011-2017年长飞光纤光缆公司(分产品)毛利率
图:2013-2017年长飞光纤光缆公司研发支出与占比
图:2006-2017年长飞光纤光缆公司光纤预制棒产量及增速
表:长飞光纤光缆公司潜江科技园光纤预制棒及光纤项目
表:长飞光纤光缆公司主要原材料供应商
表:2015-2017年长飞光纤光缆公司(分产品)自产与外购产销量
表:2015-2017年长飞光纤光缆公司(分产品)自产与外购销量
图:亨通光电全球营销网络
图:2008-2017年亨通光电营业收入与净利润
表:2012-2018年亨通光电(分产品)产销量及产销率
表:2017年亨通光电(分产品)营业收入、营业成本和毛利率
图:2011-2017年亨通光电光通信产品毛利率
图:2009-2017年亨通光电(分地区)营业收入
图:2017年亨通光电海外业务布局
图:2009-2017年亨通光电研发费用及占比
图:2010-2018年亨通光电光纤预制棒产能
图:2010-2017年亨通光电光纤预制棒产量与销量
表:2013-2018年亨通光电光棒外购及自供数量
表:2010-2018年亨通光电光纤预制棒扩产历程
图:中天科技主营业务布局历程
图:2009-2017年中天科技营业收入与净利润
表:2016-2017年中天科技(分业务)主营业务收入及毛利率
图:2008-2017年中天科技(分地区)营业收入
图:2009-2017年中天科技研发费用及占比
图:2012-2020年中天科技光纤预制棒产能
图:2010-2017年中天科技光纤预制棒产量
表:2015-2018年中天科技光纤光缆产品产能、产销量
表:烽火通信主要发展历程
图:烽火通信业务及子公司分布
图:2008-2017年烽火通信营业收入和净利润
图:2008-2017年烽火通信(分产品)营业收入
图:2017年烽火通信(分业务)营业收入构成
图:2008-2017年烽火通信(分地区)营业收入
图:2008-2017年烽火通信(分产品)毛利率
图:2011-2017年烽火通信研发投入及占比
表:2015-2017年烽火通信主要光纤预制棒生产公司净利润
图:2010-2017年烽火通信光纤预制棒产量
图:2018年富通集团股权结构
图:富通集团生产基地分布
图:2009-2018年富通集团营业收入与净利润
图:富通集团全球营销网络
图:2010-2018年富通集团(分业务)主营业务收入
图:2009-2018年富通集团(分业务)毛利率
表:2014-2017年富通集团(分产品)营业收入、毛利润和毛利率
表:2014-2017年富通集团光通信业务(分产品)产能与产量
表:2014-2017年富通集团光通信业务(分产品)销量与销售价格
表:2018年富通集团主要在建项目
表:富通集团光纤预制棒生产基地
图:2009-2018年富通集团光纤预制棒产能及产量
表:2015-2017年富通集团光纤预制棒进口量及进口金额
图:2011-2017年富通集团光纤预制棒均价
表:2013-2018年富通集团光纤预制棒前五大供应商采购金额及占比
图:2018年普法公司股权结构
图:2013-2017年普法公司营业收入与净利润
图:2006-2017年普法公司光纤预制棒产能与产量
图:2017年全球主要光纤预制棒企业市场份额
图:2017-2018年中国光纤预制棒企业竞争格局
表:2017年中国主要光纤预制棒生产企业经营情况
图:2017-2023年中国光纤预制棒产量与需求量
Optical Fiber Preform Mandrel and Cladding Diagram
Comparison of Optical Fiber Preform Mandrel Processes
Optical Fiber Preform Mandrel Process Distribution Proportion, 2017
Comparison of Optical Fiber Preform Mandrel Processes in China
Optical Fiber Preform Industry Chain
Cost Structure of Optical Fiber Preform in China
Downstream Industrial Chain of Optical Fiber Preform
Global Capacity and Output of Optical Fiber Preform, 2013-2023E
Global Demand for Optical Fiber Preform, 2013-2023E
Global Optical Fiber Preform Capacity and Market Share (by Country/Region), 2014-2018
Global Demand for Optical Fiber Preform (by Country/Region), 2010-2018
Optical Fiber Preform Capacity, Output and Demand in USA, 2010-2017
USA’s Export of Optical Fiber Preform, 2010-2017
Optical Fiber Preform Capacity, Output and Demand in Japan, 2010-2017
Japan’s Export of Optical Fiber Preform, 2010-2017
Prices of Optical Fiber Preform Worldwide, 2000-2018
Policies on Optical Fiber Preform in China, 2010-2018
Anti-dumping Results of Optical Fiber Preform in China, 2018
Development Course of Optical Fiber Preform in China
Optical Fiber Preform Output and YoY Growth in China, 2008-2018
Key Optical Fiber Preform Projects Planned and under Construction in China, 2018
Optical Fiber Preform Demand and YoY Growth in China, 2010-2018
Optical Fiber Preform Self-sufficiency in China, 2007-2018
Optical Fiber Preform Import Volume and YoY Growth in China, 2010-2017
Structure of China’s Optical Fiber Preform Import Volume (by Country), 2013-2017
Optical Fiber Preform Import Value and YoY Growth in China, 2010-2017
Optical Fiber Preform Export Volume and YoY Growth in China, 2010-2017
Structure of China’s Optical Fiber Preform Export Volume (by Country), 2013-2017
Optical Fiber Preform Export Value and YoY Growth in China, 2010-2017
Price Trend of Germanium in China, 2010-2018
Average Price of Optical Fiber Preform in China, 2010-2018
Import and Export Prices of Optical Fiber Preform in China, 2010-2017
Shareholding Structure and Applied Technologies of Key Optical Fiber Preform Manufacturers in China
Optical Fiber Preform Capacity of Key Optical Fiber Preform Producers in China, 2013-2018
Optical Fiber Preform Output of Key Optical Fiber Preform Producers in China, 2013-2018
Structure and Manufacturing Process of Optical Fiber and Cable
Optical Fiber Output in China and Worldwide, 2010-2017
Optical Cable Output in China and Worldwide, 2010-2017
Global Optical Fiber Demand Structure in the World’s Major Regions, 2014-2018
Demand for Optical Fiber and Cable in the World’s Major Regions, 2020E
Demand for Optical Fiber and Cable in the World’s Major Three Regions, 2010-2018
Global Submarine Optical Cable Revenue by Region, 2014-2022E
Demand for Optical Cable in the United States, 2008-2020E
U.S. Optical Cable Exports and YoY Growth
Price Trend of Optical Fiber Worldwide, 2014-2017
Global Top10 Most Competitive Optical Fiber and Cable Enterprises, 2017
Optical Fiber and Cable Demand and YoY Growth in China, 2011-2023E
Centralized Purchasing by Major Chinese Telecom Carriers, 2017
Completed Centralized Purchase Amount of Three Chinese Telecom Carriers, 2013-2017
Optical Fiber Price Trend in China, 2012-2018 (RMB/core km)
Market Share of Optical Fiber Enterprises in China, 2017
Market Share of Optical Cable Enterprises in China, 2017
Revenue and Net Income of Corning, 2009-2018
Revenue Structure of Corning (by Product), 2013-2018
Revenue Structure of Corning (by Country/Region), 2013-2017
R&D Costs and % of Total Revenue of Corning, 2009-2018
Revenue Breakdown (by Product) of Corning’s Telecom Business Division, 2011-2017
Corning’s Revenue in China and As a Percentage of Total, 2009-2017
Revenue and Net Income of Sumitomo Electric, FY2008-FY2018
Revenue Breakdown (by Business) of Sumitomo Electric, FY2008-FY2018
Strategies (by Business) of Sumitomo Electric, FY2018
Revenue Breakdown (by Region) of Sumitomo Electric, FY2008-FY2017
R&D Costs of Sumitomo Electric, FY2013-FY2022
R&D Expenditure of Sumitomo Electric (by Business), FY2018
Development Goals of Sumitomo Electric, FY2022
Operating Income Structure of Sumitomo Electric (by Business), FY2022
R&D Strategies of Sumitomo Electric (by Business), FY2022
Sumitomo Electric’s Revenue from Information and Communications Business, FY2013-FY2018
Development Strategy of Sumitomo Electric’s Information and Communications Business, FY2020
Sumitomo Electric’s Revenue in China, FY2011-FY2017
Revenue of Chengdu SEI Optical Fiber Co., Ltd., 2009-2017
Products of Shin-Etsu Chemical (by Division), 2018
Shin-Etsu Chemical’s Plants by Business Division/by Region, 2018
Revenue and Net Income of Shin-Etsu Chemical, FY2010-FY2017
Revenue Structure of Shin-Etsu Chemical by Business, FY2013-FY2017
Revenue Structure of Shin-Etsu Chemical by Region, FY2013-FY2017
Revenue and Operating Income of Shin-Etsu Chemical’s Electronic and Functional Materials Division, FY2009-FY2017
Investment of Shin-Etsu Chemical’s Electronic and Functional Materials Division, FY2016-FY2018
Shin-Etsu Chemical’s Revenue in China and As a Percentage of Total, FY2012-FY2017
Overview of Shin-Etsu Chemical’s New Optical Fiber Preform Joint Ventures in China
Revenue and Net Income of Fujikura, FY2009-FY2018
Revenue Structure of Fujikura by Business, FY2013-FY2017
Fujikura’s Business Layout, FY2018
Revenue Structure of Fujikura by Region, FY2012-FY2017
Fujikura’s R&D Costs by Business, FY2012-FY2017
Fujikura’s Power & Telecommunications Revenue by Business, FY2016-FY2018E
Fujikura’s Revenue in China, FY2011-FY2017
Revenue and Net Income of Fujikura FiberHome Opto-Electronic Material Technology, 2011-2017
Equity Structure of Prysmian, 2018
Global Presence of Prysmian
Business Structure of Prysmian
Development Course and Acquisitions of Prysmian
Revenue and Net Income of Prysmian, 2007-2017
Business Performance of Prysmian, 2018Q1
Global R&D Centers of Prysmian by the End of 2017
Revenue Structure of Prysmian by Business, 2017
Revenue Structure of Prysmian by Region, 2017
Performance of Prysmian’s Telecommunications Business, 2015-2017
Performance of Prysmian’s Telecommunications Business, 2018Q1
Telecommunications Business Revenue of Prysmian by Business, 2017
Telecommunications Business Revenue of Prysmian by Region, 2017
Telecommunications Business Structure and Key Clients of Prysmian
Performance of Prysmian’s General Cable Business, 2015-2017
Prysmian’s Subsidiaries in China by the End of 2017
Prysmian’s Presence in China
Global Presence of Furukawa Electric, FY2017
Business Planning of Furukawa Electric, 2020E
Furukawa Electric’s Planning for Global Operations, 2020E
Net Revenue and Operating Income of Furukawa Electric, FY2010-FY2018
Revenue of Furukawa Electric by Business, FY2016-FY2018
Revenue Forecast of Furukawa Electric by Business, FY2017-FY2020E
R&D Expenses of Furukawa Electric by Business, FY2018
Revenue Structure of Furukawa Electric by Region, FY2016-FY2017
Revenue and Operating Income of Furukawa Electric’s Communications Solutions, FY2009-FY2017
Business Performance of Furukawa Electric’s Communications Solutions, FY2016-FY2018
Sales Target of Furukawa Electric’s Communications Solutions, FY2017-2025E
Furukawa Electric’s Communications Market Growth, FY2018-FY2021E
Furukawa Electric’s Communications Solutions and Related Subsidiaries
Revenue Structure of Furukawa Electric’s Communications Solutions by Product, FY2012-FY2015
Application of Optical Fiber and Optical Cable Products of Furukawa Electric
Optical Fiber Development Trends of Furukawa Electric
Optical Cable Development Trends of Furukawa Electric
Optical Fiber and Cable Business Expansion of Furukawa Electric, FY2018-FY2020E
Main Optical Fiber Production Bases and Projects under Construction of Furukawa Electric, 2016-2018
Global Presence of TKH
Revenue and Net Income of TKH, 2009-2017
Revenue Structure of TKH by Business, 2012-2017
Revenue of TKH by Product, 2012-2017
Revenue Structure of TKH by Product, 2016-2017
Revenue Structure of TKH by Region, 2012-2017
R&D Expenditure of TKH, 2008-2017
Revenue and Business Model of TKH’s Telecom Division by Business, 2016-2017
TKH’s Subsidiaries in China by the End of 2017
Business Structure of YOFC
Revenue and Net Income of YOFC, 2007-2017
Revenue Breakdown of YOFC by Product, 2015-2017
Revenue Structure of YOFC by Product, 2011-2017
Operating Revenue of YOFC by Region, 2011-2017
Gross Margin of YOFC by Product, 2011-2017
R&D Costs and % of Total Revenue of YOFC, 2013-2017
Optical Fiber Preform Output and Growth Rate of YOFC, 2006-2017
Optical Fiber Preform and Optical Fiber Projects of YOFC in Qianjiang Science Park
Key Suppliers of Raw Materials for YOFC
Self-produced and Outsourced Output and Sales Volume of YOFC (by Product), 2015-2017
Self-produced and Outsourced Sales Volume of YOFC (by Product), 2015-2017
Global Marketing Network of Hengtong Optic-Electric
Revenue and Net Income of Hengtong Optic-Electric, 2008-2017
Output, Sales and Sales-Output Ratio of Hengtong Optic-Electric by Product, 2012-2018
Revenue, Operating Cost and Gross Margin of Hengtong Optic-Electric by Product, 2017
Gross Margin of Hengtong Optic-Electric’s Optical Communications Products, 2011-2017
Revenue of Hengtong Optic-Electric by Region, 2009-2017
Overseas Operations of Hengtong Optic-Electric, 2017
R&D Costs and % of Total Revenue of Hengtong Optic-Electric, 2009-2017
Optical Fiber Preform Capacity of Hengtong Optic-Electric, 2010-2018
Optical Fiber Preform Output and Sales of Hengtong Optic-Electric, 2010-2017
Optical Fiber Preform Procurement and Self-Supply Quantity of Hengtong Optic-Electric, 2013-2018
Optical Fiber Preform Capacity Expansion History of Hengtong Optic-Electric, 2010-2018
Evolution of ZTT’s Primary Business
Revenue and Net Income of ZTT, 2009-2017
Operating Revenue and Gross Margin of ZTT by Business, 2016-2017
Revenue of ZTT by Region, 2008-2017
R&D Costs and % of Total Revenue of ZTT, 2009-2017
Optical Fiber Preform Capacity of ZTT, 2012-2020E
Optical Fiber Preform Output of ZTT, 2010-2017
Capacity, Output and Sales of Optical Fiber and Cable Products of ZTT, 2015-2018
Milestones of FiberHome
Business and Subsidiaries of FiberHome
Revenue and Net Income of FiberHome Technologies, 2008-2017
Revenue of FiberHome Technologies by Product, 2008-2017
Revenue Structure of FiberHome Technologies by Business, 2017
Revenue of FiberHome Technologies by Region, 2008-2017
Gross Margin of FiberHome Technologies by Product, 2008-2017
R&D Costs and % of Total Revenue of FiberHome Technologies, 2011-2017
Net Income of Major Optical Fiber Preform Manufacturing Companies of FiberHome Technologies, 2015-2017
Optical Fiber Preform Output of FiberHome Technologies, 2010-2017
Equity Structure of Futong Group, 2018
Distribution of Futong Group’s Production Bases
Revenue and Net Income of Futong Group, 2009-2018
Global Marketing Network of Futong Group
Operating Revenue of Futong Group by Business, 2010-2018
Gross Margin of Futong Group by Business, 2009-2018
Revenue, Gross Profit and Gross Margin of Futong Group, 2014-2017
Capacity and Output of Futong Group’s Optical Communications Business by Product, 2014-2017
Sales and Selling Prices of Futong Group’s Optical Communications Business by Product, 2014-2017
Key Projects under Construction of Futong Group, 2018
Optical Fiber Preform Manufacturing Bases of Futong Group
Optical Fiber Preform Capacity and Output of Futong Group, 2009-2018
Import Volume and Value of Optical Fiber Preform of Futong Group, 2015-2017
Average Prices of Optical Fiber Preform of Futong Group, 2011-2017
Futong Group’s Procurement of Raw Materials for Optical Fiber Preform from Top 5 Suppliers and % of Total Procurement, 2013-2018
Equity Structure of Potevio Fasten Optical Communication, 2018
Revenue and Net Income of Potevio Fasten Optical Communication, 2013-2017
Optical Fiber Preform Capacity and Output of Potevio Fasten Optical Communication, 2006-2017
Market Shares of World’s Major Optical Fiber Preform Companies, 2017
Competitive Landscape of China Optical Fiber Preform Market, 2017-2018
Operation of Key Optical Fiber Preform Producers in China, 2017
Optical Fiber Preform Output and Demand in China, 2017-2023E
如果这份报告不能满足您的要求,我们还可以为您定制报告,请 留言说明您的详细需求。
|