|
|
|
报告导航:研究报告—
制造业—材料
|
|
2018-2023年全球及中国石墨烯行业研究报告 |
 |
字数:4.9万 |
页数:152 |
图表数:154 |
|
中文电子版:9000元 |
中文纸版:7200元 |
中文(电子+纸)版:9500元 |
|
英文电子版:2800美元 |
英文纸版:3000美元 |
英文(电子+纸)版:3100美元 |
|
编号:ZHP079
|
发布日期:2018-10 |
附件:下载 |
 |
|
|
石墨烯作为新材料,目前尚处在研发和产业化布局阶段,全球各国都在积极进行专利布局。2017年,全球石墨烯专利申请量为13371件,同比增长30.7%;2010-2017年的年均复合增长率为60.9%。
目前,石墨烯产业规模尚小,但增速大。2017年全球石墨烯市场规模约8500万美元,同比增长84.8%(近两年石墨烯相继在防腐涂料、储能等领域实现批量出货,推动产业高速发展);预计2018年可接近2亿美元。未来随着研发技术的进步,应用的推广,市场规模将实现快速增长,预计2023年可突破10亿美元。
中国石墨烯产业综合实力排名全球第一。2017年中国石墨烯市场规模1.27亿元(约1881万美元,按1:6.75的汇率折算),全球占比22.1%,同比增长69.3%;预计2018年在2.30亿元左右。未来在国家政策支持、新进企业增多等因素的带动下,预计2023年市场规模可突破13亿元。
目前,中国石墨烯主要应用在锂电池、超级电容等领域。2017年锂电池用石墨烯的需求占比在50.0%以上。未来,随着石墨烯在新能源、复合材料、可穿戴、热管理以及节能环保等领域的应用推广,锂电池领域的需求占比会进一步下滑。
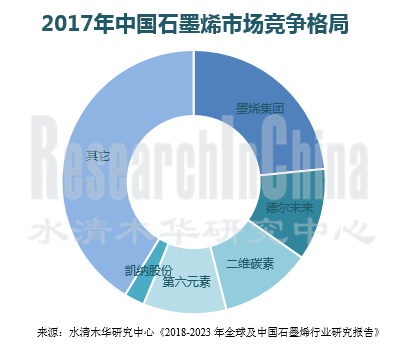
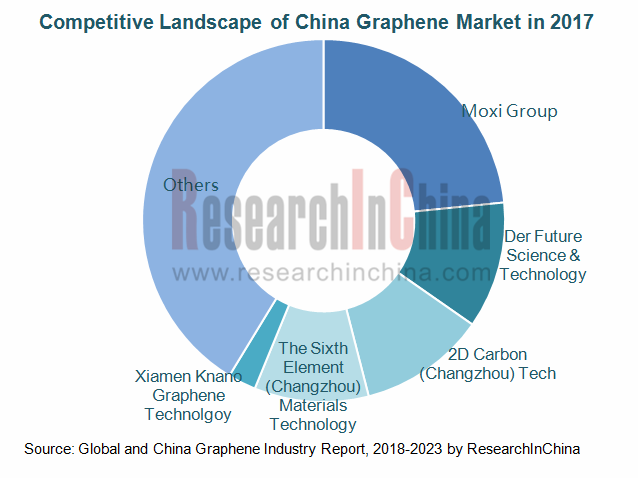
全球石墨烯生产企业主要集中在美国、中国、英国等地。其中,中国厂商数量最多,在4000家以上,但多以小型、初创企业为主,大中型企业相对较少,主要包括墨烯集团、第六元素、二维碳素、德尔未来、青岛昊鑫等。
目前,中国石墨烯市场集中度相对较高,2017年CR5为58.7%。其中墨烯集团作为中国最大的石墨烯制造商,下辖宁波墨西、重庆墨希等生产企业,2017年市场占比为23.4%。
水清木华研究中心《2018-2023年全球及中国石墨烯行业研究报告》着重研究了以下内容:
 石墨烯定义、性能、制备方法、发展历程、产业链等情况; 石墨烯定义、性能、制备方法、发展历程、产业链等情况;
全球石墨烯发展现状、市场规模、市场价格、产业化前景、专利现状等情况;
中国石墨烯政策环境、发展现状、专利、企业布局等情况
石墨烯上游(石墨、甲烷等)、下游(锂电池、超级电容、透明电极、集成电路等)市场发展现状、石墨烯应用等情况;
国外19家、中国16家石墨烯生产商经营情况、石墨烯业务等情况。
Graphene, a kind of new material, is still being developed and ready to be commercialized for the moment. Many countries are zealously competing for patents. In 2017, there were a total of 13,371 patent filings about graphene worldwide, an upsurge of 30.7% over the previous year, and with a CAGR of 60.9% between 2010 and 2017.
Although with a small size, the graphene industry is progressing apace. Before reaching nearly USD200 million in 2018, global graphene market size stood at roughly USD85 million in 2017, soaring by 84.8% year on year inasmuch as graphene found massive application in fields like anticorrosive paint and energy storage over the past two years, and is expected to surpass USD1 billion in 2023 in the wake of progresses in R&D technologies and application.
China ranks first by comprehensive strength in global graphene industry. The graphene market of China was recorded at RMB127 million (approximately USD18.81 million by an exchange rate of 1 dollar to 6.75 yuan) in 2017, a year-on-year upsurge of 69.3%, taking a 22.1% share in global market, and will climb to estimated RMB230 million in 2018 and outnumber RMB1.3 billion in 2023 with the support from national policies and a growing number of new entrants in the graphene sector.
Graphene gets utilized primarily in lithium battery and super capacitor currently in China. In 2017, the demand for graphene from lithium battery comprised more than 50.0% of the total, but will see a decreasing proportion in the future as graphene is increasingly used in new energy, composite materials, wearables, thermal management, energy conservation and environmental protection.
The global graphene manufacturers cluster in UK, China and the United States. Among them, China boasts the most manufacturers, namely over 4,000 ones, but most of which are small start-ups, while medium and large-sized enterprises mainly include Moxi Group, The Sixth Element (Changzhou) Materials Technology, 2D Carbon (Changzhou) Tech, Der Future Science & Technology, and Qingdao HaoXin New Energy Technology.
Now, Chinese graphene market is highly concentrated, with the CR5 of 58.7% in 2017. As the largest producer of graphene in China, Moxi Group have subsidiaries like Ningbo Morsh Technology and Chongqing Graphene Tech. In 2017, it seized the market share of 23.4%.
Global and China Graphene Industry Report, 2018-2023 focuses on the following:
 Graphene (definition, performance, preparation methods, development course, industrial chain); Graphene (definition, performance, preparation methods, development course, industrial chain);
Global grapheme industry (development status quo, market size, prices, prospects of industrialization, patents, etc.);
China’s grapheme industry (policy climate, current development, patents, enterprises’ forays, etc.);
Upstream (graphite, methane, etc.) and downstream (lithium battery, super capacitor, transparent electrode, integrated circuit, etc.) markets of grapheme, applications of grapheme, etc.;
19 foreign and 16 Chinese graphene manufacturers (operation, graphene business, etc.)
第一章 石墨烯行业概述
1.1 定义
1.2 性能
1.3 制备方法
1.4 发展历程
1.5 发展瓶颈
1.6 产业链
第二章 全球石墨烯行业发展分析
2.1 发展现状
2.2 市场规模
2.3 市场价格
2.4 产业化前景
2.5 专利现状
2.5.1 总量
2.5.2 结构
2.5.3 主要国家专利情况
2.5.4 主要公司的专利情况
2.6 竞争力分析
第三章 中国石墨烯行业发展分析
3.1 政策环境
3.2 发展现状
3.2.1 石墨烯粉体
3.2.2 石墨烯薄膜
3.3 产业化发展
3.3.1 石墨烯产学研联合
3.3.2 石墨烯产业园区
3.3.3 专利
3.4 企业布局
第四章 上游产业
4.1 石墨
4.2 其它
4.2.1 甲烷
4.2.2 乙醇
第五章 下游应用产业
5.1 锂电池
5.1.1 石墨烯在锂电池领域的应用
5.1.2 市场现状
5.2 超级电容
5.2.1 石墨烯在超级电容领域的应用
5.2.2 市场现状
5.3 透明电极
5.3.1 石墨烯在透明电极领域的应用
5.3.2 市场现状
5.4 集成电路
5.5 其它
5.5.1 聚酯基复合材料
5.5.2 导电油墨
5.5.3 散热材料
第六章 全球石墨烯主要生产企业
6.1 Northern Graphite
6.1.1 企业简介
6.1.2 经营情况
6.1.3 石墨烯业务
6.2 CVD
6.2.1 企业简介
6.2.2 经营情况
6.2.3 石墨烯业务
6.3 Focus Graphite
6.3.1 企业简介
6.3.2 经营情况
6.3.3 石墨烯业务
6.4 Lomiko Metals
6.4.1 企业简介
6.4.2 经营情况
6.4.3 石墨烯业务
6.5 Applied Graphene Materials
6.5.1 企业简介
6.5.2 经营情况
6.5.3 石墨烯业务
6.6 Graphene NanoChem Plc
6.6.1 企业简介
6.6.2 经营情况
6.6.3 石墨烯业务
6.7 Haydale Graphene Industries
6.7.1 企业简介
6.7.2 经营情况
6.7.3 营收构成
6.7.4 石墨烯业务
6.8 Other Enterprises
6.8.1 Graphene Laboratories
6.8.2 Graphenea
6.8.3 Graphene Square
6.8.4 Grafoid
6.8.5 XG Sciences Inc
6.8.6 BGT Materials Limited
6.8.7 Angstron Materials
6.8.8 Graphenano
6.8.9 Vorbeck Materials
6.8.10 CambridgeNanosystems
6.8.11 GRAPHENEFRONTIERS
6.8.12 GraphenePlatform Corp
第七章 中国石墨烯主要生产企业
7.1 第六元素
7.1.1 企业简介
7.1.2 经营情况
7.1.3 石墨烯业务
7.2 二维碳素
7.2.1 企业简介
7.2.2 经营情况
7.2.3 研发
7.2.4 石墨烯业务
7.3 墨烯集团
7.3.1 企业简介
7.3.2 宁波墨西科技
7.3.3 重庆墨希科技
7.4 方大炭素
7.4.1 企业简介
7.4.2 经营情况
7.4.3 研发与在建项目
7.4.4 石墨烯业务
7.5 德尔未来
7.5.1 企业简介
7.5.2 经营情况
7.5.3 研发与在建项目
7.5.4 石墨烯业务
7.6 康得新
7.6.1 企业简介
7.6.2 经营情况
7.6.3 研发与在建项目
7.6.4 石墨烯业务
7.7 凯纳股份
7.7.1 企业简介
7.7.2 经营情况
7.7.3 石墨烯业务
7.8 其他
7.8.1 先丰纳米
7.8.2 吉仓纳米
7.8.3 普兰纳米
7.8.4 中超石墨烯
7.8.5 常州瑞丰特
7.8.6 东旭光电
7.8.7 华高墨烯
7.8.8 圣泉集团
7.8.9 青岛昊鑫
1 Overview of Graphene
1.1 Definition
1.2 Performance
1.3 Preparation Method
1.4 Development History
1.5 Development Bottleneck
1.6 Industry Chain
2 Global Graphene Industry
2.1 Status Quo
2.2 Market Size
2.3 Market Price
2.4 Industrialization Prospects
2.5 Patents
2.5.1 Total Filings
2.5.2 Structure
2.5.3 Patent Filings in Major Countries
2.5.4 Patent Filings of Major Companies
2.6 Competitiveness Analysis
3 Chinese Graphene Industry
3.1 Policy Environment
3.2 Current Situation
3.2.1 Graphene Powder
3.2.2 Graphene Film
3.3 Industrialization Development
3.3.1 Industry-University-Research Collaboration
3.3.2 Industrial Park
3.3.3 Patents
3.4 Enterprises’ Layout
4 Upstream Sectors
4.1 Graphite
4.2 Others
4.2.1 Methane
4.2.2 Ethanol
5 Downstream Applications
5.1 Lithium Battery
5.1.1 Graphene Application
5.1.2 Market Situation
5.2 Supercapacitor
5.2.1 Graphene Application
5.2.2 Market Situation
5.3 Transparent Electrode
5.3.1 Graphene Application
5.3.2 Market Situation
5.4 Integrated Circuit
5.5 Others
5.5.1 Polyester-based Composites
5.5.2 Electrically Conductive Printing Ink
5.5.3 Heat Dissipating Material
6 Major Global Graphene Manufacturers
6.1 Northern Graphite
6.1.1 Profile
6.1.2 Operation
6.1.3 Graphene Business
6.2 CVD
6.2.1 Profile
6.2.2 Operation
6.2.3 Graphene Business
6.3 Focus Graphite
6.3.1 Profile
6.3.2 Operation
6.3.3 Graphene Business
6.4 Lomiko Metals
6.4.1 Profile
6.4.2 Operation
6.4.3 Graphene Business
6.5 Applied Graphene Materials
6.5.1 Profile
6.5.2 Operation
6.5.3 Graphene Business
6.6 Graphene NanoChem Plc
6.6.1 Profile
6.6.2 Operation
6.6.3 Graphene Business
6.7 Haydale Graphene Industries
6.7.1 Profile
6.7.2 Operation
6.7.3 Revenue Structure
6.7.4 Graphene Business
6.8 Other Enterprises
6.8.1 Graphene Laboratories
6.8.2 Graphenea
6.8.3 Graphene Square
6.8.4 Grafoid
6.8.5 XG Sciences Inc
6.8.6 BGT Materials Limited
6.8.7 Angstron Materials
6.8.8 Graphenano
6.8.9 Vorbeck Materials
6.8.10 CambridgeNanosystems
6.8.11 GRAPHENEFRONTIERS
6.8.12 GraphenePlatform Corp
7. Key Chinese Players
7.1 The Sixth Element (Changzhou) Materials Technology Co., Ltd.
7.1.1 Profile
7.1.2 Operation
7.1.3 Graphene Business
7.2 2D Carbon (Changzhou) Tech Inc., Ltd.
7.2.1 Profile
7.2.2 Operation
7.2.3 R&D
7.2.4 Graphene Business
7.3 Beijing Moxi Holding Group Co., Ltd.
7.3.1 Profile
7.3.2 Ningbo Morsh Technology Co., Ltd.
7.3.3 Chongqing Graphene Tech. Co., Ltd.
7.4 Fangda Carbon New Material Co., Ltd.
7.4.1 Profile
7.4.2 Operation
7.4.3 R&D and Projects under Construction
7.4.4 Graphene Business
7.5 Der Future Science & Technology Holding Group Co., Ltd.
7.5.1 Profile
7.5.2 Operation
7.5.3 R&D and Projects under Construction
7.5.4 Graphene Business
7.6 Kangdexin Composite Material Group Co., Ltd.
7.6.1 Profile
7.6.2 Operation
7.6.3 R&D and Projects under Construction
7.6.4 Graphene Business
7.7 Xiamen Knano Graphene Technology Co., Ltd.
7.7.1 Profile
7.7.2 Operation
7.7.3 Graphene Business
7.8 Others
7.8.1 Nanjing XFNANO Materials Tech Co., Ltd.
7.8.2 JCNANO Tech Co., Ltd.
7.8.3 Tianjin Plannano Energy Technologies Co., Ltd.
7.8.4 Changzhou Zhongchao Graphene Power Technology Co., Ltd.
7.8.5 Changzhou Ruifengte Technology Co., Ltd.
7.8.6 Dongxu Optoelectronic Technology Co., Ltd.
7.8.7 Qingdao Huagao Graphene Technology Corp. Ltd.
7.8.8 Shengquan Group
7.8.9 Qingdao Haoxin New Energy Technology Corporation
表:石墨烯种类
表:石墨烯性能
图:常见导电体导电率对比
图:常见半导体载流子迁移率对比
图:常见散热材料导热系数
表:四种石墨烯制备方法对比
表:石墨烯发展历程
图:石墨烯产业链
图:石墨烯产业链竞争格局
表:全球主要国家CVD制备方法研发进展
图:2016-2023年全球石墨烯市场规模
图:2017/2023年全球石墨烯(分产品)市场规模构成
图:2017年全球石墨烯(分行业)需求结构
图:2011/2018年全球石墨烯粉末市场价格
图:2012-2022年全球石墨烯导电膜市场价格
图:石墨烯产业化进程
图:2015-2025年石墨烯产业化路线图
表:海外国家开展石墨烯相关的研发项目与资助情况
表:全球主要石墨烯制备企业
图:2009-2018年全球石墨烯专利申请数量
图:2017年全球石墨烯(分地区)专利数量构成
图:2017年全球主要国家石墨烯专利技术布局
图:全球主要国家石墨烯专利布局重点
图:2009-2018年美国石墨烯专利申请量
图:2009-2018年韩国石墨烯专利申请量
图:2009-2018年欧洲石墨烯专利申请量
图:全球主要国家石墨烯专利技术流向
图:2009-2018年三星集团石墨烯专利申请量
图:2017年三星集团石墨烯专利应用结构
图:2011-2018年LG公司石墨烯专利申请量
图:2017年LG公司石墨烯专利应用结构
图:2009-2018年IBM公司石墨烯专利申请量
图:2017年全球石墨烯指数(竞争潜力)排名
图:2017年全球石墨烯指数(竞争行为)排名
图:2017年全球石墨烯指数(竞争绩效)排名
表:2012-2018年中国主要石墨烯政策
表:2017年获得政府补助的企业
图:石墨烯产业波特五力模型分析
图:2009-2017年中国石墨烯论文发表数量
图:2016-2023年中国石墨烯市场规模
图:2017年中国石墨烯市场结构
图:石墨烯粉体的制备过程
表:中国石墨烯粉体产品主要生产商
图:2017年中国主要石墨烯粉体生产商产能
表:中国石墨烯薄膜产品主要生产商
图:中国主要石墨烯产业园区分布
图:2009-2018年中国石墨烯专利申请数量
图:2017年中国石墨烯专利分布
图:2017年中国石墨烯专利全球应用布局
表:中国主要石墨烯生产商
表:中国主要生产企业石墨烯业务布局
图:2017年中国石墨烯企业竞争格局
图:用石墨制备石墨烯的方法
图:2017年全球石墨储量分布
表:2012-2017年全球主要国家和地区石墨产量
图:2017-2018年中国乙醇价格
表:全球主要石墨烯下游应用厂商
表:不同锂电池导电添加剂电阻率
表:不同类型的负极材料的储锂能力
表:锂电池用石墨烯研究进展
图:2017年全球主要锂电池负极材料市场份额
表:2017年全球主要锂电池负极材料市场份额
表:2017/2023年中国锂电池领域用石墨烯市场规模
图:2012-2023年全球锂电池市场规模
图:2013-2023年全球锂电池市场需求
图:2016-2023年全球锂电池负极材料需求量
图:2017年全球锂电池市场竞争格局
图:2011-2023年中国锂电池销量及市场规模
图:2012-2023年中国锂电池负极材料出货量
图:2007-2017年中国锂电池出口量及出口额
表:中国主要锂电池制造商
图:石墨烯超级电容器上的应用
表:超级电容器电极材料参数对比
图:石墨烯超级电容器研发热点
表:石墨烯在超级电容器领域主要进展
图:2015-2023年中国超级电容器用石墨烯市场规模
图:2015-2023年全球超级电容器市场规模
图:2012-2023年中国超级电容器市场规模及增速
表:石墨烯在触摸屏领域主要进展
图:2012-2023年全球触控面板出货量
图:2010-2023年全球LCD出货量
图:2010-2018年中国触控面板(分产品)出货量
图:2008-2018年中国LCD TV出货量
图:2011-2023年全球集成电路市场规模
图:2014-2023年中国集成电路市场规模
图:石墨烯在聚酯基复合材料上的应用
表:关于石墨烯在散热材料领域应用的研究进展
图:2010-2018年Northern Graphite净利润
图:2010-2018年CVD营业收入与净利润
图:2013-2018年CVD公司(分业务)营业收入构成
图:2010-2017财年Focus Graphite公司净亏损
图:2010-2018年Lomiko Metals营业成本
图:Lomiko Metals 3D石墨烯专利
图:2015年Lomiko Metals公司石墨烯发展状况
图:Graphene ESD公司发展状况
图:Lomiko Metals公司石墨烯园分布
图:2011-2018财年Applie Graphene Materials公司营业收入与净利润
表:Applie Graphene Materials公司经营策略
图:Applie Graphene Materials公司客户
图:Applie Graphene Materials公司市场机遇
图:Graphene NanoChem Plc全球布局
图:2011-2017年Graphene NanoChem Plc营业收入与净利润
图:2011-2018财年Haydale总收入与净亏损
图:2014-2017财年Haydale公司(分地区)主营业务收入构成
图:Graphene 3D Lab投资亮点
图:Graphene 3D Lab发展规划
图:Graphene Square主要客户
图:2012-2018年第六元素营业收入与净利润
表:2014-2017年第六元素主要产品营业收入及占比
表:2017年第六元素前五大客户
表:2017年第六元素前五大供应商
表:第六元素石墨烯业务发展历程
表:第六元素石墨烯产品及应用
图:2013-2018年二维碳素营业收入与净利润
表:2016-2017年二维碳素(分产品)营业收入及构成
表:2013-2018年二维碳素研发支出与占比
图:2013-2017年二维碳素石墨烯透明薄膜产能及销售收入
图:二维碳素公司PET基底石墨烯膜产品数据
图:2014-2017年墨烯集团净利润
图:2013-2017宁波墨西石墨烯专利数量
表:宁波墨西主要石墨烯产品
表:重庆墨希主要石墨烯产品
图:2013-2017年重庆墨希石墨烯专利数量
图:2015年方大炭素(分产品)产能分布
图:2010-2017年方大炭素营业收入与净利润
图:2010-2017年方大炭素(分产品)营业收入构成
图:2010-2017年方大炭素(分地区)营业收入构成
图:2009-2017年方大炭素(分产品)毛利率
图:2011-2018年方大炭素研发投入及占比
图:2012-2018年德尔未来营业收入与净利润
图:2016-2018年德尔未来(分产品)营收构成
图:2014-2018年德尔未来(分地区)营业收入构成
图:2011-2018年德尔未来毛利率
图:2013-2018年德尔未来研发投入与占比
表:2017年德尔未来主要拟在建项目
表:德尔未来石墨烯业务发展历程
图:2010-2018年康得新营业收入与净利润
图:2013-2018年康得新(分产品)营业收入构成
图:2010-2018年康得新(分地区)营业收入构成
图:2011-2018年康得新毛利率
图:2011-2018年康得新研发投入与占比
表:凯纳股份主要产品及规格
图:2012-2018年凯纳股份营业收入与净利润
表:2016-2017年凯纳股份主要产品营业收入及占比
表:凯纳股份主要石墨烯专利情况
表:2018年凯纳股份石墨烯产能
图:先丰纳米石墨烯系列产品及规格
表:吉仓纳米主要石墨烯产品
表:普兰纳米主要石墨烯产品
表:东旭光电石墨烯产业发展历程
图:2014-2018年华高墨烯营业收入与净利润
图:2016-2017年华高墨烯(分产品)营业收入构成
图:2014-2018年圣泉集团新材料业务收入
图:2015-2018年青岛昊鑫营业收入及净利润
Types of Graphene
Performance of Graphene
Conductivity of Typical Electric Conductors
Carrier Mobility of Typical Semiconductors
Thermal Conductivity of Typical Heat Dissipation Materials
Four Preparation Methods of Graphene
Graphene Development History
Graphene Industry Chain
Competitive Landscape of Graphene Industry Chain
Progress in R&D of CVD Graphene Preparation in Major Countries Worldwide
Global Market Size of Graphene, 2016-2023E
Global Market Size of Graphene by Product, 2017/2023E
Demand Structure of Graphene Worldwide by Sector, 2017
Global Market Prices of Graphene Powder, 2011/2018
Global Market Prices of Graphene Conductive Film, 2012-2022E
Graphene Industrialization Process
Roadmap for Graphene Industrialization, 2015-2025E
Graphene-related R&D Projects and Grants in Foreign Countries
Major Global Graphene Preparation Enterprises
Distribution of Graphene Patent Fillings Worldwide, 2009-2018
Graphene Patents Structure Worldwide by Region, 2017
Proportion of Graphene Patents in Major Countries by Technology, 2017
Focuses of Graphene Patent Portfolios in Major Countries
Graphene Patent Filings in US, 2009-2018
Graphene Patent Filings in S.Korea, 2009-2018
Graphene Patent Filings in Europe, 2009-2018
Flows of Graphene Patent Technologies among Major Countries
Samsung’s Graphene Patent Fillings, 2009-2018
Samsung’s Graphene Patents Structure by Application, 2017
LG’s Graphene Patent Fillings, 2011-2018
LG’s Graphene Patents Structure by Application, 2017
IBM’s Graphene Patent Fillings, 2009-2018
Ranking of Global Graphene Index by Competitive Potential, 2017
Ranking of Global Graphene Index by Competitive Behavior, 2017
Ranking of Global Graphene Index by Competitive Performance, 2017
China’s Major Policies on Graphene, 2012-2018
Enterprises that Received Governmental Subsidies, 2017
Porter's Five Forces Model for the Graphene Industry
Graphene Papers Published in China, 2009-2017
Market Size of Graphene in China, 2016-2023E
Graphene Applied Structure in China, 2017
Preparation Process of Graphene Powder
Major Graphene Powder Manufacturers in China
Capacities of Key Graphene Powder Manufacturers in China, 2017
Major Graphene Film Manufacturers in China, 2015
Distribution of Major Graphene Industrial Parks in China
Graphene Patent Filings in China, 2009-2018
Distribution of Graphene Patents in China, 2017
Proportion of China’s Graphene Patents Worldwide by Region, 2017
Major Graphene Manufacturers in China
Graphene Business Layout of Major Graphene Manufacturers in China
Graphite-based Graphene Preparation
Distribution of Graphite Reserves Worldwide, 2017
Graphite Output in Major Countries/Region, 2012-2017
Price for China-made Ethanol, 2017-2018
Major Global Graphene Users in Downstream Sectors
Internal Resistance for Conductive Additives of Graphene-based Lithium Battery
Lithium Storage Capability of Anode Materials of Various Types
Progress in Research on Graphene for Lithium Battery
Global Market Share of Main Lithium Battery Anode Materials, 2017
Global Market Share of Main Lithium Battery Anode Material, 2017
Market Size of Graphene for Lithium Battery in China, 2017/2023E
Global Lithium Battery Market Size, 2012-2023E
Global Lithium Battery Market Demand, 2013-2023E
Global Demand for Lithium Battery Anode Materials, 2016-2023E
Competitive Landscape of Global Lithium Battery Market, 2017
Sales Volume and Market Size of Lithium Battery in China, 2011-2023E
Shipments of Lithium Battery Anode Materials in China, 2012-2023E
China’s Lithium Battery Export Volume and Value, 2007-2017
Major Lithium Battery Manufacturers in China
Application of Graphene in Supercapacitor
Parameters for Supercapacitor Electrode Materials
R&D Focus of Graphene Supercapacitor
Progress in Graphene in Supercapacitor
Market Size of Graphene for Supercapacitor in China, 2015-2023E
Global Market Size of Supercapacitor, 2015-2023E
Market Size and Growth Rate of Supercapacitor in China, 2012-2023E
Progress in Graphene in Touch Panel
Global Shipments of Touch Panels, 2012-2023E
Global Shipments of LCD, 2010-2023E
Shipments of Touch Panels in China by Product, 2010-2018
Shipments of LCD TV in China, 2008-2018
Global Market Size of Integrated Circuit, 2011-2023E
Market Size of Integrated Circuit in China, 2014-2023E
Application of Graphene in Polyester-based Composites
Net Income of Northern Graphite, 2010-2018
Revenue and Net Income of CVD, 2010-2018
Revenue Structure of CVD by Business, 2013-2018
Net Loss of Focus Graphite, FY2010-FY2017
Operating Costs of Lomiko Metals, 2010-2018
3D Graphite Patents of Lomiko Metals
Lomiko Metals’ Development of Graphite, 2015
Development of Graphene ESD
Distribution of Graphene Industrial Park of Lomiko Metals
Revenue and Net Income of Applied Graphene Materials, FY2011-FY2018
Business Strategy of Applied Graphene Materials
Customers of Applied Graphene Materials
Market Opportunities of Applied Graphene Materials
Global Footprint of Graphene NanoChem Plc
Revenue and Net Income of Graphene NanoChem Plc, 2011-2017
Revenue and Net Income of Haydale, FY2011-FY2018
Operating Revenue Structure of Haydale by Region, FY2014-FY2017
Investment Highlights of Graphene 3D Lab
Development Planning of Graphene 3D Lab
Major Customers of Graphene Square
Revenue and Net Income of The Sixth Element, 2012-2018
Revenue of The Sixth Element by Product, 2014-2017
Top 5 Customers of The Sixth Element, 2017
Top 5 Suppliers of The Sixth Element, 2017
Development History of Graphene Business of The Sixth Element
Graphene Products and Their Application of The Sixth Element
Revenue and Net Income of 2D Carbon, 2013-2018
Revenue Structure of 2D Carbon by Product, 2016-2017
R&D Costs and % of Total Revenue of 2D Carbon, 2013-2018
Transparent Graphene Film Capacity and Sales Value of 2D Carbon, 2013-2017
Data on PET-based Graphene Product of 2D Carbon
Net income of Beijing Moxi Holding Group, 2014-2017
Number of Graphene Patents of Ningbo Morsh, 2013-2017
Main Graphene Products of Ningbo Morsh Technology
Main Graphene Products of Chongqing Graphene Tech.
Number of Graphene Patents of Chongqing Graphene, 2013-2017
Capacity of Fangda Carbon by Product, 2015
Revenue and Net Income of Fangda Carbon, 2010-2017
Revenue Structure of Fangda Carbon by Product, 2010-2017
Revenue Structure of Fangda Carbon by Region, 2010-2017
Gross Margin of Fangda Carbon by Product, 2009-2017
R&D Costs and % of Total Revenue of Fangda Carbon, 2011-2018
Revenue and Net Income of Der Future, 2012-2018
Revenue Structure of Der Future by Product, 2016-2018
Revenue Structure of Der Future by Region, 2014-2018
Gross Margin of Der Future, 2011-2018
R&D Costs and % of Total Revenue of Der Future, 2013-2018
Proposed/On-going Projects of Der Future, 2017
Graphene Business Development History of Der Future
Revenue and Net Income of Kangdexin, 2010-2018
Revenue Structure of Kangdexin by Product, 2013-2018
Revenue Structure of Kangdexin by Region, 2010-2018
Gross Margin of Kangdexin, 2011-2018
R&D Costs and % of Total Revenue of Kangdexin, 2011-2018
Main Products and Their Specifications of Knano Graphene
Revenue and Net Income of Knano Graphene, 2012-2018
Revenue Structure of Knano Graphene by Product, 2016-2017
Main Graphene Patents of Knano Graphene
Graphene Capacity of Knano Graphene, 2018
Graphene Series Products and Their Specifications of XFNANO
Main Graphene Products of JCNANO Tech
Main Graphene Products of Plannano
Graphene Industry Development History of Dongxu Optoelectronic
Revenue and Net Income of Huagao Graphene, 2014-2018
Revenue Structure of HuagaoGraphene by Product, 2016-2017
New Material Business Revenue of Shengquan Group, 2014-2018
Revenue and Net Income of Qingdao Haoxin New Energy Technology, 2015-2018
如果这份报告不能满足您的要求,我们还可以为您定制报告,请 留言说明您的详细需求。
|