|
|
|
报告导航:研究报告—
生命科学—制药医疗
|
|
2018-2022年中国人用疫苗行业研究报告 |
 |
字数:5.3万 |
页数:157 |
图表数:165 |
|
中文电子版:9000元 |
中文纸版:7200元 |
中文(电子+纸)版:9500元 |
|
英文电子版:3000美元 |
英文纸版:3200美元 |
英文(电子+纸)版:3300美元 |
|
编号:ZLC-068
|
发布日期:2018-10 |
附件:下载 |
 |
|
|
作为全球最大人用疫苗生产国,中国已建立起覆盖疫苗“研发-生产-流通-接种”全生命周期的监管体系。
近三年,中国人用疫苗批签发量一直保持在6.5亿剂左右。2018上半年,CFDA新批准了九价人乳头瘤病毒疫苗(酿酒酵母)和口服五价重配轮状病毒减毒活疫苗(Vero细胞)两款疫苗上市。2018年1-9月,中检所、湖北所及上海所共批准了44种疫苗产品共4.341亿剂疫苗产品供应市场。
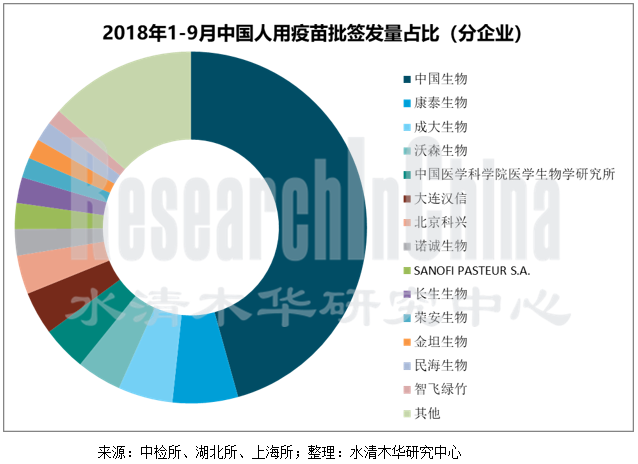
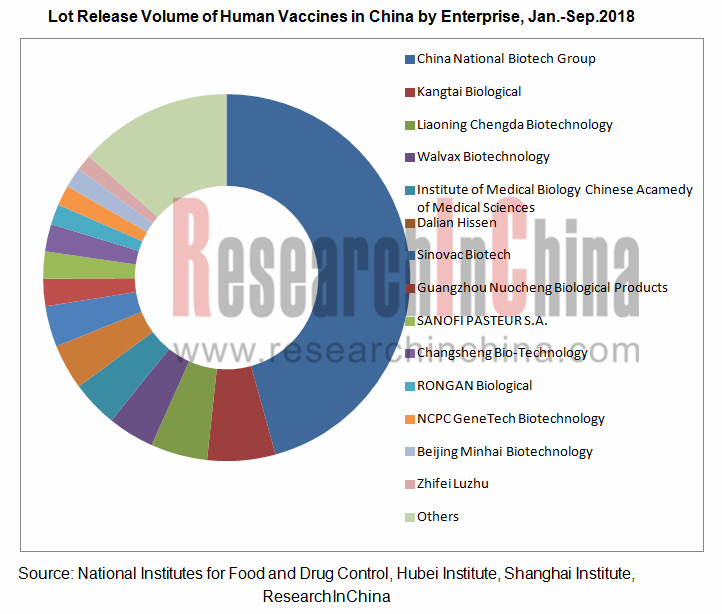
中国共有四十多家疫苗生产企业,可生产63种疫苗,预防34种传染病,年产能超过10亿剂。其中,中国生物旗下的成都所、上海所、兰州所、武汉所、长春所、北生研、长春祈健、天坛生物(天坛生物于2017年5月完成资产重组后已无疫苗业务)共同占据了中国疫苗市场的半壁江山。2017年,中国生物旗下子公司疫苗批签发量合计达34914.7万剂,占总批签发量的53.1%,2018年1-9月,其疫苗批签发量合计为19826.1万剂,占总批签发量的45.7%。
近年来,中国本土疫苗企业纷纷加大研发力度以提高竞争力。目前,在HPV疫苗和13价肺炎疫苗方面中国还没有企业能够生产,不过包括沃森生物、康泰生物等在内的本土企业正在研发之中,预计不久之后将面世。
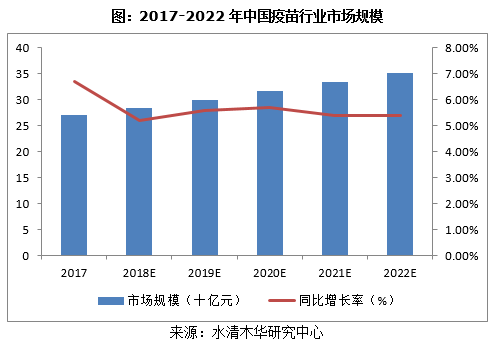
未来,在全面实施二孩政策、人口老龄化以及新型疫苗上市的推动下,中国人用疫苗行业将稳步发展,预计到2022年市场规模有望达到352亿元。同时具备更强的经济实力和研发实力的疫苗企业将发挥其技术优势和规模效应,通过资本运作等手段提高其市场份额。这势必将推动中国疫苗市场行业整合,行业集中度逐步提高。
《2018-2022年中国人用疫苗行业研究报告》主要包括以下内容:
 中国人用疫苗行业发展分析,包括运行环境、发展现状、市场需求、流通渠道、市场规模、进出口以及竞争格局分析; 中国人用疫苗行业发展分析,包括运行环境、发展现状、市场需求、流通渠道、市场规模、进出口以及竞争格局分析;
中国人用疫苗细分市场发展分析,包括市场需求、批签发量及竞争格局分析;
22家人用疫苗企业分析,包括经营情况、研发与投资、发展战略等分析。
As the world’s largest producer of human vaccines, China has established a full-life-cycleregulatory system covering vaccine R&D, production, distribution, and vaccination.
The lot release volume of human vaccines has remained at around 650 million doses over the past three years. China Food and Drug Administration (CFDA) approved the launch of 9-valent human papillomavirus vaccine (saccharomyces cerevisiae) and oral 5-valent reassortant rotavirus attenuated live vaccine (Vero cell) in the first half of 2018. The National Institutes for Food and Drug Control, Hubei Institute for Food and Drug Control, and Shanghai Institute for Food and Drug Control approved supply of 434.1 million doses (44 kinds of vaccines) to the market from January to September 2018.
With annual capacity of over one billion doses, more than forty vaccine manufacturers in China are capable of producing 63 kinds of vaccines for prevention of 34 sorts of infectious diseases. Among them, Chengdu Institute of Biological Products, Shanghai Institute of Biological Products, Lanzhou Institute of Biological Products, Wuhan Institute of Biological Products, Changchun Institute of Biological Products, Beijing Bio-Institute Biological Products, Changchun KEYGEN Biological Products, and Beijing Tiantan Biological Products (Beijing Tiantan Biological Products has no vaccine business after completion of asset restructuring in May 2017) under China National Biotech Group Co., Ltd. occupy half of the Chinese vaccine market. The subsidiaries under China National Biotech Group Co., Ltd. recorded lot release volume of 349.147 million doses in 2017 and 198.261 million doses in the first nine months of 2018, making up 53.1% and 45.7% of the country’s total amount, respectively.
In recent years, Chinese vaccine companies have spared no efforts in research and development to sharpen competitiveness. As yet, not a Chinese enterprise can produce HPV vaccines and 13-valent pneumonia vaccines, but local companies including Walvax Biotechnology and Shenzhen Kangtai Biological Products are developing such vaccines which are expected to be available soon.
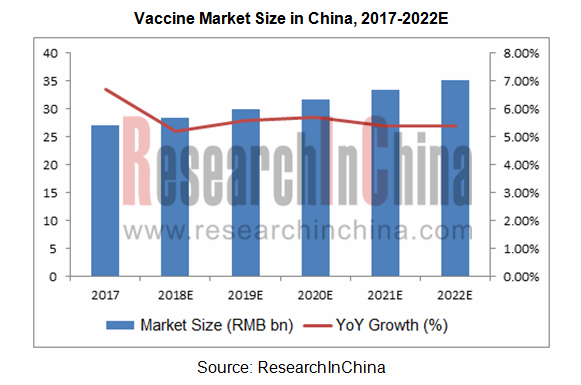
With the implementation of two-child policy, the aging of population and the launch of new-type vaccines, China’s human vaccine industry will grow steadily in future, with the expected market size of RMB35.2 billion by 2022. Meanwhile, vaccine companies with richer capital and stronger R&D strength will give play to technological superiorities and scale effect, and raise their market share through capital operation and other means. In this sense, China’s vaccine industry tends to feature higher and higher concentration.
China Human Vaccine Industry Report, 2018-2022 highlights the following:
 China’s human vaccine industry (operating environment, status quo, market demand, distribution channels, market size, import and export, and competitive landscape); China’s human vaccine industry (operating environment, status quo, market demand, distribution channels, market size, import and export, and competitive landscape);
Chinese human vaccine market segments (market demand, lot release volume and competitive landscape);
22 human vaccine companies (operation, R&D and investment, development strategy, etc.) .
第一章 疫苗行业概述
1.1定义及分类
1.2 产业链
第二章 中国人用疫苗行业发展分析
2.1 运行环境
2.1.1 国际市场
2.1.2 政策环境
2.1.3 生物制药市场
2.2 发展现状
2.3 市场需求
2.4 流通渠道
2.5 市场规模
2.6 进出口分析
2.6.1 进口分析
2.6.2 出口分析
2.6.3 进出口均价
2.7 竞争格局
第三章 中国人用疫苗细分市场发展分析
3.1 乙肝疫苗
3.1.1 市场需求
3.1.2 批签发量
3.1.3 竞争格局
3.2 流脑疫苗
3.2.1 市场需求
3.2.2 批签发量
3.2.3 竞争格局
3.3 甲肝疫苗
3.3.1 市场需求
3.3.2 批签发量
3.3.3 竞争格局
3.4 流感疫苗
3.4.1 市场需求
3.4.2 批签发量
3.4.3 竞争格局
3.5 Hib疫苗
3.5.1 市场需求
3.5.2 批签发量
3.5.3 竞争格局
3.6 人用狂犬病疫苗
3.6.1 市场需求
3.6.2 批签发量
3.6.3 竞争格局
3.7 水痘疫苗
3.7.1 市场需求
3.7.2 批签发量
3.7.3 竞争格局
3.8 肺炎疫苗
3.8.1 市场需求
3.8.2 批签发量
3.8.3 竞争格局
3.9 DTP疫苗
3.9.1 市场需求
3.9.2 批签发量
3.9.3 竞争格局
3.10 脊髓灰质炎疫苗
3.10.1 市场需求
3.10.2 批签发量
3.10.3 竞争格局
3.11 戊肝疫苗
3.11.1 市场需求
3.11.2 批签发量
3.11.3 竞争格局
第四章 中国主要人用疫苗企业
4.1 中国生物
4.1.1 公司简介
4.1.2 北京生物制品研究所有限责任公司
4.1.3 成都生物制品研究所有限责任公司
4.1.4 上海生物制品研究所有限责任公司
4.1.5 武汉生物制品研究所有限责任公司
4.1.6 兰州生物制品研究所有限责任公司
4.1.7 长春生物制品研究所有限责任公司
4.2 天坛生物
4.2.1 公司简介
4.2.2 经营情况
4.2.3 营收构成
4.2.4 毛利率
4.2.5 研发与投资
4.2.6 疫苗业务
4.3 华兰生物
4.3.1 公司简介
4.3.2 经营情况
4.3.3 营收构成
4.3.4 研发与投资
4.3.5 疫苗业务
4.3.7 发展战略
4.4 智飞生物
4.4.1 公司简介
4.4.2 经营情况
4.4.3 营收构成
4.4.4 毛利率
4.4.5 研发与投资
4.4.6 发展动态
4.4.7 发展战略
4.5 沃森生物
4.5.1 公司简介
4.5.2 经营情况
4.5.3 营收构成
4.5.4 毛利率
4.5.5 研发与投资
4.5.6 疫苗业务
4.5.7 发展趋势
4.6 成大生物
4.6.1 公司简介
4.6.2 经营情况
4.6.3 营收构成
4.6.4 毛利率
4.6.5 主要客户
4.6.6 研发与投资
4.6.7 发展战略
4.7 康泰生物
4.7.1 公司简介
4.7.2 经营情况
4.7.3 营收构成
4.7.4 毛利率
4.7.5 研发与投资
4.7.6 发展战略
4.8 长生生物
4.8.1 公司简介
4.8.2 经营情况
4.8.3 营收构成
4.8.4 研发与投资
4.8.5 发展动态
4.9 欧林生物
4.9.1 公司简介
4.9.2 经营情况
4.9.3 研发投资
4.10 科兴控股
4.10.1 公司简介
4.10.2 经营情况
4.10.3 营收构成
4.10.4 北京科兴
4.11 长春百克
4.11.1 公司简介
4.11.2 经营情况
4.11.3 发展动态
4.12 天元生物
4.12.1 公司简介
4.12.2 经营情况
4.13 艾美汉信
4.13.1 公司简介
4.13.2 疫苗业务
4.14 金坦生物
4.14.1 公司简介
4.14.2 经营情况
4.15 雅立峰生物
4.15.1 公司简介
4.15.2 疫苗业务
4.16 民海生物
4.16.1 公司简介
4.16.2 经营情况
4.17 赛诺菲巴斯德
4.17.1 公司简介
4.17.2 经营情况
4.18 其他企业
4.18.1 万泰沧海
4.18.2 康淮生物
4.18.3 康华生物
4.18.4 诺诚生物
4.18.5 康希诺生物
第五章 总结预测
5.1 总结
5.2 发展趋势
5.2.1 人用疫苗行业集中度逐步提升
5.2.2 二胎政策开放利好人用疫苗行业发展
5.2.3 人口老龄化加剧推动人用疫苗行业发展
5.2.4 HPV疫苗拥有广阔的发展空间
5.2.5 国产13价肺炎结合疫苗有望上市
5.2.6 本土企业加大研发投入疫苗产品逐步丰富
1. Overview of Vaccine Industry
1.1 Definition & Classification
1.2 Industry Chain
2. China Human Vaccine Industry
2.1 Operating Environment
2.1.1 International Market
2.1.2 Policy Environment
2.1.3 Biopharmaceutical Market
2.2 Status Quo
2.3 Market Demand
2.4 Circulation Channels
2.5 Market Size
2.6 Import & Export
2.6.1 Import
2.6.2 Export
2.6.3 Average Price
2.7 Competition Pattern
3. Human Vaccine Market Segments in China
3.1 Hepatitis B Vaccine
3.1.1 Demand
3.1.2 Lot Release Volume
3.1.3 Competition Pattern
3.2 Meningococcal Vaccine
3.2.1 Demand
3.2.2 Lot Release Volume
3.2.3 Competition Pattern
3.3 Hepatitis A Vaccine
3.3.1 Demand
3.3.2 Lot Release Volume
3.3.3 Competition Pattern
3.4 Influenza Vaccine
3.4.1 Demand
3.4.2 Lot Release Volume
3.4.3 Competition Pattern
3.5 Hib Vaccine
3.5.1 Demand
3.5.2 Lot Release Volume
3.5.3 Competition Pattern
3.6 Human Rabies Vaccine
3.6.1 Demand
3.6.2 Lot Release Volume
3.6.3 Competition Pattern
3.7 Varicella Vaccine
3.7.1 Demand
3.7.2 Lot Release Volume
3.7.3 Competition Pattern
3.8 Pneumococcal Vaccines
3.8.1 Demand
3.8.2 Lot Release Volume
3.8.3 Competition Pattern
3.9 DTP Vaccine
3.9.1 Demand
3.9.2 Lot Release Volume
3.9.3 Competition Pattern
3.10 Poliomyelitis Vaccine
3.10.1 Demand
3.10.2 Lot Release Volume
3.10.3 Competition Pattern
3.11 Hepatitis E Vaccine
3.11.1 Demand
3.11.2 Lot Release Volume
3.11.3 Competition Pattern
4. Major Human Vaccine Manufacturers in China
4.1 China National Biotech Group
4.1.1 Profile
4.1.2 National Vaccine and Serum Institute
4.1.3 Chengdu Institute of Biological Products Co., Ltd.
4.1.4 Shanghai Institute of Biological Products Co., Ltd.
4.1.5 Wuhan Institute of Biological Products Co., Ltd.
4.1.6 Lanzhou Institute of Biological Products Co., Ltd.
4.1.7 Changchun Institute of Biological Products Co., Ltd.
4.2 Beijing Tiantan Biological Products Co., Ltd.
4.2.1 Profile
4.2.2 Operation
4.2.3 Revenue Structure
4.2.4 Gross Margin
4.2.5 R&D
4.2.6 Vaccine Business
4.3 Hualan Biological Engineering Inc.
4.3.1 Profile
4.3.2 Operation
4.3.3 Revenue Structure
4.3.4 R&D
4.3.5 Vaccine Business
4.3.6 Development Strategy
4.4 Chongqing Zhifei Biological Products Co., Ltd.
4.4.1 Profile
4.4.2 Operation
4.4.3 Revenue Structure
4.4.4 Gross Margin
4.4.5 R&D
4.4.6 Development Dynamics
4.4.7 Development Strategy
4.5 Walvax Biotechnology Co, Ltd.
4.5.1 Profile
4.5.2 Operation
4.5.3 Revenue Structure
4.5.4 Gross Margin
4.5.5 R&D
4.5.6 Vaccine Business
4.5.7 Development Trend
4.6 Liaoning Cheng Da Co., Ltd.
4.6.1 Profile
4.6.2 Operation
4.6.3 Revenue Structure
4.6.4 Gross Margin
4.6.5 Major Customers
4.6.6 R&D
4.6.7 Development Strategy
4.7 Shenzhen Kangtai Biological Products Co., Ltd.
4.7.1 Profile
4.7.2 Operation
4.7.3 Revenue Structure
4.7.4 Gross Margin
4.7.5 R&D
4.7.6 Development Strategy
4.8 Changsheng Bio-Technology Co., Ltd.
4.8.1 Profile
4.8.2 Operation
4.8.3 Revenue Structure
4.8.4 R&D
4.8.5 Development Dynamics
4.9 Olymvax Biopharmaceuticals Inc.
4.9.1 Profile
4.9.2 Operation
4.9.3 R&D
4.10 Sinovac Biotech Ltd.
4.10.1 Profile
4.10.2 Operation
4.10.3 Revenue Structure
4.10.4 Sinovac Biotech (Beijing)
4.11 Changchun BCHT Biotechnology Co. Ltd.
4.11.1 Profile
4.11.2 Operation
4.11.3 Development Dynamics
4.12 Zhejiang Tianyuan Bio-Pharmaceutical Co., Ltd.
4.12.1 Profile
4.12.2 Operation
4.13 Dalian Hissen Bio-Pharm Co., Ltd.
4.13.1 Profile
4.13.2 Vaccine Business
4.14 NCPC GeneTech Biotechnology Development Co., Ltd.
4.14.1 Profile
4.14.2 Operation
4.15 Dalian Aleph Biomedical Co., Ltd.
4.15.1 Profile
4.15.2 Vaccine Business
4.16 Beijing Minhai Biotechnology Co., Ltd.
4.16.1 Profile
4.16.2 Operation
4.17 Shenzhen Sanofi Pasteur Biological Products Co., Ltd.
4.17.1 Profile
4.17.2 Operation
4.18 Other Enterprises
4.18.1 Xiamen Innovax Biotech Co., Ltd.
4.18.2 Convac Biotechnology Co., Ltd.
4.18.3 Chengdu Kanghua Biological Products Co.,Ltd.
4.18.4 Guangzhou Nuocheng Biological Products
4.18.5 CanSino Biologics Inc.
5 Summary and Forecast
5.1 Summary
5.2 Development Trends
5.2.1 Human Vaccine Industry is Increasingly Concentrated
5.2.2 Two-child Policy is in Favor of Human Vaccine Industry Growth
5.2.3 Faster Aging of Population Boosts Human Vaccine Industry
5.2.4 Human Papillomavirus (HPV) Vaccine Market is Promising
5.2.5 Homemade 13-valent Pneumococcal Conjugate Vaccine is Likely to be Launched
5.2.6 Local Companies Invest More Heavily in Research and Development of Vaccine Products Which are Becoming More Various
表:疫苗分类
图:疫苗产业链
图:2010-2017年全球人用疫苗行业市场规模
图:2017-2022年全球人用疫苗行业市场规模
图:2013-2017年全球主要疫苗企业疫苗业务收入
表:2005-2017年全球疫苗领域主要并购案例
表:2006-2017年中国人用疫苗行业相关政策
图:2008-2017年中国生物制药行业工业总产值
图:2016-2022年中国生物制药行业工业总产值
表:中国一类人用疫苗主要品种
图:2013-2018年中国人用疫苗批签发量及同比增长率
表:2013-2018年中国批签发数量排名前十的人用疫苗
表:2018年1-9月中国人用疫苗品种及获批签发的生产商
图:2010-2018年中国人用疫苗市场规模及同比增长率
图:2010-2017年中国人用疫苗进口量及进口金额
表:2016年中国人用疫苗进口来源国家地区进口量及金额
图:2010-2017年中国人用疫苗出口量及出口金额
表:中国人用疫苗出口量前十的国家地区
图:2010-2017年中国人用疫苗进出口均价对比
图:2017年中国人用疫苗批签发占比(按企业性质)
图:2018年1-9月中国人用疫苗批签发占比(按企业性质)
表:2014-2018年中国人用疫苗批签发量(分企业)
图:2017年中国人用疫苗批签发量占比(分企业)
图:2018年1-9月中国人用疫苗批签发量占比(分企业)
表:2013-2018年中国人用疫苗主要企业疫苗业务收入
图:2013-2017年中国乙肝发病人数、死亡人数及死亡率
表:2018年1-9月中国乙肝发病人数及死亡人数
图:2013-2018年中国乙肝疫苗批签发量
图:2013-2018年中国乙肝疫苗批签发量(按规格)
表:2013-2018年中国乙肝疫苗批签发量(分企业)
表:2013-2018年中国乙肝疫苗批签发量占比(分企业)
图:2013-2017年中国流脑发病人数、死亡人数及死亡率
表:2018年1-9月中国流脑发病人数及死亡人数
图:2013-2018年中国流脑疫苗批签发量
图:2013-2018年中国流脑疫苗批签发量(分类型)
表:2013-2018年流脑疫苗批签发量(分企业)
表:2013-2018年流脑疫苗批签发量占比(分企业)
图:2013-2017年中国甲肝发病人数、死亡人数及死亡率
表:2018年1-9月中国甲肝发病人数和死亡人数
图:2013-2018年中国甲肝疫苗批签发量
表:2013-2018年中国甲肝疫苗批签发量(分企业)
表:2013-2018年中国甲肝疫苗批签发量占比(分企业)
图:2013-2017年中国流行性感冒发病人数、死亡人数及死亡率
2018年1-9月中国流行性感冒发病人数及死亡人数
图:2013-2017年中国H7N9发病人数、死亡人数及死亡率
表:2018年1-9月中国H7N9发病人数及死亡人数
图:2013-2018年中国流感疫苗批签发量
表:2013-2018年中国流感疫苗批签发量(分企业)
表:2013-2018年中国流感疫苗批签发量占比(分企业)
图:2013-2018年中国Hib疫苗批签发量
图:2013-2018年中国Hib疫苗批签发量(分企业)
图:2013-2018年中国Hib疫苗批签发量占比(分企业)
图:2013-2017年中国狂犬病发病人数、死亡人数及死亡率
表:2018年1-9月中国狂犬病发病人数及死亡人数
图:2013-2018年中国人用狂犬病疫苗批签发量
表:2013-2018年中国人用狂犬病疫苗批签发量(分企业)
表:2013-2018年中国人用狂犬病疫苗批签发量占比(分企业)
表:2013-2018年中国水痘疫苗批签发量
表:2013-2018年中国水痘疫苗批签发量(分企业)
表:2013-2018年中国水痘疫苗批签发量占比(分企业)
图:2013-2018年中国肺炎疫苗批签发量
图:2013-2018年中国肺炎疫苗批签发量(分企业)
图:2013-2018年中国肺炎疫苗批签发量占比(分企业)
图:2012-2017年中国百日咳发病人数、死亡人数及死亡率
表:2018年1-9月中国百日咳发病人数及死亡人数
图:2012-2017年中国新生儿破伤风发病人数、死亡人数及死亡率
表:2018年1-9月中国新生儿破伤风发病人数及死亡人数
图:2013-2018年中国百白破疫苗批签发量
表:2013-2018年中国百白破疫苗批签发量(分企业)
表:2013-2018年中国百白破疫苗批签发量占比(分企业)
图:2013-2018年中国脊髓灰质炎疫苗批签发量
图:2013-2018年中国脊髓灰质炎疫苗批签发量(分企业)
图:2013-2018年中国脊髓灰质炎疫苗批签发量占比(分企业)
图:2012-2017年中国戊肝发病人数、死亡人数及死亡率
表:2018年1-9月中国戊肝发病人数及死亡人数
图:2013-2018年中国戊肝疫苗批签发量
表:2013-2018年中国戊肝疫苗批签发量(分企业)
表:中生股份主要疫苗产品规格及产地
表:成都所疫苗种类
表:2013-2016年上海所经营数据
图:2013-2018年天坛生物营业收入及净利润
图:2013-2017年天坛生物营业收入(分产品)
图:2013-2017年天坛生物营业收入构成(分产品)
图:2013-2017年天坛生物营业收入(分地区)
图:2013-2017年天坛生物营业收入构成(分地区)
图:2013-2017年天坛生物毛利率(分产品)
图:2013-2018年天坛生物研发支出及占总营收比重
图:2013-2017年天坛生物疫苗业务收入及占比
图:2013-2018年华兰生物营业收入及净利润
图:2013-2018年华兰生物营业收入(分产品)
图:2013-2018年华兰生物营业收入构成(分产品)
图:2013-2018年华兰生物研发支出及占总营收比重
图:2013-2017年华兰生物疫苗产销量及库存量
图:2013-2018年华兰生物疫苗业务营业收入及占比
表:智飞生物主要在售或协议推广产品及用途
图:2012-2018年智飞生物营业收入及净利润
表:2014-2017年智飞生物营业收入(分产品)
表:2014-2018年智飞生物主要疫苗产品批签发情况
表:2014-2017年智飞生物营业收入(分地区)
图:2013-2018年智飞生物毛利率(分产品)
图:2011-2018年智飞生物研发支出及占比
表:截至2018上半年智飞生物进入注册程序的项目
表:截至2018上半年智飞生物临床前项目
图:2013-2018年沃森生物营业收入及净利润
表:2014-2017年沃森生物营业收入(分产品)
表:2014-2017年沃森生物营业收入(分地区)
图:2013-2017年沃森生物自主疫苗产品毛利率
图:2013-2018年沃森生物研发支出及占比
表:截至2018上半年沃森生物主要募投项目进展情况
图:截至2018上半年沃森生物进入注册申报阶段的产品注册申报进度
表:2014-2017年沃森生物疫苗产销及库存量
表:2014-2018年沃森生物疫苗批签发量
图:2013-2018年成大生物营业收入及净利润
图:2013-2018年成大生物营业收入(分产品)
图:2013-2018年成大生物营业收入构成(分产品)
图:2013-2018年成大生物毛利率
表:2015-2017年成大生物前五名客户销售额及占比
图:2014-2017年成大生物研发支出及占比
表:康泰生物主要产品及用途
表:2013-2017年康泰生物主要产品产能及产销量
图:2013-2018年康泰生物营业收入及净利润
表:2015-2018年康泰生物营业收入(分产品)
表:2015-2018年康泰生物主要疫苗批签发量及占比
表:2015-2018年康泰生物营业收入(分地区)
图:2013-2017年康泰生物毛利率
图:2013-2018年康泰生物研发支出及占比
表:截至2018上半年康泰生物在研项目进展情况
表:截至2018上半年康泰生物正在进行的重大非股权投资情况
图:2014-2017年长生生物营业收入及净利润
图:2014-2017年长生生物营业收入(分产品)
图:2014-2017年长生生物营业收入构成(分产品)
表:2014-2017年长生生物疫苗产销及库存量
表:截至2017年底长生生物自主研发与合作研发疫苗产品进展情况
图:2014-2017年长生生物研发支出及占比
表:欧林生物发展历程
图:2014-2018年欧林生物营业收入及净利润
表:欧林生物在研产品研发进度
图:科兴控股主要产品
图:2013-2017年科兴控股营业收入及净利润
图:2013-2017年科兴控股营业收入(分产品)
表:北京科兴股权结构
图:2015-2017年北京科兴财务数据
图:2014-2018年长春百克财务数据
图:天元生物股权结构
表:浙江天元疫苗产品
图:2013-2016年天元生物营业收入及净利润
图:2014-2018年金坦生物财务数据
表:雅立峰生物股权结构
图:雅立峰生物发展目标
表:2015-2018年民海生物财务数据
表:2016年赛诺菲巴斯德资产总额及营业总收入
表:万泰沧海发展历程
图:康希诺生物主要合作伙伴
图:康希诺生物在研产品
图:2017-2022年中国疫苗行业市场规模
图:2015-2022年中国新生人口数量
图:2009-2017年中国60岁以上人口数量及占比
图:全球宫颈癌发病率
表:全球 HPV 疫苗产品情况
图:2006-2015年全球HPV疫苗市场规模
表:2018年1-9月中国HPV疫苗批签发量(分企业)
表:中国HPV疫苗主要在研企业及其研发阶段
表:表:中国13价肺炎疫苗主要在研企业及其研发阶段
表:2013-2018年中国主要疫苗企业研发投入
表:中国主要企业在研疫苗产品及研发进度
Classification of Vaccines
Vaccine Industry Chain
Global Human Vaccine Market Size, 2010-2017
Global Human Vaccine Market Size, 2017-2022E
Revenue of Major Global Vaccine Companies, 2013-2017
Main Mergers & Acquisitions in the Vaccine Industry Worldwide, 2005-2017
Related Policies in China Human Vaccine Industry, 2006-2017
Gross Industrial Output Value of China Biopharmaceutical Industry, 2008-2017
Gross Industrial Output Value of China Biopharmaceutical Industry, 2016-2022E
EPI Human Vaccine Varieties in China
Lot Release Volume of Human Vaccine in China, 2013-2018
Top10 Human Vaccines by Lot Release Volume in China, 2013-2018
Main Human Vaccine Varieties and Producers Granted Permit for Lot Release in China, Jan.-Sep. 2018
China Human Vaccine Market Size, 2010-2018
Import Volume and Value of Human Vaccine in China, 2010-2017
Export Volume and Value of Human Vaccine in China, 2010-2017
Average Unit Export/Import Price of Human Vaccine in China, 2010-2017
Lot Release Volume Breakdown of Human Vaccines in China by Nature of Enterprise, 2017
Lot Release Volume Breakdown of Human Vaccines in China by Nature of Enterprise, Jan.-Sep.2018
Human Vaccine Lot Release Volume of Major Vaccine Enterprises in China, 2014-2018
Lot Release Volume of Human Vaccines in China by Enterprise, 2017
Lot Release Volume of Human Vaccines in China by Enterprise, Jan.-Sep.2018
Vaccine Revenue of Major Human Vaccine Enterprises in China, 2013-2018
Hepatitis B Morbidity and Mortality in China, 2013-2017
Hepatitis B Morbidity and Mortality in China, Jan.-Sep.2018
Lot Release Volume of Hepatitis B Vaccine in China, 2013-2018
Lot Release Volume of Hepatitis B Vaccine in China by Dosage Form, 2013-2018
Lot Release Volume of Major Hepatitis B Vaccine Companies in China, 2013-2018
Share of Major Hepatitis B Vaccine Companies by Lot Release Volume in China, 2013-2018
Meningitis Morbidity and Mortality in China, 2013-2017
Meningitis Morbidity and Mortality in China, Jan.-Sep. 2018
Meningococcal Vaccines Lot Release Volume in China, 2013-2018
Meningococcal Vaccines Lot Release Volume in China by Type, 2013-2018
Lot Release Volume of Major Meningococcal Vaccines Companies in China, 2013-2018
Share of Major Meningococcal Vaccines Companies by Lot Release Volume in China, 2013-2018
Hepatitis A Morbidity and Mortality in China, 2013-2017
Hepatitis A Morbidity and Mortality in China, Jan.-Sep. 2018
Lot Release Volume of Hepatitis A Vaccine in China, 2013-2018
Lot Release Volume of Major Hepatitis A Vaccine Companies in China, 2013-2018
Share of Major Hepatitis A Vaccine Companies by Lot Release Volume in China, 2013-2018
Influenza Morbidity and Mortality in China, 2013-2017
Influenza Morbidity and Mortality in China, Jan.-Sep. 2018
H7N9 Influenza Morbidity and Mortality in China, 2013-2017
H7N9 Influenza Morbidity and Mortality in China, Jan.-Sep. 2018
Lot Release Volume of Influenza Vaccine in China, 2013-2018
Lot Release Volume of Major Influenza Vaccine Companies in China, 2013-2018
Share of Major Influenza Vaccine Companies by Lot Release Volume in China, 2013-2018
Lot Release Volume of Hib Vaccine in China, 2013-2018
Lot Release Volume of Major Hib Vaccine Companies in China, 2013-2018
Share of Major Hib Vaccine Companies by Lot Release Volume in China, 2013-2018
Rabies Morbidity and Mortality in China, 2013-2017
Rabies Morbidity and Mortality in China, Jan.-Sep. 2018
Lot Release Volume of Human Rabies Vaccine in China, 2013-2018
Lot Release Volume of Major Human Rabies Vaccine Companies in China, 2013-2018
Share of Major Human Rabies Vaccine Companies by Lot Release Volume in China, 2013-2018
Lot Release Volume of Varicella Vaccine in China, 2013-2018
Lot Release Volume of Major Varicella Vaccine Companies in China, 2013-2018
Share of Major Varicella Vaccine Companies by Lot Release Volume in China, 2013-2018
Lot Release Volume of Pneumococcal Vaccines in China, 2013-2018
Lot Release Volume of Major Pneumococcal Vaccines Companies in China, 2013-2018
Share of Major Pneumococcal Vaccine Companies by Lot Release Volume in China, 2013-2018
Pertussis Morbidity and Mortality in China, 2012-2017
Pertussis Morbidity and Mortality in China, Jan.-Sep. 2018
Neonatal Tetanus Morbidity and Mortality in China, 2012-2017
Neonatal Tetanus Morbidity and Mortality in China, Jan.-Sep. 2018
Lot Release Volume of DTP Vaccine in China, 2013-2018
Lot Release Volume of Major DTP Vaccine Companies in China, 2013-2018
Share of Major DTP Vaccine Companies by Lot Release Volume in China, 2013-2018
Poliomyelitis Morbidity and Mortality in China, 2013-2018
Lot Release Volume of Poliomyelitis Vaccine Companies in China, 2013-2018
Share of Major Poliomyelitis Vaccine Companies by Lot Release Volume in China, 2013-2018
Hepatitis E Morbidity and Mortality in China, 2012-2017
Hepatitis E Morbidity and Mortality in China, Jan.-Sep. 2018
Lot Release Volume of Hepatitis E Vaccine in China, 2013-2018
Lot Release Volume of Major Hepatitis E Vaccine Companies in China, 2013-2018
Specifications and Place of Origin of China National Biotech Group’s Main Vaccine Products
Revenue and Net Income of Beijing Tiantan Biological Products, 2013-2018
Revenue Breakdown of Beijing Tiantan Biological Products by Product, 2013-2017
Revenue Structure of Beijing Tiantan Biological Products by Product, 2013-2017
Revenue Breakdown of Beijing Tiantan Biological Products by Region, 2013-2017
Revenue Structure of Beijing Tiantan Biological Products by Region, 2013-2017
Gross Margin of Beijing Tiantan Biological Products by Product, 2013-2017
R&D Costs and % of Total Revenue of Beijing Tiantan Biological Products, 2013-2018
R&D Costs and % of Total Revenue of Beijing Tiantan Biological Products, 2013-2017
Revenue and Net Income of Hualan Biological Engineering, 2013-2018
Revenue Breakdown of Hualan Biological Engineering by Sector, 2013-2018
Revenue Structure of Hualan Biological Engineering by Sector, 2013-2018
R&D Costs and % of Total Revenue of Hualan Biological Engineering, 2013-2018
Output & Sales Volume, Inventory of Hualan Biological Engineering, 2013-2017
Vaccine Revenue and Percentage of Hualan Biological Engineering, 2013-2018
Main Products Chongqing Zhifei Biological Products is Selling or Promoting according to Agreements, and Their Purposes
Revenue and Net Income of Chongqing Zhifei Biological Products, 2012-2018
Revenue Breakdown of Chongqing Zhifei Biological Products by Product, 2014-2017
Lot Release Volume Breakdown of Chongqing Zhifei Biological Products by Product, 2014-2018
Revenue Breakdown of Chongqing Zhifei Biological Products by Region, 2014-2017
Gross Margin of Chongqing Zhifei Biological Products by Product, 2013-2018
R&D Costs and % of Total Revenue of Chongqing Zhifei Biological Products, 2011-2018
Projects under Registration Process of Chongqing Zhifei Biological Products, as of 2018H1
Progress of Preclinical Projects of Chongqing Zhifei Biological Products by 2018H1
Revenue and Net Income of Walvax Biotechnology, 2013-2018
Revenue Breakdown of Walvax Biotechnology by Product, 2014-2017
Revenue Breakdown of Walvax Biotechnology by Region, 2014-2017
Gross Margin of Own Vaccine of Walvax Biotechnology, 2013-2017
R&D Costs and % of Total Revenue of Walvax Biotechnology, 2013-2018
Progress of Walvax Biotechnology’s Projects with Raised Fund, as of 2018 H1
Progress of Products under Registration Declaration of Walvax Biotechnology, as of 2018H1
Output & Sales Volume, Inventory of Walvax Biotechnology, 2014-2017
Lot Release Volume of Walvax Biotechnology, 2014-2018
Revenue and Net Income of Liaoning Chengda, 2013-2018
Revenue Breakdown of Liaoning Chengda by Product, 2013-2018
Revenue Structure of Liaoning Chengda by Product, 2013-2018
Gross Margin of Liaoning Chengda, 2013-2018
Liaoning Chengda’s Revenue from Top5 Customers and % of Total Revenue, 2015-2017
R&D Costs and % of Total Revenue of Liaoning Chengda, 2014-2017
Main Products and Their Purposes of Shenzhen Kangtai Biological Products
Capacity, Output & Sales Volume of Shenzhen Kangtai Biological Products, 2013-2017
Revenue and Net Income of Shenzhen Kangtai Biological Products, 2013-2018
Revenue Breakdown of Shenzhen Kangtai Biological Products by Product, 2015-2018
Lot Release Volume and Percentage of Shenzhen Kangtai Biological Products, 2015-2018
Revenue Breakdown of Shenzhen Kangtai Biological Products by Region, 2015-2018
Gross Margin of Shenzhen Kangtai Biological Products, 2013-2017
R&D Costs and % of Total Revenue of Shenzhen Kangtai Biological Products, 2013-2018
Progress of Research Projects of Shenzhen Kangtai Biological Products, as of 2018H1
Major Non-equity Investments by Shenzhen Kangtai Biological Products, as of 2018H1
Revenue and Net Income of Changsheng Bio-technology, 2014-2017
Revenue Breakdown of Changsheng Bio-technology by Product, 2014-2017
Revenue Structure of Changsheng Bio-technology by Product, 2014-2017
Output & Sales Volume, Inventory of Changsheng Bio-technology, 2014-2017
Progress of Ongoing Projects of Changsheng Bio-technology as of the end of 2017
R&D Costs and % of Total Revenue of Changsheng Bio-technology, 2014-2017
Development Course of Olymvax Biopharmaceuticals
Revenue and Net Income of Olymvax Biopharmaceuticals, 2014-2018
Research Progress of Products Developed by Olymvax Biopharmaceuticals
Main Products of Sinovac Biotech
Revenue and Net Income of Sinovac Biotech, 2013-2017
Revenue Breakdown of Sinovac Biotech by Product, 2013-2017
Equity Structured of Sinovac Biotech
Financial Indices of Sinovac Biotech, 2015-2017
Financial Indices of Changchun BCHT Biotechnology, 2014-2018
Equity Structure of Zhejiang Tianyuan Bio-Pharmaceutical
Revenue and Net Income of Zhejiang Tianyuan Bio-Pharmaceutical, 2013-2016
Financial Indices of NCPC GeneTech Biotechnology Development, 2014-2018
Development Goals of Dalian Aleph Biomedical
Financial Indices of Beijing Minhai Biotechnology, 2015-2018
Development Course of Xiamen Innovax Biotech
Main Partners of CanSino Biologics
Products Being Researched by CanSino Biologics
China’s Vaccine Market Size, 2017-2022E
Number of Newborns in China, 2015-2022E
China’s Population Aged over 60 and % of Total Population, 2009-2017
Global Incidence of Cervical Cancer
HPV Vaccine Products Worldwide
Global HPV Vaccine Market Size, 2006-2015
Lot Release Volume of HPV Vaccine in China by Enterprise, Jan-Sept 2018
Major HPV Vaccine Developers in China and Their Progress
Major 13-valent Pneumococcal Conjugate Vaccine Developers in China and Their Progress
R&D Investment of Major Vaccine Companies in China, 2013-2018
Main Vaccine Products Being Researched by Companies in China and Their Progress
如果这份报告不能满足您的要求,我们还可以为您定制报告,请 留言说明您的详细需求。
|