|
|
|
报告导航:研究报告—
TMT产业—电信
|
|
2018-2022年全球及中国射频同轴电缆行业研究报告 |
 |
字数:3.3万 |
页数:139 |
图表数:140 |
|
中文电子版:8000元 |
中文纸版:6400元 |
中文(电子+纸)版:8500元 |
|
英文电子版:2800美元 |
英文纸版:3000美元 |
英文(电子+纸)版:3100美元 |
|
编号:ZLC-70
|
发布日期:2018-12 |
附件:下载 |
 |
|
|
得益于下游领域的快速发展,以及高端设备对射频同轴电缆品类、技术要求的日益增加,射频同轴电缆的市场规模逐年增长。
以移动通信射频同轴电缆为例:目前全球电信市场的建设重点还是4G网络,虽然4G网络在个别发达国家处于建设末期,但在很多国家还在规模建设中。此外,5G试验网络在美国,日本,韩国,中国等国家开始逐步试点。因此对通信用射频同轴电缆需求增长较快。预计2018年,全球移动通信用射频同轴电缆市场规模将达65.1亿美元。
目前,中国已建成全球最大的4G网络,截至2017年,中国移动网络用户总数高达约14.17亿户,其中4G网络用户约9.97亿户,渗透率达70.4%。4G网络的建设带动了移动通信基础建设,截至2018年9月中国移动通信基站数量达639万个,其中3G/4G基站总数达到479万个,占比达74.9%。
在4G全面铺开,5G开启规模试验,即将进入商用的推动下,中国射频同轴电缆市场规模逐年上升。估计2017年中国射频同轴电缆市场规模达648亿元,预计2018年将达709亿元,同比增长9.4%。
目前,国际射频通信电缆市场集中度相对偏高,美国百通(Belden)、美国戈尔(Gore)、瑞典哈博(Habia)、美国时代微波(Times)、法国耐克森(Nexans)、日本住友(Sumitomo)、日本日立(Hitachi)等企业占据了大部分市场。这些跨国企业具有资金、技术、研发、营销等方面的优势,对市场需求变化和技术更新的反映较为迅速,具有较强竞争力。
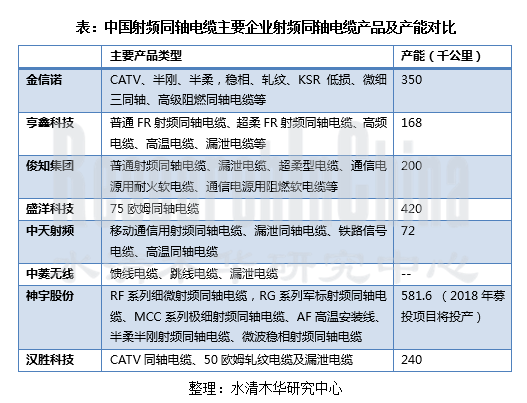
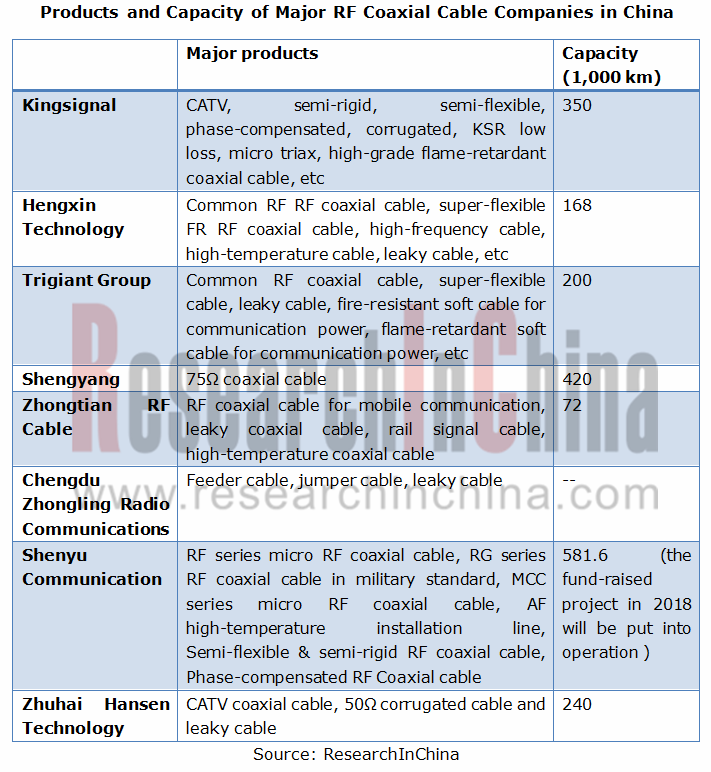
中国射频同轴电缆企业主要包括:金信诺、亨鑫科技、俊知集团、盛洋科技、中天射频、中菱无线、神宇股份、汉胜科技等。其中,神宇股份和盛洋科技产能相对更高,分别达581.6千公里和420千公里。
未来,在全球5G网络将迅速发展的同时,电子产品、汽车工业、医疗事业、物联网的不断升级,电子及航空领域需求也不断增长,极大地推动了射频同轴电缆行业的发展。预计未来5年,中国射频同轴电缆市场规模将稳步上升,到2022年有望突破千亿大关,达到1021亿元。
《2018-2022年全球及中国射频同轴电缆行业研究报告》主要包含以下内容:
 射频同轴电缆市场分析,包括对全球及中国市场的发展现状、市场规模、竞争格局等进行分析; 射频同轴电缆市场分析,包括对全球及中国市场的发展现状、市场规模、竞争格局等进行分析;
射频同轴电缆细分市场分析,包括市场需求及竞争格局分析;
射频同轴电缆下游行业发展分析;
国外7家,国内10家射频同轴电缆企业分析,对包括经营情况、营收构成、毛利率、研发投资、射频同轴电缆业务、发展战略等进行分析。
Benefitted from fast development of downstream sectors, and constant increase of category and technology requirement of RF coaxial cable from high-end equipment, the market size of RF coaxial cable swells year by year.
Take RF coaxial cable for mobile communications as example: global telecom market now still puts its focus on building 4G network, although few developed countries are about to finish 4G network construction, and many others however are still building. America, Japan, South Korea and China also have started pilots to test 5G network. Therefore, the demand for RF coaxial cable for mobile communication grows fast. It was predicted that in 2018 the market would be valued at USD6.51 billion.
China has built the world's largest 4G network. As of 2017, the total number of mobile network users in China reached approximately 1.417 billion, including about 997 million 4G network users with a penetration rate of 70.4%. The construction of 4G network has driven and accelerated the infrastructure of mobile communications. As of September 2018, the number of mobile communication base stations in China had hit 6.39 million, of which 4.79 million or 74.9% were 3G/4G base stations.
With the full deployment of 4G, the launch of 5G trials and the upcoming 5G commercialization, the scale of Chinese RF coaxial cable market has expanded year by year. It is estimated that the market size will value RMB64.8 billion in 2017 and RMB70.9 billion in 2018 with a year-on-year growth rate of 9.4%.
Global communication RF cable market has a high concentration. Multinational corporations like Belden, Gore, Habia, Times, Nexans, Sumitomo and Hitachi are powerful in capital, technology, research and development and marketing, and are also sensitive to demand change and needs of technology upgrade, through which they dominate the market and remain very competitive.
RF coaxial cable companies in China mainly include Kingsignal, Hengxin Technology, Trigiant Group, Shengyang, Zhongtian RF Cable, Chengdu Zhongling Radio Communications, Shenyu Communication and Zhuhai Hansen Technology, etc. Among them, Shenyu Communication and Shengyang take relatively high capacity of 581,600 km and 420,000 km.
In future, accompanied by the prosperous development of 5G network, the constant upgrade of electronics products, automobile industry, medical care sector and Internet of Things, and increasing demand from electronics and aviation industry, RF coaxial cable industry will be greatly propelled. It is forecasted in future five years, the market size of RF coaxial cable industry in China will go up steadily, and hit RMB102.1 billion in 2022.
Global and China RF Coaxial Cable Industry Report, 2018-2022 highlights the followings:
 RF coaxial cable market analysis, including development status, market size, competitive landscape in China and worldwide; RF coaxial cable market analysis, including development status, market size, competitive landscape in China and worldwide;
RF coaxial cable market segments (semi-flexible cable, low loss cable, corrugated cable, phase-compensated cable, and leaky cable) in China, including market demand and competitive landscape;
RF coaxial cable downstream industry development;
7 foreign and 10 Chinese companies (operation, revenue structure, gross margin, R&D and investment, RF coaxial cable business, development strategy, etc).
第一章 行业概述
1.1 定义及分类
1.1.1 定义
1.1.2 分类
1.2 产业链
第二章 射频同轴电缆市场分析
2.1 全球市场概况
2.1.1 发展历程
2.1.2 需求情况
2.1.3 市场规模
2.1.4 竞争格局
2.2 中国市场概况
2.2.1 发展现状
2.2.2 市场规模
2.2.3 需求情况
2.2.4 竞争格局
2.2.5 总结预测
第三章 射频同轴电缆细分市场分析
3.1 半柔电缆
3.1.1 市场需求
3.1.2 竞争格局
3.2 低损电缆
3.2.1 市场需求
3.2.2 竞争格局
3.3 轧纹电缆
3.3.1 市场需求
3.3.2 竞争格局
3.4 稳相电缆
3.4.1 市场需求
3.4.2 竞争格局
3.5 微细与极细同轴电缆
3.5.1 市场需求
3.5.2 竞争格局
3.6 漏泄电缆
第四章 射频同轴电缆下游行业发展概况
4.1 手机、笔记本电脑行业
4.2 汽车行业
4.3 移动通信行业
4.4 航天、军工行业
第五章 国外主要射频同轴电缆企业
5.1 百通
5.1.1 企业简介
5.1.2 经营情况
5.1.3 营收构成
5.1.4 毛利率
5.1.5 在华业务
5.2 戈尔
5.2.1 公司简介
5.2.2 射频同轴电缆业务
5.3 哈博
5.3.1 企业简介
5.3.2 经营情况
5.3.3 营收构成
5.3.4 在华业务
5.4 安费诺
5.4.1 企业简介
5.4.2 经营情况
5.4.3 营收构成
5.4.4 在华业务
5.4.5 安诺费时代微波
5.5 日本住友(Sumitomo)
5.5.1 企业简介
5.5.2 经营情况
5.5.3 营收构成
5.5.4 资本投资
5.5.5 在华发展
5.6 康普
5.6.1 企业简介
5.6.2 经营情况
5.6.3 营收构成
5.6.4 安德鲁
5.6.5 在华发展
5.7 耐克森
5.7.1 公司简介
5.7.2 经营情况
5.7.3 营收构成
5.7.4 在华发展
5.8 灏讯
5.8.1 企业简介
5.8.2 经营情况
5.8.3 营收构成
5.8.4 在华发展
5.9 日立金属(Hitachi)
5.9.1 企业简介
5.9.2 经营情况
5.9.3 营收构成
5.9.4 电缆相关业务
5.9.5 在华发展
第六章 中国主要射频同轴电缆企业
6.1 金信诺
6.1.1 企业简介
6.1.2 经营情况
6.1.3 营收构成
6.1.4 毛利率
6.1.5 研发投资
6.1.6 射频同轴电缆业务
6.1.7 发展战略
6.2 亨鑫科技
6.2.1 企业简介
6.2.2 经营情况
6.2.3 营收构成
6.2.4 毛利率
6.2.5 射频同轴电缆业务
6.2.6 发展战略
6.3 俊知集团
6.3.1 企业简介
6.3.2 经营情况
6.3.3 营收构成
6.3.4 毛利率
6.3.5 射频同轴电缆业务
6.3.6 发展战略
6.4 盛洋科技
6.4.1 企业简介
6.4.2 经营情况
6.4.3 营收构成
6.4.4 毛利率
6.4.5 研发投资
6.4.6 射频同轴电缆业务
6.4.7 发展战略
6.5 中天射频
6.5.1 企业简介
6.5.2 经营情况
6.5.3 产销量
6.6 成都中菱无线通信电缆有限公司
6.6.1 企业简介
6.6.2 经营情况
6.7 珠海汉胜科技股份有限公司
6.7.1 企业简介
6.7.2 发展历程
6.8 神宇股份
6.8.1 公司简介
6.8.2 经营情况
6.8.3 营收构成
6.8.4 产销量
6.8.5 研发投资
6.8.6 发展战略
6.9 其他企业
6.9.1 新泰爱克电缆有限公司
6.9.2 天津609电缆有限公司
1. Industry Overview
1.1 Definition and Classification
1.1.1 Definition
1.1.2 Classification
1.2 Industry Chain
2. RF Coaxial Cable Market
2.1 Global
2.1.1 Development Course
2.1.2 Demand
2.1.3 Market Size
2.1.4 Competitive Landscape
2.2 China
2.2.1 Development
2.2.2 Market Size
2.2.3 Demand
2.2.4 Competitive Landscape
2.2.5 Summary and Forecast
3. Market Segments
3.1 Semi-flexible Cable
3.1.1 Market Demand
3.1.2 Competitive Landscape
3.2 Low Loss Cable
3.2.1 Market Demand
3.2.2 Competitive Landscape
3.3 Corrugated Cable
3.3.1 Market Demand
3.3.2 Competitive Landscape
3.4 Phase-compensated Cable
3.4.1 Market Demand
3.4.2 Competitive Landscape
3.5 Micro Coaxial Cable
3.5.1 Market Demand
3.5.2 Competitive Landscape
3.6 Leaky Cable
4. Downstream Industry Development
4.1 Mobile Phone & Notebook PC Industry
4.2 Automobile Industry
4.3 Mobile Communication Industry
4.4 Aerospace & Military Industry
5.Major Global RF Coaxial Cable Companies
5.1 Belden
5.1.1 Profile
5.1.2 Operation
5.1.3 Revenue Structure
5.1.4 Gross Margin
5.1.5 Business in China
5.2 Gore
5.2.1 Profile
5.2.2 RF Coaxial Cable Business
5.3 Habia
5.3.1 Profile
5.3.2 Operation
5.3.3 Revenue Structure
5.3.4 Business in China
5.4 Amphenol
5.4.1 Profile
5.4.2 Operation
5.4.3 Revenue Structure
5.4.4 Business in China
5.4.5 Amphenol Times Microwave
5.5 Sumitomo
5.5.1 Profile
5.5.2 Operation
5.5.3 Revenue Structure
5.5.4 Capital Investment
5.5.5 Business in China
5.6 Commscope
5.6.1 Profile
5.6.2 Operation
5.6.3 Revenue Structure
5.6.4 Andrew
5.6.5 Development in China
5.7 NEXANS
5.7.1 Profile
5.7.2 Operation
5.7.3 Revenue Structure
5.7.4 Business in China
5.8 HUBER+SUHNER
5.8.1 Profile
5.8.2 Operation
5.8.3 Revenue Structure
5.8.4 Business in China
5.9 Hitachi Metals
5.9.1 Profile
5.9.2 Operation
5.9.3 Revenue Structure
5.9.4 Cable-related Business
5.9.5 Business in China
6. Major Chinese RF Coaxial Cable Companies
6.1 Kingsignal Technology
6.1.1 Profile
6.1.2 Operation
6.1.3 Revenue Structure
6.1.4 Gross Margin
6.1.5 R&D and Investment
6.1.6 RF Coaxial Cable Business
6.1.7 Development Strategy
6.2 Jiangsu Hengxin Technology Co., Ltd
6.2.1 Profile
6.2.2 Operation
6.2.3 Revenue Structure
6.2.4 Gross Margin
6.2.5 RF Coaxial Cable Business
6.2.6 Development Strategy
6.3 Trigiant Group
6.3.1 Profile
6.3.2 Operation
6.3.3 Revenue Structure
6.3.4 Gross Margin
6.3.5 RF Coaxial Cable Business
6.3.6 Development Strategy
6.4 Zhejiang Shengyang Science and Technology Co., Ltd.
6.4.1 Profile
6.4.2 Operation
6.4.3 Revenue Structure
6.4.4 Gross Margin
6.4.5 R&D Investment
6.4.6 RF Coaxial Cable Business
6.4.7 Development Strategy
6.5 Zhongtian Radio Frequency Cable Co., Ltd.
6.5.1 Profile
6.5.2 Operation
6.5.3 Output and Sales Volume
6.6 Chengdu Zhongling Radio Communications Co., Ltd.
6.6.1 Profile
6.6.2 Operation
6.7 Zhuhai Hansen Technology Co., Ltd.
6.7.1 Profile
6.7.2 Development Course
6.8 Shenyu Communication Technology Inc.
6.8.1 Profile
6.8.2 Operation
6.8.3 Revenue Structure
6.8.4 Output & Sales Volume
6.8.5 R&D Investment
6.8.6 Development Strategy
6.9 Others
6.9.1 AcomeXintai Cables Co., Ltd.
6.9.2 Tianjin 609 Cable Co., Ltd.
图:射频同轴电缆结构图
表 :射频同轴电缆分类
图:全球射频同轴电缆行业发展历程
图:全球射频同轴电缆下游发展情况
图:2007-2018年全球移动通信用射频同轴电缆市场规模
图:2012-2018年全球射频75Ω同轴电缆市场容量
表:全球主要射频同轴电缆企业
图:2007-2018年中国射频同轴电缆市场规模
表:下游行业对射频同轴电缆的需求情况
表:国内外射频同轴电缆市场及企业对比
表:中国射频同轴电缆主要企业射频同轴电缆产品及产能对比
表:2013-2017年中国主要射频同轴电缆生产企业射频同轴电缆销量对比
表:2013-2018年中国射频同轴电缆主要企业营业收入对比
表:2013-2018年中国射频同轴电缆主要企业净利润对比
图:2017-2022年中国射频同轴电缆市场规模
图:2007-2018年全球移动通信半柔电缆市场容量
图:2007-2018年中国移动通信半柔电缆市场容量
图:2015年中国半柔电缆市场主要企业市场份额
图:2018年中国半柔电缆市场主要企业市场份额
图:2007-2018年全球低损电缆市场容量
图:2007-2018年中国低损电缆市场容量
图:2015年中国低损电缆主要企业市场份额
图:2018年中国低损电缆主要企业市场份额
图:2007-2018年中国轧纹电缆市场容量
图:2015年中国轧纹电缆主要企业市场份额
图:2018年中国轧纹电缆主要企业市场份额
图 :2007-2018年全球稳相电缆市场容量
图:2007-2018年中国稳相电缆市场容量
图:2015年全球稳相电缆主要企业市场份额
图:2018年全球稳相电缆主要企业市场份额
图:2007-2018 年全球微细同轴传输器件市场容量
图:2011-2018年中国移动通信终端用微细同轴电缆市场容量
图:2018年中国微细同轴电缆主要企业市场份额
表:2011-2020年中国漏泄电缆市场用量
图:2017-2022年全球手机出货量及同比增长率
图:2009-2017年中国智能手机出货量及同比增长率
图:2012-2018年全球笔记本电脑出货量
图:2016-2018年中国移动通信基站数量
图:2010-2018年中国国防预算及同比增长率
图:Belden生产基地分布情况
图:2009-2018年Belden营业收入及净利润
图:2017-2020年Belden财务目标
图:2015-2017年Belden营业收入构成(分部门)
图:2015-2017年Belden营业收入(分地区)
图:2015-2018年Belden毛利率
图:2011-2017年Belden在华收入及同比增长率
表:百通在华子公司
表:戈尔同轴和微波/射频电缆产品
图:哈博全球布局
图:哈博发展历程
图:2013-2017年哈博经营业绩
图:2017年哈博营业收入构成(分行业)
图:2017年哈博Telecom行业营业收入构成(分地区)
图:2017年哈博其他行业营业收入构成(分地区)
图:Amphenol全球布局情况
图:2009-2018年Amphenol营业收入及净利润
图:2014-2018年Amphenol营业收入(分产品)
图:2011-2018年Amphenol营业收入构成(分产品)
图:2014-2018年Amphenol营业收入(分地区)
图:2011-2018年Amphenol营业收入构成(分地区)
表:Amphenol在华主要企业
图:2011-2018年Amphenol在华收入及同比增长率
图:2022年日本住友发展规划
图:截至2018年3月31日日本住友子公司及工厂数量
图:FY2010-2018年日本住友营业收入及净利润
图:FY2012-2018年日本住友营业收入(分地区)
图:FY2012-2018年日本住友营业收入构成(分地区)
图:FT2012-2018年日本住友营业收入(分部门)
图:FT2012-2018年日本住友营业收入构成(分部门)
图:FY2015-2018年日本住友资本投资额(分地区及部门)
图:FY2016-2018年日本住友研发支出(分部门)
图:FY2010-2017财年日本住友在华收入
图:日本住友在华子公司业务及分布
图:康普发展历程
图:2010-2018年康普营业收入及净利润
图:2014-2018年康普营业收入构成(分部门)
图:2014-2017年康普营业收入(分地区)
图:2014-2017年康普营业收入构成(分地区)
图:截至2017年底耐克森人员分布
图:耐克森旧部门分类
图:耐克森新部门分类
图:2009-2018年耐克森营业收入及净利润
图:2017-2018年耐克森营业收入构成(分部门)
图:耐克森在华分布
图:耐克森在华发展历程
图:2017年灏讯三维发展图
图:灏讯股权结构
图:灏讯全球布局情况
图:2009-2018年灏讯营业收入及净利润
图:2009-2018年灏讯在手订单额
图:2013-2018年灏讯营业收入(分产品)
图:2013-2018年灏讯营业收入构成(分产品)
图:2013-2018年灏讯在手订单额(分产品)
图:2013-2018年灏讯在手订单额构成(分产品)
图:FY2012-2018年日立金属营业收入及净利润
图:FY2014-2018财年日立金属营业收入(分部门)
图:FY2014-2018财年日立金属营业收入构成(分部门)
图:FY2014-2017财年日立金属营业收入(分地区)
图:FY2014-2017财年日立金属营业收入构成(分地区)
图:FY2014-2018财年日立金属电缆相关业务收入及占比
图:日本日立电缆相关业务生产基地及公司分布
图:日立金属在华分布
图:2009-2018年金信诺营业收入及净利润
图:2014-2018年金信诺营业收入(分产品)
图:2014-2018年金信诺营业收入构成(分产品)
图:2014-2018年金信诺毛利率(分产品)
表:截至2018上半年金信诺募投项目进度
图:2013-2018年金信诺研发投入及占比
图:2013-2017年金信诺通信电缆及光纤光缆产销量
图:2009-2018年亨鑫科技营业收入及净利润
图:2011-2018年亨鑫科技营业收入构成(分产品)
图:2011-2018年亨鑫科技毛利率
图:2013-2018年亨鑫科技FR同轴电缆营业收入及同比增长率
图:2011-2018年俊知集团营业收入及净利润
图:2013-2018年俊知集团营业收入(分产品)
图:2013-2018年俊知集团营业收入构成(分产品)
图:2013-2018年俊知集团毛利率
图:2013-2018年俊知集团射频同轴电缆销量
图:2013-2018年俊知集团射频同轴电缆销售收入及占比
图:2013-2018年俊知集团射频同轴电缆毛利率
图:2012-2018年盛洋科技营业收入及净利润
图:2015-2018年盛洋科技营业收入(分地区)
图:2015-2018年盛洋科技营业收入构成(分地区)
图:2014-2017年盛洋科技毛利率
图:2014-2017年盛洋科技毛利率(分地区)
图:2015-2018年盛洋科技研发投入及占比
图:2015-2018年盛洋科技同轴电缆业务收入及占比
图:2014-2017年盛洋科技同轴电缆产销量
图:2009-2018年中天射频营业收入及净利润
图:2012-2015年中天射频射频电缆产销量
图:2013-2018年中菱无线营业收入及净利润
表:汉胜科技发展历程
图:2013-2018年神宇股份营业收入及净利润
图:2015-2018年神宇股份射频同轴电缆收入及占比
图:2013-2017年神宇股份射频同轴电缆产销量
图:2013-2018年神宇股份研发支出及占比
表:2016年神宇股份IPO募投项目
表:截至2018上半年神宇股份募投项目进展情况
图:新泰爱克Hypercell馈线电缆分类
图:新泰爱克Hypercell馈线电缆系列衰减率
Structure of RF Coaxial Cable
Classification of RF Coaxial Cable
Development Course of Global RF Coaxial Cable Industry
Downstream Development of Global RF Coaxial Cable
Global Market Size of RF Coaxial Cable for Mobile Communication, 2007-2018
Global RF 75Ω Coaxial Cable Market Capacity, 2012-2018
Major RF Coaxial Cable Companies Worldwide
Chinese RF Coaxial Cable Market Size, 2007-2018
Demand for RF Coaxial Cable from Downstream Industries
Comparison of RF Coaxial Cable Markets and Companies in China and Overseas Countries
Products and Capacity of Major RF Coaxial Cable Companies in China
Sales Volume of RF Coaxial Cable of Major RF Coaxial Cable Companies in China, 2013-2017
Revenue of Major RF Coaxial Cable Companies in China, 2013-2018
Net Income of Major RF Coaxial Cable Companies in China, 2013-2018
Market Size of RF Coaxial Cable in China, 2017-2022E
Global Market Capacity of Semi-flexible Cable for Mobile Communications, 2007-2018
Market Capacity of Semi-flexible Cable for Mobile Communications in China, 2007-2018
Market Share of Major Semi-flexible Cable Companies in China, 2015
Market Share of Major Semi-flexible Cable Companies in China, 2018
Global Low Loss Cable Market Capacity, 2007-2018
Chinese Low Loss Cable Market Capacity, 2007-2018
Market Share of Major Low Loss Cable Companies in China, 2015
Market Share of Major Low Loss Cable Companies in China, 2018
Chinese Corrugated Cable Market Capacity, 2007-2018
Market Share of Major Corrugated Cable Companies in China, 2015
Market Share of Major Corrugated Cable Companies in China, 2018
Global Phase-compensated Cable Market Capacity, 2007-2018
Chinese Phase-compensated Cable Market Capacity, 2007-2018
Market Share of Major Global Phase-compensated Cable Companies, 2015
Market Share of Major Global Phase-compensated Cable Companies, 2018
Global Micro Coaxial Transmission Device Market Capacity, 2007-2018
Chinese Market Capacity of Micro Coaxial Cable for Mobile Communication Terminal, 2011-2018
Market Share of Major Micro Coaxial Cable Companies in China, 2015
Market Share of Major Micro Coaxial Cable Companies in China, 2018
Chinese Leaky Cable Market Capacity, 2011-2020E
China Smart Phone Shipments, 2009-2017
Global Mobile Phone Shipments, 2017-2022E
Global Notebook PC Shipments, 2012-2018
Global Automobile Output, 2006-2022E
Output and Sales Volume of Automobile in China, 2012-2022E
Number of Base Stations for Mobile Communication in China, 2016-2018
China Defense Budget, 2010-2018
Distribution of Belden’s Production Bases
Revenue and Net Income of Belden, 2009-2018
Financial Goals of Belden, 2017-2020E
Revenue Structure of Belden by Segment, 2015-2017
Revenue Structure of Belden by Region, 2015-2017
Gross Margin of Belden, 2015-2018
Belden’s Subsidiaries in China
Belden’s Revenue in China and YoY Growth, 2011-2017
Coaxial and Microwave/RF Cable Products of Gore
Global Layout of Habia
Development Course of Habia
Performance of Habia, 2013-2017
Revenue Structure of Habia by Segment, 2017
Revenue Structure of Habia by Region, 2017
Other Industries' Revenue Structure of Habia by Region, 2017
Global Layout of Amphenol
Revenue and Net Income of Amphenol, 2009-2018
Revenue of Amphenol by Product, 2014-2018
Revenue Structure of Amphenol by Product, 2011-2018
Revenue of Amphenol by Region, 2014-2018
Revenue Structure of Amphenol by Region, 2011-2018
Major Subsidiaries of Amphenol in China
Amphenol’s Revenue in China and YoY Growth, 2011-2018
Mid-term Management Plan of Sumitomo, 2022E
Number of Subsidiaries and Plants of Sumitomo by Region by the end of Mar. 2018
Net Sales and Net Income of Sumitomo, FY2010-FY2018
Net Sales of Sumitomo by Region, FY2012-FY2018
Net Sales Structure of Sumitomo by Region, FY2012-FY2018
Net Sales of Sumitomo by Segment, FY2012-FY2018
Net Sales Structure of Sumitomo by Segment, FY2012-FY2018
Capital Investment of Sumitomo by Region and Segment, FY205-FY2018
R&D expenditures of Sumitomo by Segment, FY2016-FY2018
Sumitomo’s Sales in China, FY2010-FY2017
Business Presence of Sumitomo’s Subsidiaries in China
Development Course of CommScope
Revenue and Net Income of CommScope, 2010-2018
Revenue Structure of CommScope by Segment, 2014-2018
Revenue of CommScope by Region, 2014-2017
Revenue Structure of CommScope by Region, 2014-2017
Staff Distribution of Nexans, end-2017
Original Business Segment of Nexans
New Business Segment of Nexans
Revenue and Net Income of Nexans, 2009-2018
Revenue Structure of Nexans by Segment, 2017-2018
Nexans’ Presence in China
Nexans’ Development Course in China
3D Diagram for Business Development of HUBER+SUHNER, 2017
Equity Structure of HUBER+SUHNER
Global Presence of HUBER+SUHNER
Revenue and Net Income of HUBER+SUHNER, 2009-2018
Order Intake of HUBER+SUHNER, 2009-2018
Revenue Breakdown of HUBER+SUHNER by Product, 2013-2018
Revenue Structure of HUBER+SUHNER by Product, 2013-2018
Order Intake of HUBER+SUHNER by Product, 2013-2018
Order Intake Structure of HUBER+SUHNER by Product, 2013-2018
Net Sales and Net Income of Hitachi Metals, FY2012-FY2018
Net Sales of Hitachi Metals by Segment, FY2014-FY2018
Net Sales Structure of Hitachi Metals by Segment, FY2014-FY2018
Net Sales of Hitachi Metals by Region, FY2014-FY2017
Net Sales Structure of Hitachi Metals by Region, FY2014-FY2017
Revenue of Cable-related Business of Hitachi Metals, FY2014-FY2018
Hitachi Metals’ Production Bases and Companies that Get Involved in Cable-related Business
Hitachi Metal's Presence in China
Revenue and Net Income of Kingsignal, 2009-2018
Revenue Breakdown of Kingsignal by Product, 2014-2018
Revenue Structure of Kingsignal by Product, 2014-2018
Gross Margin of Kingsignal by Product, 2014-2018
Progress of Kingsignal’s Fundraising Projects, H1 2018
R&D Input and % of Kingsignal, 2013-2018
Output and Sales Volume of Communication Cable and Optical Cable of Kingsignal, 2013-2017
Revenue and Net Income of Hengxin Technology, 2009-2018
Revenue Structure of Hengxin Technology by Product, 2011-2018
Gross Margin of Hengxin Technology, 2011-2018
RF Coaxial Cable Revenue of Hengxin Technology, 2013-2018
Revenue and Net Income of Trigiant Group, 2011-2018
Revenue breakdown of Trigiant Group by Product, 2013-2018
Revenue Structure of Trigiant Group by Product, 2013-2018
Gross Margin of Trigiant Group, 2013-2018
RF Coaxial Cable Sales Volume of Trigiant Group, 2013-2018
RF Coaxial Cable Revenue of Trigiant Group, 2013-2018
RF Coaxial Cable Gross Margin of Trigiant Group, 2013-2018
Revenue and Nei Income of Shengyang Science and Technology, 2012-2018
Revenue of Shengyang Science and Technology by Region, 2015-2018
Revenue Structure of Shengyang Science and Technology by Region, 2015-2018
Gross Margin of Shengyang Science and Technology, 2014-2017
Gross Margin of Shengyang Science and Technology by Region, 2014-2017
R&D Investment of Shengyang Science and Technology, 2015-2018
Revenue of RF Coaxial Cable of Shengyang Science and Technology, 2015-2018
RF Coaxial Cable Output and Sales Volume of Shengyang Science and Technology, 2014-2017
Revenue and Net Income of Zhongtian RF Cable, 2009-2018
Coaxial Cable Output and Sales Volume of Zhongtian RF Cable, 2012-2015
Revenue and Net Income of Zhongling Radio Communications, 2013-2018
Development Course of Zhuhai Hansen Technology
Revenue and Net Income of Shenyu Communication, 2013-2018
RF Coaxial Cable Revenue of Shenyu Communication, 2015-2018
RF Coaxial Cable Output and Sales Volume of Shenyu Communication, 2013-2017
R&D Investment of Shenyu Communication, 2013-2018
IPO Fund-raising Projects of Shenyu Communication, 2016
Progress of Fund-raised Projects of Shenyu Communication, as of 2018H1
Classification of AcomeXintai Cables’ Hypercell Feeder Cables
Attenuation Rate of AcomeXintai Cables’ Hypercell Feeder Cable Series
如果这份报告不能满足您的要求,我们还可以为您定制报告,请 留言说明您的详细需求。
|