|
|
|
报告导航:研究报告—
制造业—化工
|
|
2018-2023年中国合成橡胶行业研究报告 |
 |
字数:4.1万 |
页数:153 |
图表数:167 |
|
中文电子版:8000元 |
中文纸版:6400元 |
中文(电子+纸)版:8500元 |
|
英文电子版:2800美元 |
英文纸版:3000美元 |
英文(电子+纸)版:3100美元 |
|
编号:CYH081
|
发布日期:2019-01 |
附件:下载 |
 |
|
|
2018年中国主要合成橡胶装置总产能约666.7万吨/年,共新增有效供给产能约13万吨/年,考虑到产能调整,预计2019年中国七大合成橡胶及SBCs的总能力在687万吨/年左右,新增产能20.5万吨/年,但多套装置能否按时投产,仍存在较大的不确定性。
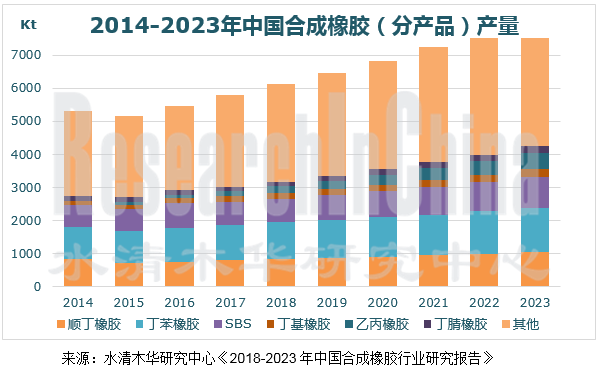
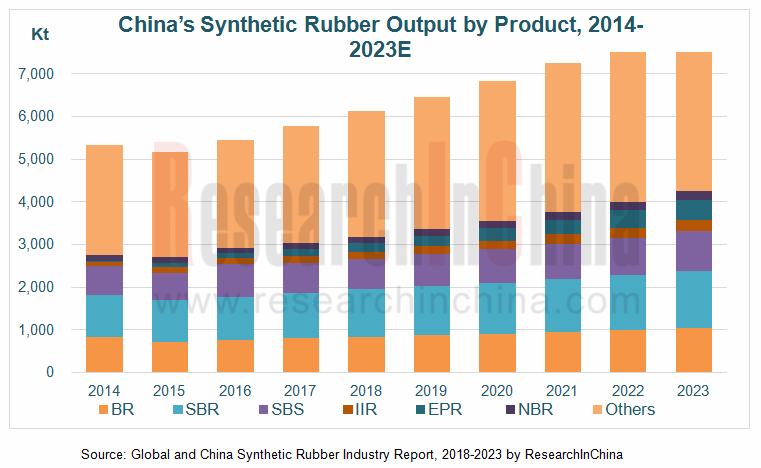
近两年,受市场价格回升等影响,停产多年的多套合成橡胶装置恢复生产,中国合成橡胶市场供需保持平稳发展,2017年,中国合成橡胶产量同比增长6.0%至578.7万吨,2018年约增长至612.3万吨。预计2018-2023年中国合成橡胶产量增速保持在6%左右,至2023年有望达到811.0万吨。
其中,丁苯橡胶和顺丁橡胶是中国最主要的两种合成橡胶品种,2018年其产能分别占中国合成橡胶产能的32.1%和25.8%。其也是中国产量最大的两个品种,2017年合计占合成橡胶的比重为32.4%。但两大产品产量增速明显变缓,而如乙丙橡胶、丁腈橡胶等特种橡胶产品产量增速明显,2018年,乙丙橡胶产量同比增幅约29.5%至20.26万吨,为增速最快的产品。
进出口方面,2018年中国主要合成橡胶产品进出口出现不同幅度下滑,如顺丁橡胶产品,2018年1-11月进口量同比减少27.1%至18.16万吨,而出口量同比下滑8.5%至3.14万吨。一方面由于下游需求发展变缓影响,另一方面由于2018年3月以来,中美贸易冲突加剧,中国橡胶制品产业链上产品几乎均被列入美国2000亿美元征税名单,尽管年底前中美达成协议暂缓增税,但也为中国合成橡胶制品进出口增添变数。
另外,近几年,中国本土部分企业纷纷加大投入,实现新产品的研发突破。如2018年7月,中石油自主研发的官能化溶聚丁苯橡胶SSBR2060在独山子石化首次试产成功; 2018年11月,吉林石化研究院自主开发的高强度丁苯橡胶SBR1566成功完成优化试验。同月,吉林石化乙丙橡胶新牌号X-0150产品开发成功。
水清木华研究中心《2018-2023年中国合成橡胶行业研究报告》着重研究了以下内容: 全球合成橡胶市场供需、产品结构、地区结构及发展趋势等; 全球合成橡胶市场供需、产品结构、地区结构及发展趋势等;
中国合成橡胶市场供需、进出口、产品结构、地区结构、企业格局及发展趋势等;
丁顺橡胶、丁苯橡胶、丁基橡胶、乙丙橡胶和丁腈橡胶等中国合成橡胶主要细分产品市场供需、进出口、企业格局等市场发展情况。
中国丁二烯、苯乙烯和橡胶助剂等合成橡胶主要原材料市场发展情况;
合成橡胶主要下游行业轮胎全球及中国的市场发展情况等;
中国21家合成橡胶重点企业经营情况及发展战略等。
In 2018, China boasted a total synthetic rubber capacity of roughly 6,667kt/a, including 130kt/a new effective capacity. Considering capacity adjustment, China’s capacity of seven synthetic rubbers (BR, SBR, EPR, IIR, NBR, IR and CR) and styrene block copolymer (SBC) will ranged at estimated 6,870kt/a in 2019, 205kt/a of which will be newly added. But it is still very uncertain that the country’s several plants will be put into production as scheduled.
Over the past two years, China’s synthetic rubber market sustained steady growth as a pickup in price among other factors prompted some synthetic rubber plants to resume production after being out of operation for years. China’s output of synthetic rubber reached 5,787 kt in 2017, up 6.0% from a year ago before climbing to 6,123 kt in 2018, and will expectedly hit 8,110kt in 2023, at a growth rate of around 6% during 2018-2023.
Styrene butadiene rubber (SBR) and butadiene rubber (BR) are the two most common synthetic rubbers in China, with capacity respectively accounting for 32.1% and 25.8% of the country’s total synthetic rubber capacity in 2018. With the largest output among main synthetic rubbers, SBR and BR seized a combined 32.4% share of China’s total synthetic rubber output in 2017. But their production growth slowed down evidently, while special rubber products like ethylene propylene rubber (EPR) and nitrile butadiene rubber (NBR) began to boom, especially the fastest-growing EPR whose output jumped by 29.5% to 202.6 kt in 2018.
In 2018, China’s import and export of main synthetic rubbers dropped differently, for example, BR imports and exports fell by 27.1% and 8.5% in the first eleven months of 2018 to 181.6 kt and 31.4 kt from the prior-year period, respectively. Slowing downstream demand was at play in the situation; another cause was the escalating trade tensions between China and America from March 2018: almost all of China’s products in the synthetic rubber industry chain were on the list of America’s tariffs on USD200 billion of Chinese goods. Although both countries had agreed to suspend tariff increase in late 2018, it still hurt China’s imports and exports of synthetic rubber products.
Moreover, Chinese producers tried hard and invested heavily to develop new products in recent years, having made some breakthroughs. Examples include PetroChina’s successful commissioning of self-developed high-strength SBR, SSBR2060 in its Dushanzi Refinery in July 2018; PetroChina Jilin Petrochemical Research Institute’s accomplishment of optimization test of self-developed high-strength SBR, SBR1566 in November 2018 and its successful development of a new ethylene propylene rubber (EPR), X-0150 in the same month.
Global and China Synthetic Rubber Industry Report, 2018-2023 highlights the following:
Global synthetic rubber market (supply and demand, product mix, regional pattern, development trends, etc.);
China synthetic rubber market (supply and demand, import and export, product mix, regional pattern, enterprise pattern, development trends, etc.);
China synthetic rubber market segments (BR, SBR, IIR, EPR and NBR) (supply and demand, import and export, enterprise pattern, etc.);
China synthetic rubber (butadiene, styrene and rubber additive) raw materials market;
Global and Chinese synthetic rubber downstream sector (tire);
21 key Chinese synthetic rubber companies (operation, development strategy, etc.).
第一章 合成橡胶概述
1.1 定义
1.2 分类
1.3 产业链
第二章 全球合成橡胶行业发展概况
2.1 概述
2.2 市场供需
2.3 地区结构
2.4 发展趋势
第三章 中国合成橡胶行业发展概况
3.1 市场供需
3.1.1 市场供给
3.1.2 市场需求
3.2 进出口
3.2.1 进口
3.2.2 出口
3.3 产品结构
3.4 地区分布
3.5 企业格局
3.6 发展趋势
第四章 中国合成橡胶重点细分市场
4.1 顺丁橡胶
4.1.1 市场供给
4.1.2 进出口
4.1.3 市场需求
4.1.4 竞争格局
4.1.5 价格
4.1.6 发展趋势
4.2 丁苯橡胶
4.2.1 市场供给
4.2.2 进出口
4.2..3 市场需求
4.2.4 竞争格局
4.2.5 价格
4.2.6 发展趋势
4.3 乙丙橡胶
4.3.1 市场供给
4.3.2 进出口
4.3.3 市场需求
4.3.4 竞争格局
4.3.5 价格
4.3.6 发展趋势
4.4 丁基橡胶
4.4.1 市场供给
4.4.2 进出口
4.4.3 市场需求
4.4.4 竞争格局
4.4.5 价格
4.4.6 发展趋势
4.5 丁腈橡胶
4.5.1 市场供给
4.5.2 进出口
4.5.3 市场需求
4.5.4 竞争格局
4.5.5 价格
4.5.6 发展趋势
第五章 中国合成橡胶上游分析
5.1 丁二烯
5.1.1 市场供给
5.1.2 进出口
5.1.3 市场需求
5.1.4 价格
5.1.5 竞争格局
5.1.6 发展趋势
5.2 苯乙烯
5.2.1 市场供给
5.2.2 进出口
5.2.3 市场需求
5.2.4 价格
5.2.5 竞争格局
5.2.6 发展趋势
5.3 橡胶助剂
5.3.1 市场供需
5.3.2 价格
5.3.3 企业格局
第六章 轮胎行业市场发展
6.1 全球市场
6.2 中国市场
第七章 中国合成橡胶重点企业
7.1 中国石化
7.1.1 企业简介
7.1.2 经营情况
7.1.3 合成橡胶业务
7.1.4 扬子石化
7.1.5 燕山石化
7.1.6 齐鲁石化
7.1.7 茂名石化
7.1.8 巴陵石化
7.1.9 高桥石化
7.2 中国石油
7.2.1 企业简介
7.2.2 经营情况
7.2.3 合成橡胶业务
7.2.4 兰州石化
7.2.5 吉林石化
7.2.6 大庆石化
7.2.7 独山子石化
7.2.8 锦州石化
7.2.9 抚顺石化
7.2.10 四川石化
7.3 玉皇化工
7.3.1 企业简介
7.3.2 经营情况
7.3.3 合成橡胶业务
7.4 台橡股份
7.4.1 企业简介
7.4.2 经营情况
7.4.3 合成橡胶业务
7.5 蓝德精化
7.5.1 公司简介
7.5.2 经营情况
7.6 镇江南帝化工
7.6.1 企业简介
7.6.2 经营情况
7.7 其他企业
7.7.1 高桥巴斯夫分散体
7.7.2 山西合成橡胶
7.7.3 陶氏化学(张家港)
7.7.4 普利司通(惠州)
7.7.5 杭州浙晨橡胶
7.7.6 天津市陆港石油橡胶
7.7.7 福建湄洲湾氯碱工业
7.7.8 浙江信汇合成材料
7.7.9 重庆化医长寿化工
7.7.10 盘锦和运新材料有限公司
7.7.11 山东华懋新材料
7.7.12 青岛伊科思
7.7.13 宁波顺泽橡胶
7.7.14 山东聚圣科技有限公司
7.7.15 辽宁北方戴纳索合成橡胶
1. Overview of Synthetic Rubber
1.1 Definition
1.2 Classification
1.3 Industrial Chain
2. Overview of Global Synthetic Rubber Industry
2.1 Overview
2.2 Market Supply and Demand
2.3 Regional Structure
2.4 Development Trend
3. Overview of China Synthetic Rubber Industry
3.1 Market Supply and Demand
3.1.1 Market Supply
3.1.2 Market Demand
3.2 Import and Export
3.2.1 Import
3.2.2 Export
3.3 Product Structure
3.4 Regional Distribution
3.5 Enterprise Pattern
3.6 Development Trend
4. Key Chinese Synthetic Rubber Market Segments
4.1 Butadiene Rubber (BR)
4.1.1 Market Supply
4.1.2 Import and Export
4.1.3 Market Demand
4.1.4 Competitive Landscape
4.1.5 Price
4.1.6 Development Trend
4.2 Styrene Butadiene Rubber (SBR)
4.2.1 Market Supply
4.2.2 Import and Export
4.2.3 Market Demand
4.2.4 Competitive Landscape
4.2.5 Price
4.2.6 Development Trend
4.3 Ethylene Propylene Rubber (EPR)
4.3.1 Market Supply
4.3.2 Import and Export
4.3.3 Market Demand
4.3.4 Competitive Landscape
4.3.5 Price
4.3.6 Development Trend
4.4 Isobutylene Isoprene Rubber (IIR)
4.4.1 Market Supply
4.4.2 Import and Export
4.4.3 Market Demand
4.4.4 Competitive Landscape
4.4.5 Price
4.4.6 Development Trend
4.5 Nitrile-butadiene Rubber (NBR)
4.5.1 Market Supply
4.5.2 Import and Export
4.5.3 Market Demand
4.5.4 Competitive Landscape
4.5.5 Price
4.5.6 Development Trend
5. Upstream of Synthetic Rubber in China
5.1 Butadiene
5.1.1 Market Supply
5.1.2 Import and Export
5.1.3 Market Demand
5.1.4 Price
5.1.5 Competitive Landscape
5.1.6 Development Trend
5.2 Styrene
5.2.1 Market Supply
5.2.2 Import and Export
5.2.3 Market Demand
5.2.4 Price
5.2.5 Competitive Landscape
5.2.6 Development Trend
5.3 Rubber Additive
5.3.1 Market Supply and Demand
5.3.2 Price
5.3.3 Competitive Landscape
6. Tire Market Development
6.1 Global Market
6.2 China
7. Key Chinese Synthetic Rubber Enterprises
7.1 Sinopec
7.1.1 Profile
7.1.2 Operation
7.1.3 Synthetic Rubber Business
7.1.4 Sinopec Yangzi Petrochemical
7.1.5 Sinopec Beijing Yanshan
7.1.6 Sinopec Qilu
7.1.7 Sinopec Maoming
7.1.8 Sinopec Baling
7.1.9 Sinopec Shanghai Gaoqiao
7.2 PetroChina
7.2.1 Profile
7.2.2 Operation
7.2.3 Synthetic Rubber Business
7.2.4 PetroChina Lanzhou Petrochemical
7.2.5 PetroChina Jilin Petrochemical
7.2.6 PetroChina Daqing Petrochemical
7.2.7 PetroChina Dushanzi Petrochemical
7.2.8 PetroChina Jinzhou Petrochemical
7.2.9 PetroChina Fushun Petrochemical
7.2.10 PetroChina Sichuan Petrochemical
7.3 Shandong Yuhuang Chemical (Group)
7.3.1 Profile
7.3.2 Operation
7.3.3 Synthetic Rubber Business
7.4 TSRC
7.4.1 Profile
7.4.2 Operation
7.4.3 Synthetic Rubber Business
7.5 Lande Fine Chemical
7.5.1 Profile
7.5.2 Operation
7.6 Zhenjiang Nantex Chemical Industry
7.6.1 Profile
7.6.2 Operation
7.7 Other Enterprises
7.7.1 Gaoqiao BASF Dispersions
7.7.2 Shanxi Synthetic Rubber
7.7.3 Dow Chemical (Zhangjiagang)
7.7.4 Bridgestone (Huizhou)
7.7.5 Hangzhou Zhechen Rubber
7.7.6 Tianjin Lugang Petroleum Rubber
7.7.7 Fujian Meizhouwan Chlor-Alkali Industry
7.7.8 Zhejiang Cenway New Synthetic Materials
7.7.9 Chongqing Changshou Chemical
7.7.10 Panjin Heyun New Materials
7.7.11 Shandong Huamao New Materials
7.7.12 Fushun Yikesi New Materials
7.7.13 Ningbo Shunze Rubber
7.7.14 Shandong Jusage
7.7.15 Liaoning North Dynasol Synthetic Rubber
表:合成橡胶(分品种)性能与应用
表:2015-2018年中国合成橡胶(分企业)产能
表:2018年美国对自中国进口的主要合成橡胶产品加征关税税率增加幅度
表:2019年中国合成橡胶主要发展省市
表:2018年中国合成橡胶前20大企业产能及占比
表:2015-2023年中国合成橡胶产需平衡
表:2012-2018年中国顺丁橡胶(分企业)产能
表:2019年中国在拟建顺丁橡胶项目
表:2018-2023年中国顺丁橡胶供需平衡表
表:2012-2018年中国丁苯橡胶(分企业)产能
表:2018-2021年中国丁苯橡胶供需平衡情况
表:2012-2018年中国乙丙橡胶(分企业)产能分布
表:2019-2023年中国乙丙橡胶拟在建项目
表:2018-2023年中国乙丙橡胶供需情况
表:2012-2018年中国丁基橡胶(分企业)产能分布
表:2018-2023年中国丁基橡胶在拟建项目
表:2018-2023年中国丁基橡胶供需平衡情况
表:2018年全球丁腈橡胶(分企业)产能及占比
表:2010-2017年中国丁腈橡胶(分产品)进出口量
表:2010-2018年中国丁腈橡胶(分企业)产能
表:2018-2023年中国丁腈橡胶供需平衡情况
表:2010-2018年中国丁二烯(分企业)产能分布
表:2019-2023年中国丁二烯在拟建项目
表:2018-2023年中国丁二烯供需情况
表:2016-2018年中国苯乙烯(分国家/地区)进口量构成
表:2010-2018年中国苯乙烯(分企业)产能分布
表:2019-2023年中国苯乙烯在拟建项目
表:2018-2023年中国苯乙烯供需平衡
表:2018年中国橡胶助剂企业TOP10
表:2019年中国主要轮胎企业轮胎价格上涨情况
表:扬子石化橡胶公司主要丁苯橡胶产品简介
表:2018年玉皇化工主要子公司分布
表:2010-2017年玉皇化工公司合成橡胶产能、产量和销量
表:2014-2017年台橡股份(分产品)营业收入及占比
表:2013-2017年台橡股份(分产品)产能、产量及产值
表:2018年台橡股份(分企业/产品)合成橡胶产能
表:山纳公司氯丁橡胶产品简介
表:浙晨橡胶公司合成橡胶产品
表:天津陆港石油橡胶公司项目投资和产能
表:长寿化工氯丁橡胶产品简介
表:2018年宁波顺泽橡胶公司(分牌号)丁腈橡胶产品
图:合成橡胶产业链
图:2011-2018年全球合成橡胶产能
图:2008-2018年全球合成橡胶产量及消费量
图:2008-2017年全球合成橡胶产量及消费量占比
图:2017年全球合成橡胶(分产品)产能构成
图:2010-2016年全球(分地区)合成橡胶产能
图:2014-2017年全球(分地区)合成橡胶产量
图:2008-2017年全球(分地区)合成橡胶消费量
图:2017-2023年全球合成橡胶产量与消费量
图:2017年中国合成橡胶(分产品)全球产能占比
图:2012-2018年中国合成橡胶产能及同比增长
图:2007-2018年中国合成橡胶产量及同比增长
图:2007-2018年中国合成橡胶表观消费量及自给率
图:2007-2018年中国合成橡胶进口量及同比增长
图:2007-2018年中国合成橡胶进口额及同比增长
图:2007-2017年中国合成橡胶出口量及同比增长
图:2010-2017年中国合成橡胶出口额及同比增长
图:2012-2018年中国合成橡胶(分产品)产能
图:2017&2023年中国合成橡胶(分品种)产量
图:2016-2017年中国合成橡胶(按产量)前十强省份
图:2014-2023年中国合成橡胶(分产品)产量
图:2008-2018年中国顺丁橡胶产能及同比增长
图:2008-2018年中国顺丁橡胶产量及同比增长
图:2017-2018年中国顺丁橡胶装置开工率
图:2008-2018年中国顺丁橡胶进口量及同比增长
图:2008-2018年中国顺丁橡胶出口量及同比增长
图:2008-2018年中国顺丁橡胶表观消费量与自给率
图:2011-2018年中国顺丁橡胶(分用途)需求量占比
图:2018年中国顺丁橡胶(按产能)企业格局
图:2018年中国顺丁橡胶BR9000价格走势
图:2006-2018年顺丁橡胶价格走势
图:2008-2018年中国丁苯橡胶(分产品)产能
图:2008-2018年中国丁苯橡胶产量及同比增长
图:2017-2018年中国乳聚丁苯橡胶装置开工率
图:2008-2018年中国丁苯橡胶进口量及同比增长
图:2008-2018年中国丁苯橡胶出口量及同比增长
图:2008-2018年中国丁苯橡胶表观消费量与自给率
图:2018年中国丁苯橡胶(分用途)需求量占比
图:2018年中国丁苯橡胶(按产能)各企业市场份额
图:2018年中国丁苯橡胶1502#价格走势
图:2014-2018年中国丁苯橡胶齐鲁1502市场价格走势(元/吨)
图:2017年全球乙丙橡胶(分地区)产能分布
图:2008-2018年中国乙丙橡胶产量及同比增长
图:2018年中国乙丙橡胶开工率
图:2008-2018年中国乙丙橡胶进口量及同比增长
图:2008-2018年中国乙丙橡胶出口量及同比增长
图:2008-2018年中国乙丙橡胶表观消费量与自给率
图:2019年中国乙丙橡胶(分用途)需求量占比
图:2012-2018年中国三元乙丙橡胶4045市场均价
图:2008-2018年中国丁基橡胶产量及同比增长
图:2008-2018年中国丁基橡胶进口量及同比增长
图:2008-2018年中国丁基橡胶出口量及同比增长
图:2008-2018年中国丁基橡胶表观消费量及自给率
图:2018年中国丁基橡胶(分用途)需求量占比
图:2018年中国普通丁基橡胶和卤化丁基橡胶价格走势
图:2017-2018年普通丁基橡胶1675N价格走势
图:2008-2018年中国丁腈橡胶产能及产能利用率
图:2008-2018年中国丁腈橡胶产量及同比增长
图:2008-2018年中国丁腈橡胶进口量及同比增长
图:2008-2018年中国丁腈橡胶出口量及同比增长
图:2007-2017年中国丁腈橡胶表观消费量与自给率
图:2018年中国丁腈橡胶(分用途)需求量占比
图:2018年中国丁腈橡胶(分企业)产能占比
图:2018年中国丁腈橡胶价格走势
图:2010-2018年中国丁二烯产能及产能利用率
图:2008-2018年中国丁二烯产量及同比增长
图:中国丁二烯生产工艺占比
图:2008-2018年中国丁二烯进口量及同比增长
图:2007-2017年中国丁二烯出口量及同比增长
图:2008-2018年中国丁二烯表观消费量与自给率
图:2011-2017年丁二烯下游消费量统计
图:2018年中国丁二烯市场价格
图:2010-2018年中国丁二烯产能(分企业)结构
图:2010-2018年中国苯乙烯产能及产能利用率
图:2008-2018年中国苯乙烯产量及同比增长
图:2018年中国苯乙烯(分地区)产能分布
图:2017-2018年中国非一体化苯乙烯厂家生产成本
图:2008-2018年中国苯乙烯进口量及同比增长
图:2008-2018年中国苯乙烯进口额及同比增长
图:2007-2017年中国苯乙烯出口量及同比增长
图:2007-2017年中国丁腈橡胶出口额及同比增长
图:2008-2018年中国苯乙烯表观消费量及自给率
图:2017年中国苯乙烯(分用途)需求量占比
图:2016-2018年中国江苏苯乙烯市场均价
图:2013-2023年中国橡胶助剂产量及同比增长
图:2017年中国橡胶助剂(分产品)产量
图:2017年中国橡胶助剂(分用途)需求量占比
图:2017-2018年中国促进剂市场价格走势
图:2018年中国轮胎成本构成
图:2013-2020年全球轮胎市场规模
图:2014-2020年全球Car Tire市场规模
图:2017年全球轮胎出货量地域分布
图:2008-2018年中国汽车轮胎产量
图:2015-2018年中国全钢胎月度开工率
图:2015-2018年中国半钢胎开工率
图:2015-2017年中国10大企业子午胎产量
图:2015-2017年中国前10大企业全钢胎产量
图:2008-2018年中石化营业收入及同比增长
图:2008-2017年中石化净利润及同比增长
图:2010-2018年中石化(分行业)营业收入
图:2008-2018年中石化(分行业)毛利率
图:2008-2018年中石化合成橡胶产量及同比增长
图:2008-2018年中石化合成橡胶销量及同比增长
图:2008-2018年中石化合成橡胶销售额及同比增长
图:2005-2017年扬子石化橡胶公司发展大事件
图:2008-2018年中石油营业收入及同比增长
图:2008-2018年中石油净利润及同比增长
图:2008-2018年中石油(分行业)营业收入
图:2008-2018年中石油(分地区)营业收入
图:2008-2018年中石油(分行业)毛利率
图:2008-2018年中国石油合成橡胶产量及同比增长
图:2009-2018年玉皇化工公司营业收入与净利润
图:2009-2018年玉皇化工公司(分行业)营业收入
图:2009-2018年玉皇化工公司(分部门)毛利率
图:2010-2018年玉皇化工合成橡胶销售收入及均价
图:2018年台橡集团子公司分布
图:2018年台橡股份大事件
图:2010-2018年台橡股份公司营业收入及净利润
图:2018年Q3台橡股份(分地区)营业收入构成
图:2010-2017年台橡公司合成橡胶产能利用率
图:2008-2017年台橡股份公司合成橡胶(分地区)销量
图:2008-2017年台橡股份合成橡胶(分地区)营业收入
图:2018年台橡股份在建项目
图:2018年台橡股份鞋材生产能力
图:2009-2016年蓝德精细化工营业收入与净利润
图:2012-2017年镇江南帝化工营业收入及同比增长
Properties and Applications of Synthetic Rubber (by Type)
Synthetic Rubber Industry Chain
Global Synthetic Rubber Capacity, 2011-2018
Global Synthetic Rubber Output and Consumption, 2008-2018
Global Synthetic Rubber Output and Consumption Structure, 2008-2017
Global Synthetic Rubber Capacity Structure (by Product), 2017
Global Synthetic Rubber Capacity (by Region), 2010-2016
Global Synthetic Rubber Output (by Region), 2014-2017
Global Synthetic Rubber Consumption (by Region), 2008-2017
Global Synthetic Rubber Output and Consumption, 2017-2023E
China’s Synthetic Rubber Capacity (by Enterprise), 2015-2018
Global Share of China’s Synthetic Rubber Capacity (by Product), 2017
China’s Synthetic Rubber Capacity and YoY Growth, 2012-2018
China’s Synthetic Rubber Output and YoY Growth, 2007-2018
China’s Synthetic Rubber Apparent Consumption and Self-sufficiency Rate, 2007-2018
Increase of Tarriff on Synthetic Rubber Products Imported from China Imposed by USA, 2018
China’s Synthetic Rubber Import Volume and YoY Growth, 2007-2018
China’s Synthetic Rubber Import Value and YoY Growth, 2007-2018
China’s Synthetic Rubber Export Volume and YoY Growth, 2007-2017
China’s Synthetic Rubber Export Value and YoY Growth, 2010-2017
China’s Synthetic Rubber Capacity (by Product), 2012-2018
China’s Synthetic Rubber Output (by Variety), 2017&2023E
Top 10 Synthetic Rubber Provinces in China (by Output), 2016-2017
Major Provinces/Cities of Synthetic Rubber Development in China, 2019
Capacity and Share of Top 20 Synthetic Rubber Enterprises in China, 2018
Balance between China’s Synthetic Rubber Production and Demand, 2015-2023E
China’s Synthetic Rubber Output (by Product), 2014-2023E
China BR Capacity (by Enterprise), 2012-2018
China’s BR Capacity and YoY Growth, 2008-2018
China’s BR Output and YoY Growth, 2008-2018
China’s BR Operating Rate, 2017-2018
China’s BR Import Volume and YoY Growth, 2008-2018
China’s BR Export Volume and YoY Growth, 2008-2018
China’s BR Apparent Consumption and Self-sufficiency Rate, 2008-2018
China’s BR Demand Structure (by Purpose), 2011-2018
Pattern of BR Enterprises in China (by Capacity), 2018
BR Projects under Planning in China, 2019
China’s BR Market Price Trend, 2018
China’s BR Market Price Trend, 2006-2018
Balance of Supply and Demand of BR in China, 2018-2023E
Capacity of SBR in China by Enterprise, 2012-2018
China’s SBR Capacity (by Product), 2008-2018
China’s SBR Output and YoY Growth, 2008-2018
China's ESBR Facility Operating Rate, 2017-2018
China’s SBR Import Volume and YoY Growth, 2008-2018
China’s SBR Export Volume and YoY Growth, 2008-2018
China’s SBR Apparent Consumption and Self-sufficiency Rate, 2008-2018
China’s SBR Demand Structure (by Purpose), 2018
Market Share of SBR Enterprises in China (by Capacity), 2018
Price Trend of SBR1502# in China, 2018
Price Trend of SBR1502# in China, 2014-2018
Balance of Supply and Demand of SBR in China, 2018-2023E
Global EPR Capacity Distribution by Region, 2017
China’s EPR Output and YoY Growth, 2008-2018
China EPR Operating Rate, 2018
China’s EPR Import Volume and YoY Growth, 2008-2018
China’s EPR Export Volume and YoY Growth, 2008-2018
China’s EPR Apparent Consumption and Self-sufficiency Rate, 2008-2018
China’s EPR Demand Structure (by Purpose), 2019
Distribution of EPR Capacity (by Enterprise), 2012-2018
EPR Projects under Planning in China, 2019-2023E
Market Average Price of EPDM 4045 in China, 2012-2018
Balance of Supply and Demand of EPR in China, 2018-2023E
China’s IIR Output and YoY Growth, 2008-2018
China’s IIR Import Volume and YoY Growth, 2008-2018
China’s IIR Export Volume and YoY Growth, 2008-2018
China’s IIR Apparent Consumption and Self-sufficiency Rate, 2008-2018
China’s IIR Demand Structure (by Purpose), 2018
IIR Capacity by Enterprise in China, 2012-2018
IIR Projects under Construction in China, 2018-2023E
Market Price Trend of Ordinary IIR and Halogenated IIR in China, 2018
Price Trend of Ordinary HIIR 1675N in China 2017-2018
China’s IIR Supply and Demand, 2018-2023E
Global NBR Capacity Structure by Enterprise, 2018
China’s NBR Capacity and Capacity Utilization, 2008-2018
China’s NBR Output and YoY Growth, 2008-2018
China’s NBR Import Volume and YoY Growth, 2008-2018
China’s NBR Export Volume and YoY Growth, 2008-2018
NBR Imports and Exports in China by Product, 2010-2017
China’s NBR Apparent Consumption and Self-sufficiency Rate, 2007-2018
China’s NBR Demand Structure (by Purpose), 2018
China’s NBR Capacity Structure (by Enterprise), 2018
China’s NBR Capacity (by Enterprise), 2010-2018
China’s NBR Price Trend, 2018
NBR Supply and Demand in China, 2018-2023E
China’s Butadiene Capacity and Capacity Utilization, 2010-2018
China’s Butadiene Output and YoY Growth, 2008-2018
China’s Butadiene Production Process Structure,
China’s Butadiene Import Volume and YoY Growth, 2008-2018
China’s Butadiene Export Volume and YoY Growth, 2007-2017
China’s Butadiene Apparent Consumption and Self-sufficiency Rate, 2008-2018
Downstream Consumption of Butadiene, 2011-2017
Price Trend of Butadiene in China, 2018
China’s Butadiene Capacity Structure (by Enterprise), 2010-2018
China’s Butadiene Capacity Distribution (by Enterprise), 2010-2018
Ongoing and Proposed Butadiene Projects in China, 2019-2023E
Butadiene Supply and Demand in China, 2018-2023E
China’s Styrene Capacity and Capacity Utilization, 2010-2018
China’s Styrene Output and YoY Growth, 2008-2018
China’s Styrene Capacity Distribution (by Region), 2018
Production Cost of Non-integrated Styrene in China, 2017-2018
China’s Styrene Import Volume and YoY Growth, 2008-2018
China’s Styrene Import Value and YoY Growth, 2008-2018
China’s Styrene Export Volume and YoY Growth, 2007-2017
China’s NBR Export Value and YoY Growth, 2007-2017
China’s Styrene Import Volume Structure by Country/Region, 2016-2018
China’s Styrene Apparent Consumption and Self-sufficiency Rate, 2008-2018
China’s Styrene Demand Structure (by Purpose), 2017
Styrene Market Average Price in East China, 2016-2018
Distribution of China’s Styrene Capacity (by Enterprise), 2010-2018
Styrene Projects Proposed to be Constructed in China, 2019-2023E
Balance between China’s Styrene Supply and Demand, 2018-2023E
China’s Rubber Additive Output and YoY Growth, 2013-2023E
China’s Rubber Additive Output (by Product), 2017
China’s Rubber Additive Demand Structure (by Purpose), 2017
Market Price Trend of Accelerator in China, 2017-2018
Top 9 Rubber Additive Enterprises in China (by Revenue), 2018
China’s Tire Cost Structure, 2018
Global Tire Market Size, 2013-2020E
Global Car Tire Market Size, 2014-2020E
Geographical Distribution of Global Tire Shipments, 2017
China’s Car Tire Output, 2008-2018
Monthly Operating Rate of Full-steel Tires in China, 2015-2018
Monthly Operating Rate of Semi-steel Tires in China, 2015-2018
Output of Top 10 Radial Tire Enterprises in China, 2015-2017
Output of Top 10 Full-steel Tire Enterprises in China, 2015-2017
Tire Price Increase of Major Tire Enterprises in China, 2019
Sinopec’s Revenue and YoY Growth, 2008-2018
Sinopec’s Net Income and YoY Growth, 2008-2017
Sinopec’s Revenue (by Sector), 2010-2018
Sinopec’s Gross Margin (by Sector), 2008-2018
Sinopec’s Synthetic Rubber Output and YoY Growth, 2008-2018
Sinopec’s Synthetic Rubber Sales Volume and YoY Growth, 2008-2018
Sinopec’s Synthetic Rubber Revenue and YoY Growth, 2008-2018
Milestones of YPC (Nanjing) Rubber, 2005-2017
Main SBR Products of YPC (Nanjing) Rubber
PetroChina’s Revenue and YoY Growth, 2008-2018
PetroChina’s Net Income and YoY Growth, 2008-2018
PetroChina’s Revenue (by Sector), 2008-2018
PetroChina’s Revenue (by Region), 2008-2018
PetroChina’s Gross Margin (by Sector), 2008-2018
PetroChina’s Synthetic Rubber Output and YoY Growth, 2008-2018
Distribution of Major Subsidiaries of Yuhuang Chemical, 2018
Revenue and Net Income of Yuhuang Chemical, 2009-2018
Revenue of Yuhuang Chemical (by Sector), 2009-2018
Gross Margin of Yuhuang Chemical (by Division), 2009-2018
Synthetic Rubber Capacity, Output and Sales Volume of Yuhuang Chemical, 2010-2017
Synthetic Rubber Revenue and Average Price of Yuhuang Chemical, 2010-2018
Distribution of TSRC’s Subsidiaries, 2018
Events of TSRC, 2018
Revenue and Net Income of TSRC, 2010-2018
TSRC’s Revenue Structure (by Product), 2014-2017
TSRC’s Revenue Structure (by Region), 2018 Q3
TSRC’s Capacity, Output and Output Value (by Product), 2013-2017
TSRC’s Synthetic Rubber Capacity Utilization, 2010-2017
TSRC’s Synthetic Rubber Sales Volume (by Region), 2008-2017
TSRC’s Synthetic Rubber Revenue (by Region), 2008-2017
TSRC’s Synthetic Rubber Capacity (by Enterprise / Product), 2018
Projects under Construction of TSRC, 2018
Footwear Materials Production Capability of TSRC, 2018
Revenue and Net Income of Lande Fine Chemical, 2009-2016
Revenue and Net Income of Zhenjiang Nantex Chemical Industry, 2012-2017
Neoprene Products of Shanna Synthetic Rubber
Synthetic Rubber Products of Hangzhou Zhechen Rubber
Project Investment and Capacity of Tianjin Lugang Petroleum Rubber
Neoprene Products of Chongqing Changshou Chemical
NBR Products of Ningbo Shunze Rubber (by Grade), 2018
如果这份报告不能满足您的要求,我们还可以为您定制报告,请 留言说明您的详细需求。
|