|
|
|
报告导航:研究报告—
生命科学—制药医疗
|
|
2019-2025年中国血液制品行业研究报告 |
 |
字数:4.9万 |
页数:145 |
图表数:166 |
|
中文电子版:8000元 |
中文纸版:6400元 |
中文(电子+纸)版:8500元 |
|
英文电子版:3200美元 |
英文纸版:3400美元 |
英文(电子+纸)版:3500美元 |
|
编号:ZLC-073
|
发布日期:2019-02 |
附件:下载 |
 |
|
|
随着国家医保目录调整,几乎所有的血液制品临床使用范围及报销比例都大幅度提升,血液制品市场空间进一步打开。2018年,中国主要血液制品批签发量逐年上升,合计达7394万瓶,同比增长13.5%。其中,人血白蛋白批签发量大幅增长至4517万瓶,同比增长达13.8%。
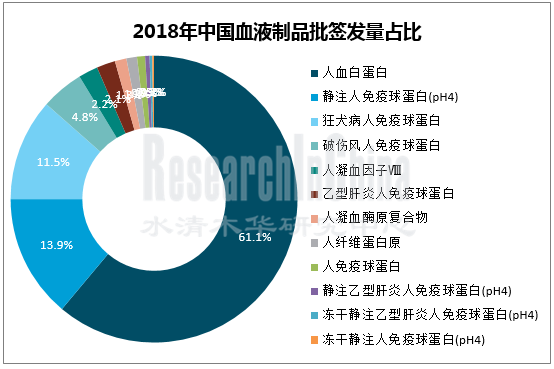
目前,中国血液制品仍以白蛋白为主,其中人血白蛋白的占比相对更高,按批签发量计算,人血白蛋白占据了约60%左右的份额。其次,静注人免疫球蛋白所占份额约15%左右,排名第二。此外,狂犬病人免疫球蛋白和破伤风人免疫球蛋白批签发量占比也基本在5%以上,排名三四。
而人纤维蛋白原、三种特免球蛋白、人凝血酶原复合物、人凝血因子Ⅷ的占比相对更低,尤其凝血因子类产品是血友病患者的救命药,常处于短缺状态。主要原因是目前中国血浆的利用率低,很多企业无法生产此类血液制品。因此,如何进一步提升采浆量,扩大各制品生产规模,提高资源利用率、缓解供需紧张仍是中国血液制品行业面临的最大问题。
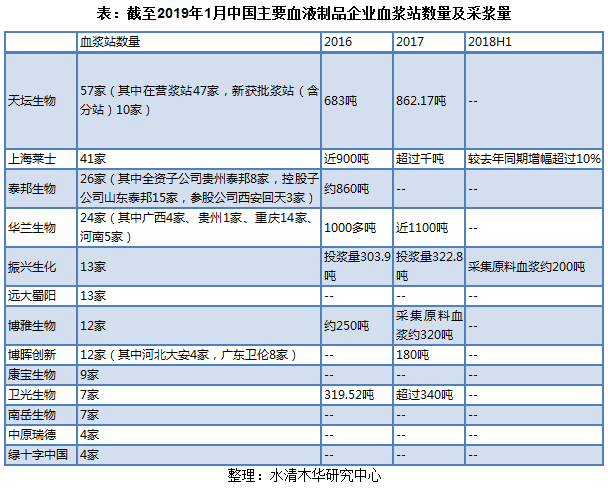
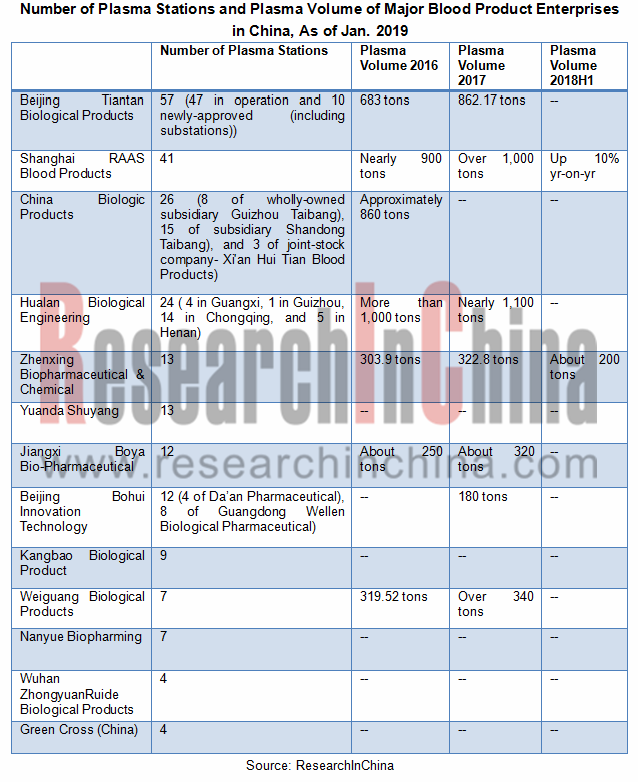
目前,中国共有30多家血液制品生产企业,行业集中度不高。其中,以泰邦生物、华兰生物、上海莱士、天坛生物等为代表的企业竞争实力相对更强。一方面,其血液制品产品线更为丰富,另一方面其血浆站相对更多,原料供应充足。
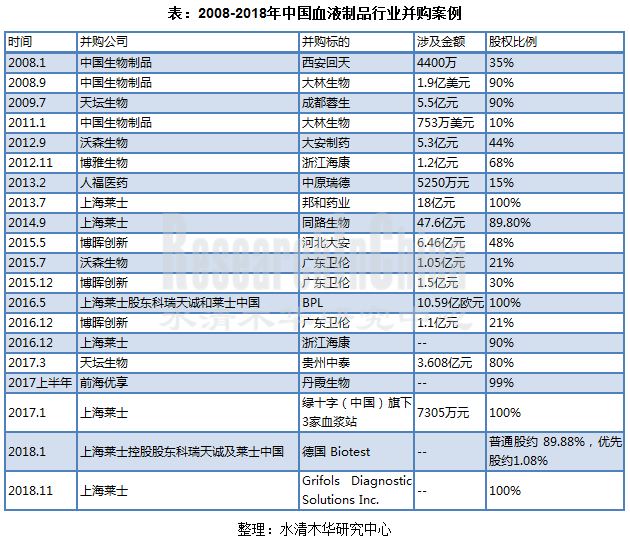
未来,中国血液制品行业整合加快,集中度进一步提升。
With the adjustment of the national medical insurance catalogue, the clinical application and reimbursement rate of almost all blood products have been greatly improved, and the market for blood products has been further opened. In 2018, the lot release volume of Chinese main blood products increased 13.5% year on year to 73.94 million bottles, of which the lot release volume of human albumin soared 13.8% year on year to 45.17 million bottles.
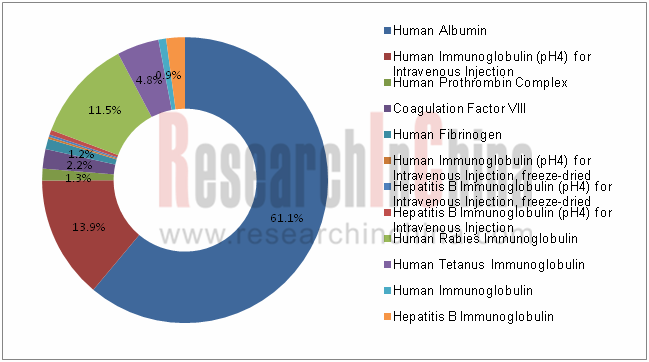
At present, Chinese blood products are still center on albumin, of which human albumin occupies a relatively high proportion. By the lot release volume, human albumin accounts for about 60%, followed by human immunoglobulin for intravenous injection with about 15%, human rabies immunoglobulin and tetanus immunoglobulin with more than 5% each.
The proportion of human fibrinogen, three special immunoglobulins, human prothrombin complex and coagulation factor VIII is relatively low, especially coagulation factor products, life-saving drugs for hemophilia patients, are often in shortage. The main reason is that the current utilization rate of plasma in China is low, and many companies are unable to produce such blood products. Therefore, China’s blood product industry still faces big problems: how to further raise the plasma collection volume, how to expand the production scale of various products, how to improve the resource utilization, and how to alleviate the tight supply.
Lot Release Volume Structure of Major Blood Products in China, 2018
There are over 30 blood product manufacturers in a less concentrated industry in China. Among them, China Biologic Products, Hualan Biological Engineering, Shanghai RAAS Blood Products and Beijing Tiantan Biological Products are more competitive, as they have richer blood product lines and adequate supply of raw materials from plasma stations.
In the future, China’s blood product industry will see faster industry integration and higher concentration.
The report highlights the following:
 Analysis on development of China blood product industry, including policies, status quo, market structure, supply & demand, market size and competitive landscape; Analysis on development of China blood product industry, including policies, status quo, market structure, supply & demand, market size and competitive landscape;
Analysis on market segments of China blood product industry, covering human albumin, human immunoglobulin (pH4) for intravenous injection, blood coagulation factor VIII, hepatitis B human immunoglobulin, human immunoglobulin, human prothrombin complex, Tetanus Immunoglobulin, and Human Rabies Immunoglobulin;
Analysis on 13 blood product enterprises, including operation, revenue structure, gross margin, R & D investment, blood product business and development strategy;
Summary & forecast and trends.
第一章 概述
1.1 血液制品定义
1.2 血液制品分类
1.3 重组血液制品
1.4 血液制品产业链
1.5 血液制品特点
第二章 中国血液制品行业发展分析
2.1 相关政策
2.2 发展现状
2.3 市场结构
2.4 供需分析
2.4.1 供应分析
2.4.2 需求分析
2.5 市场规模
2.6 竞争格局
第三章 中国血液制品行业细分市场分析
3.1 人血白蛋白
3.1.1 发展现状
3.1.2 中标价格
3.1.3 市场结构
3.1.4 竞争格局
3.1.5 发展前景
3.2 静注人免疫球蛋白(pH4)
3.2.1 发展现状
3.2.2 中标价格
3.2.3 竞争格局
3.2.4 发展前景
3.3 人凝血因子Ⅷ
3.3.1 发展现状
3.3.2 中标价格
3.3.3 竞争格局
3.3.4 发展前景
3.4 乙型肝炎人免疫球蛋白
3.4.1 发展现状
3.4.2 中标价格
3.4.3 竞争格局
3.5 人免疫球蛋白
3.5.1 发展现状
3.5.2 中标价格
3.5.3 竞争格局
3.6 人凝血酶原复合物
3.6.1 发展现状
3.6.2 中标价格
3.6.3 竞争格局
3.7 破伤风人免疫球蛋白
3.7.1 发展现状
3.7.2 中标价格
3.7.3 竞争格局
3.8 狂犬病人免疫球蛋白
3.8.1 发展现状
3.8.2 中标价格
3.8.3 竞争格局
第四章 主要企业
4.1 泰邦生物集团公司
4.1.1 公司简介
4.1.2 经营情况
4.1.3 营收结构
4.1.4 毛利率
4.1.5 研发投资
4.1.6 血液制品业务
4.1.7 贵州泰邦生物制品有限公司
4.1.8 山东泰邦生物制品有限公司
4.1.9 西安回天血液制品有限责任公司
4.2 华兰生物工程股份有限公司
4.2.1 公司简介
4.2.2 经营情况
4.2.3 营收构成
4.2.4 毛利率
4.2.5 研发投资
4.2.6 血液制品业务
4.2.7 发展战略
4.3 上海莱士
4.3.1 公司简介
4.3.2 经营情况
4.3.3 营收构成
4.3.4 毛利率
4.3.5 研发投资
4.3.6 血液制品业务
4.3.7 发展战略
4.4 天坛生物
4.4.1 公司简介
4.4.2 经营情况
4.4.3 营收构成
4.4.4 毛利率
4.4.5 研发投资
4.4.6 血液制品业务
4.4.7 成都蓉生
4.5 振兴生化
4.5.1 公司简介
4.5.2 经营情况
4.5.3 毛利率
4.5.4 研发与投资
4.5.5 血液制品业务
4.5.6 发展战略
4.6 博雅生物
4.6.1 公司简介
4.6.2 经营情况
4.6.3 营收构成
4.6.4 毛利率
4.6.5 研发与投资
4.6.6 血液制品业务
4.6.7 发展战略
4.7 卫光生物
4.7.1 公司简介
4.7.2 经营情况
4.7.3 营收构成
4.7.4 毛利率
4.7.5 研发与投资
4.7.6 血液制品业务
4.7.7 发展战略
4.8 博晖创新
4.8.1 公司简介
4.8.2 经营情况
4.8.3 营收构成
4.8.4 毛利率
4.8.5 研发投资
4.8.6 血液制品业务
4.8.7 发展战略
4.9 中原瑞德
4.9.1 公司简介
4.9.2 经营情况
4.9.3 血液制品业务
4.10 远大蜀阳
4.10.1 公司简介
4.10.2 血液制品业务
4.11 康宝生物
4.11.1 公司简介
4.11.2 血液制品业务
4.12 绿十字中国
4.12.1 公司简介
4.12.2 血液制品业务
4.13 南岳生物
4.13.1 公司简介
4.13.2 血液制品业务
第五章 总结与预测
5.1 总结
5.2 发展趋势预测
5.2.1 行业景气度持续高涨
5.2.2 行业整合加快,集中度进一步提升
5.2.3 采浆量和浆站数量决定行业地位
5.2.4 采浆量逐步提升
5.2.5 企业以加强研发投入开发新产品以提升竞争力
5.2.6 血浆综合利用率进一步提升
5.2.7 下游需求带动行业发展
5.2.8 医疗卫生体制改革不断深入、医疗保险制度不断健全利好行业发展
1. Overview of Blood Products
1.1 Definition
1.2 Classification
1.3 Recombinant Blood Products
1.4 Industry Chain
1.5 Features
2. Development of China Blood Product Industry
2.1 Related Policies
2.2 Status Quo
2.3 Market Structure
2.4 Market Supply and Demand
2.4.1 Supply
2.4.2 Demand
2.5 Market Size
2.6 Competition Pattern
3. Market Segments of China Blood Product Industry
3.1 Human Albumin
3.1.1 Development Status
3.1.2 Bid Price
3.1.3 Market Structure
3.1.4 Competition Pattern
3.1.5 Prospects
3.2 Human Immunoglobulin (pH4) for Intravenous Injection
3.2.1 Development Status
3.2.2 Bid Price
3.2.3 Competition Pattern
3.2.4 Prospects
3.3 Coagulation Factor VIII
3.3.1 Development Status
3.3.2 Bid Price
3.3.3 Competition Pattern
3.3.4 Prospects
3.4 Hepatitis B Immunoglobulin
3.4.1 Development Status
3.4.2 Bid Price
3.4.3 Competition Pattern
3.5 Human Immunoglobulin
3.5.1 Development Status
3.5.2 Bid Price
3.5.3 Competition Pattern
3.6 Human Prothrombin Complex
3.6.1 Development Status
3.6.2 Bid Price
3.6.3 Competition Pattern
3.7 Tetanus Immunoglobulin
3.7.1 Development Status
3.7.2 Bid Price
3.7.3 Competition Pattern
3.8 Human Rabies Immunoglobulin
3.8.1 Development Status
3.8.2 Bid Price
3.8.3 Competition Pattern
4. Major Enterprises
4.1 China Biologic Products (CBPO)
4.1.1 Profile
4.1.2 Operation
4.1.3 Revenue Strucuture
4.1.4 Gross Margin
4.1.5 R&D Investment
4.1.6 Blood Products Business
4.1.7 Guizhou Taibang Biological Products Co., Ltd.
4.1.8 Shandong Taibang Biological Products Co., Ltd.
4.1.9 Xi'an Huitian Blood Products Co., Ltd.
4.2 Hualan Biological Engineering Co., Ltd.
4.2.1 Profile
4.2.2 Operation
4.2.3 Revenue Strucuture
4.2.4 Gross Margin
4.2.5 R&D Investment
4.2.6 Blood Products Business
4.2.7 Development Strategy
4.3 Shanghai RAAS Blood Products
4.3.1 Profile
4.3.2 Operation
4.3.3 Revenue Strucuture
4.3.4 Gross Margin
4.3.5 R&D Investment
4.3.6 Blood Products Business
4.3.7 Development Strategy
4.4 Beijing Tiantan Biological Products
4.4.1 Profile
4.4.2 Operation
4.4.3 Revenue Strucuture
4.4.4 Gross Margin
4.4.5 R&D Investment
4.4.6 Blood Products Business
4.4.7 Chengdu Rongsheng
4.5 Zhenxing Biopharmaceutical & Chemical
4.5.1 Profile
4.5.2 Operation
4.5.3 Gross Margin
4.5.4 R&D Investment
4.5.5 Blood Products Business
4.5.6 Development Strategy
4.6 Jiangxi Boya Bio-Pharmaceutical
4.6.1 Profile
4.6.2 Operation
4.6.3 Revenue Structure
4.6.4 Gross Margin
4.6.5 R&D Investment
4.6.6 Blood Products Business
4.6.7 Development Strategy
4.7 Weiguang Biological Products
4.7.1 Profile
4.7.2 Operation
4.7.3 Revenue Strucuture
4.7.4 Gross Margin
4.7.5 R&D Investment
4.7.6 Blood Products Business
4.7.7 Development Strategy
4.8 Beijing Bohui Innovation Technology
4.8.1 Profile
4.8.2 Operation
4.8.3 Revenue Strucuture
4.8.4 Gross Margin
4.8.5 R&D Investment
4.8.6 Blood Products Business
4.8.7 Development Strategy
4.9 Wuhan ZhongyuanRuide Biological Products
4.9.1 Profile
4.9.2 Operation
4.9.3 Blood Products Business
4.8 Sichuan Yuanda Shuyang Pharmaceutical Co., Ltd.
4.8.1 Profile
4.10.2 Blood Products Business
4.11 Shanxi Kangbao Biological Product
4.11.1 Profile
4.11.2 Blood Products Business
4.12 Green Cross China
4.12.1 Profile
4.12.2 Blood Products Business
4.13 Nanyue Biopharming Corporation Ltd.
4.13.1 Profile
4.13.2 Blood Products Business
5. Summary and Forecast
5.1 Summary
5.2 Development Trend
5.2.1 The Industry Continues to Boom
5.2.2 Industry Integration Speeds Up, Concentration Rises Further
5.2.3 Plasma Collection Volume and Number of Plasma Stations Determine the Status in the Industry
5.2.4 Plasma Volume Increases Progressively
5.2.5 Enterprises Make More Input in R&D of New Products to Sharpen Competitiveness
5.2.6 Comprehensive Utilization of Blood Plasma Gets a Further Rise
5.2.7 Downstream Demand Stimulates the Development of the Industry
5.2.8 Healthcare System Reform Deepens, Gradual Perfection of Medical Insurance System Favors the Development of the Industry
图:血液的基本组成
图:血浆蛋白分离程序
表:血液制品的分类及作用
表:基因重组类血制品与传统血制品对比
表:国内外重组血液制品产品种类及对比
图:血液制品产业链
图:血浆采集与分离的生产工艺耗时
图:血液制品企业与化学制药企业运营成本及费用对比
图:血液制品生产销售周期
表:1986-2017年中国血液制品主要政策
表:中国血液制品行业发展历程
图:中美主要血液制品人均消费量对比
表:2014-2018年中国主要血液制品批签发量
表:2014-2018年中国血液制品产品结构(按批签发量计)
表:中国与美国、欧洲部分国家血浆采集政策对比
表:中国与欧美国家人均献浆频率及采浆量对比
图:2008-2018年中国单采血浆站数量及同比增加数量
表:2014-2018年中国主要血液制品企业浆站获批情况
图:2008-2018年中国采浆量及同比增长率
表:2017年VS2009年国家医保目录血液制品纳入情况对比
图:2015-2025年中国血浆供需对比
表:血液制品取消限价后价格与原最高零售价对比
图:2010-2018年中国血液制品行业市场规模
表:截至2019年1月中国主要血液制品企业血浆站数量及采浆量
表:中国主要血液制品生产企业主要产品
表:2013-2018年中国血液制品主要企业营业收入对比
表:2013-2018年中国血液制品主要企业净利润对比
表:2013-2018年中国血液制品主要企业血液制品业务收入对比
图:2017年中国血液制品行业市场份额(分企业)
图:2010-2018年中国人血白蛋白批签发量及同比增长率
表:2018Q4中国主要血液制品企业人血白蛋白中标均价对比
图:2007-2018年中国人血白蛋白批签发量国产与进口比例
图:2017年中国人血白蛋白批签发量及占比(分企业)
图:2018年中国人血白蛋白批签发量及占比(分企业)
图:2010-2018年中国静注人免疫球蛋白(pH4)批签发量及同比增长率
表:2018Q4中国主要血液制品企业静注人免疫球蛋白(pH4)中标均价对比
图:2017年中国静注人免疫球蛋白(ph4)批签发量及占比(分企业)
图:2018年中国静注人免疫球蛋白(ph4)批签发量及占比(分企业)
图:中美人血白蛋白和静注人免疫球蛋白(ph4)人均消费量对比
图:2010-2018年中国人凝血因子Ⅷ批签发量及同比增长率
表:2018Q4中国主要血液制品企业人凝血因子Ⅷ中标均价对比
图:2017年中国人凝血因子Ⅷ批签发量及占比(分企业)
图:2018年中国人凝血因子Ⅷ批签发量及占比(分企业)
图:中美人凝血因子Ⅷ人均消费量对比
表:中国主要血液制品企业人凝血因子Ⅷ研发进度
图:2010-2018年中国乙型肝炎人免疫球蛋白批签发量及同比增长率
表:2018Q4中国主要血液制品企业乙型肝炎人免疫球蛋白中标均价对比
图:2017年中国乙型肝炎人免疫球蛋白批签发量及占比(分企业)
图:2018年中国乙型肝炎人免疫球蛋白批签发量及占比(分企业)
图:2010-2018年中国人免疫球蛋白批签发量及同比增长率
表:2018Q4中国主要血液制品企业人免疫球蛋白中标均价对比
图:2017年中国人免疫球蛋白批签发量及占比(分企业)
图:2018年中国人免疫球蛋白批签发量及占比(分企业)
图:2010-2018年中国人凝血酶原复合物批签发量及同比增长率
表:2018Q4中国主要血液制品企业人凝血酶原复合物中标均价对比
图:2017年中国人凝血酶原复合物批签发量及占比(分企业)
图:2018年中国人凝血酶原复合物批签发量及占比(分企业)
图:2010-2018年中国破伤风人免疫球蛋白批签发量及同比增长率
表:2018Q4中国主要血液制品企业破伤风人免疫球蛋白中标均价对比
图:2017年中国破伤风人免疫球蛋白批签发量及占比(分企业)
图:2018年中国破伤风人免疫球蛋白批签发量及占比(分企业)
图:2013-2018年中国狂犬病发病人数、死亡人数及死亡率
图:2010-2018年中国狂犬病人免疫球蛋白批签发量及同比增长率
表:2018Q4中国主要血液制品企业狂犬病人免疫球蛋白中标均价对比
图:2017年中国狂犬病人免疫球蛋白批签发量及占比(分企业)
图:2018年中国狂犬病人免疫球蛋白批签发量及占比(分企业)
表:CBPO产品线
图:泰邦生物子公司股权结构
图:2012-2018年泰邦生物营业收入及营业利润
图:2012-2018年泰邦生物营业收入(分产品)
图:2012-2018年泰邦生物营业收入构成(分产品)
图:2012-2018年泰邦生物毛利率
图:2012-2018年泰邦生物研发投入及占总营收比重
图:截至2017年底CBPO在研产品及研发进度
表:2016-2018年泰邦生物血液制品批签发
表:截至2019年1月贵州泰邦主要单采血浆站
表:山东泰邦股权结构
表:截至2019年1月山东泰邦主要单采血浆站
表:西安回天股权结构
表:截至2018年1月西安回天主要单采血浆站
图:2017-2018年西安回天血液制品批签发
图:2013-2018年华兰生物营业收入及净利润
图:2013-2018年华兰生物营业收入(分产品)
图:2013-2018年华兰生物营业收入构成(分产品)
图:2013-2018年华兰生物毛利率(分产品)
图:2013-2018年华兰生物研发支出及占总营收比重
表:华兰生物血液制品各类及规格
图:2013-2018年华兰生物血液制品业务收入及占总营收比重
表:2015-2018年华兰生物血液制品批签发量
图:2013-2018年上海莱士营业收入及净利润
图:2013-2018年上海莱士营业收入(分产品)
图:2013-2018年上海莱士营业收入构成(分产品)
图:2013-2018年上海莱士营业收入(分地区)
图:2013-2018年上海莱士营业收入构成(分地区)
图:2013-2018年上海莱士毛利率(分产品)
图:2015-2018年上海莱士研发投入及占总营收重
表:上海莱士及下属子公司可生产的血液制品
图:2013-2018年天坛生物营业收入及净利润
图:2013-2017年天坛生物营业收入(分产品)
图:2013-2017年天坛生物营业收入构成(分产品)
图:2013-2017年天坛生物毛利率(分产品)
图:2013-2018年天坛生物研发支出及占总营收比重
表:2017年天坛生物主要药(产)品研发投入及占营业收入比重
表:截至2017年底天坛生物在研项目进展情况
表:天坛生物旗下经营血液制品的主要子公司及持股比例
表:2017年天坛生物血液制品生产量及销售量
表:2015-2018年天坛生物血液制品批签发量
图:2015-2018年成都蓉生营业收入及净利润
图:2013-2018年振兴生化营业收入及净利润
图:2013-2018年振兴生化毛利率
图:2013-2018年振兴生化研发支出及占总营收比重
图:2014-2018年广东双林营业收入及净利润
图:2013-2018年广东双林投浆量
图:2013-2017年振兴生化血液制品产销量及库存量
表:2015-2018年广东双林血液制品批签发量
图:2013-2018年博雅生物营业收入及净利润
图:2013-2017年博雅生物营业收入(分业务)
图:2013-2017年博雅生物营业收入构成(分业务)
图:2015-2018年博雅生物主要血液制品营业收入
图:2015-2018年博雅生物主要血液制品营业收入占比
图:2013-2017年博雅生物毛利率(分产品)
图:2013-2018年博雅生物主要血液制品毛利率
图:2013-2018年博雅生物研发支出及占总营收比重
图:2016-2017年博雅生物血液制品产销量
表:2015-2018年博雅生物血液制品批签发量
图:2014-2018年卫光生物营业收入及净利润
表:2014-2018年卫光生物主营业务收入(分产品)
表:2014-2018年卫光生物主营业务收入构成(分产品)
图:2014-2018年卫光生物毛利率
图:2014-2018年卫光生物主要血液制品毛利率
图:2014-2018年卫光生物研发投入及占总营收比重
表:截至2018上半年卫光生物募投项目进度
图:2014-2017年卫光生物采浆量
图:2016-2017年卫光生物血液制品产销量
表:2017年卫光生物主要单采血浆子公司经营业绩
表:2018上半年卫光生物主要单采血浆子公司经营业绩
表:2016-2018年卫光生物血液制品批签发量
图:2014-2018年博晖创新营业收入及净利润
表:2014-2018年博晖创新营业收入(分产品)
表:2014-2018年博晖创新营业收入构成(分产品)
图:2014-2018年博晖创新主要产品毛利率
图:2014-2018年博晖创新研发投入及占总营收比重
表:2018上半年博晖创新主要开展的项目及注册进展情况
表:2017-2018年博晖创新经营数据
表:2016-2018年河北大安血液制品批签发量
表:2016-2018年广东卫伦血液制品批签发量
图:中原瑞德发展历程
表:2014-2017年中原瑞德财务数据
表:2016-2018年中原瑞德血液制品批签发量
图:远大蜀阳发展历程
表:远大蜀阳血液制品及规格
表:2016-2018年远大蜀阳血液制品批签发量
表:截至2018年1月康宝生物主要单采血浆站
表:2016-2018年康宝生物血液制品批签发量
表:2016-2018年绿十字中国血液制品批签发量
表:2016-2018年南岳生物血液制品批签发量
图:2018-2025E中国血液制品行业市场规模
表:国外血液制品巨头并购案例
表:2008-2018年中国血液制品行业并购案例
图:2018-2025年中国采浆量及同比增长率
图:2013-2018年中国血液制品主要企业研发投入
Basic Components of Blood
Plasma Protein Separation Procedure
Classification and Effects of Blood Products
Comparison between Gene Recombinant Blood Products and Traditional Blood Products
Comparison of Recombinant Blood Products in China and Overseas
Blood Product Industry Chain
Time Length of Plasma Collection and Separation Process
Comparison between Blood Product Enterprises and Chemical & Pharmaceutical Enterprises in Operating Costs & Expenses
Production & Sales Cycle of Blood Products
Main Policies on China Blood Product Industry, 1989-2017
Development History of China Blood Product Industry
Comparison between China and the United States in Per Capita Consumption of Main Blood Products
Lot Release Volume of Major Blood Products in China, 2014-2018
Blood Product Structure in China (by Lot Release Volume), 2014-2018
Plasma Collection Policies in China vs. USA and European Countries
Per Capita Frequency of Plasma Donation and Plasma Collection Volume in China vs. Euro-America
Number of Plasma Collection Stations and YoY Growth Rate in China, 2008-2018
Plasma Station Approval of Major Blood Product Enterprises in China, 2014-2018
Plasma Collection Volume and YoY Growth Rate in China, 2008-2018
Comparison of Blood Products Listed in National Medical Insurance Catalogue: 2017vs2009
Plasma Supply and Demand in China, 2015-2025E
Comparison of Cap-lift Prices and Original Highest Retail Prices of Blood Products
Market Size of China Blood Product Industry, 2010-2018
Number of Plasma Stations and Plasma Volume of Major Blood Product Enterprises in China, As of Jan. 2019
Main Products of Major Blood Product Manufacturing Enterprises in China
Revenue of Major Blood Product Enterprises in China, 2013-2018
Net Income of Major Blood Product Enterprises in China, 2013-2018
Revenue from Blood Products Business of Major Blood Product Enterprises in China, 2013-2018
Market Share of China Blood Product Industry (by Enterprise), 2017
Market Share of China Blood Product Industry (by Enterprise), 2018
Lot Release Volume and YoY Growth Rate of Human Albumin in China, 2010-2018
Average Successful Bid Prices Offered by Major Blood Product Enterprises in China for Human Albumin, 2018Q4
Proportion of Domestic and Imported Human Albumin in China (by Lot Release Volume), 2007-2018
Market Share of Human Albumin in China (by Lot Release Volume), 2017
Market Share of Human Albumin in China (by Lot Release Volume), 2018
Lot Release Volume of Human Immunoglobulin for Intravenous Injection in China, 2010-2018
Average Successful Bid Prices Offered by Major Blood Product Enterprises in China for Human Immunoglobulin (pH4) for Intravenous Injection, 2018Q4
Market Share of Human Immunoglobulin (pH4) for Intravenous Injection in China (by Lot Release Volume), 2017
Market Share of Human Immunoglobulin (pH4) for Intravenous Injection in China (by Lot Release Volume), 2018
Comparison between China and the United States in Per Capita Consumption of Human Albumin and Human Immunoglobulin (pH4) for Intravenous Injection
Lot Release Volume of Blood Coagulation Factor VIII in China, 2010-2018
Average Successful Bid Prices Offered by Major Blood Product Enterprises in China for Coagulation Factor VIII, 2018Q4
Market Share of Blood Coagulation Factor VIII in China (by Lot Release Volume), 2017
Market Share of Blood Coagulation Factor VIII in China (by Lot Release Volume), 2018
Comparison between China and the United States in Per Capita Consumption of Coagulation Factor VIII
Coagulation Factor VIII R&D Progress of Major Blood Product Enterprises in China
Lot Release Volume of Hepatitis B Immunoglobulin in China, 2010-2018
Average Successful Bid Prices Offered by Major Blood Product Enterprises in China for Hepatitis B Immunoglobulin, 2018Q4
Market Share of Hepatitis B Immunoglobulin in China (by Lot Release Volume), 2017
Market Share of Hepatitis B Immunoglobulin in China (by Lot Release Volume), 2018
Lot Release Volume of Human Immunoglobulin in China, 2010-2018
Average Successful Bid Prices Offered by Major Blood Product Enterprises in China for Human Immunoglobulin, 2018Q4
Market Share of Human Immunoglobulin in China (by Lot Release Volume), 2017
Market Share of Human Immunoglobulin in China (by Lot Release Volume), 2018
Lot Release Volume of Human Prothrombin Complex in China, 2010-2018
Average Successful Bid Prices Offered by Major Blood Product Enterprises in China for Human Prothrombin Complex, 2018Q4
Market Share of Human Prothrombin Complex in China (by Lot Release Volume), 2017
Market Share of Human Prothrombin Complex in China (by Lot Release Volume), 2018
Lot Release Volume of Tetanus Immunoglobulin in China, 2010-2018
Average Successful Bid Prices Offered by Major Blood Product Enterprises in China for Tetanus Immunoglobulin, 2018Q4
Market Share of Tetanus Immunoglobulin in China (by Lot Release Volume), 2017
Market Share of Tetanus Immunoglobulin in China (by Lot Release Volume), 2018
Cases, Deaths and Mortality of Rabies in China, 2013-2018
Lot Release Volume of Human Rabies Immunoglobulin in China, 2010-2018
Average Successful Bid Prices Offered by Major Blood Product Enterprises in China for Human Rabies Immunoglobulin, 2018Q4
Market Share of Human Rabies Immunoglobulin in China (by Lot Release Volume), 2017
Market Share of Human Rabies Immunoglobulin in China (by Lot Release Volume), 2018
Product Line of CBPO
Equity Structure of China Biologic Products Holdings
Revenue and Operating Income of CBPO, 2012-2018
Revenue Breakdown of CBPO (by Product), 2012-2018
Revenue Structure of CBPO (by Product), 2012-2018
Gross Margin of CBPO, 2012-2018
R&D Costs and % of Total Revenue of CBPO, 2012-2018
CBPO’s Products under Research and R&D Process by the end of 2017
Lot Release Volume of Blood Products of CBPO, 2016-2018
Main Plasma Collection Stations of Guizhou Taibang Biological Products as of Jan. 2019
Lot Release Volume of Blood Products of Guizhou Taibang Biological Products, 2016-2018
Ownership Structure of Shandong Taibang Biological Products
Main Plasma Collection Stations of Shandong Taibang Biological Products as of Jan. 2019
Lot Release Volume of Blood Products of Shandong Taibang Biological Products, 2016-2018
Ownership Structure of Xi'an Huitian Blood Products
Main Plasma Collection Stations of Xi'an Huitian Blood Products as of 2019
Lot Release Volume of Blood Products of Xi'an Huitian Blood Products, 2017-2018
Revenue and Net Income of Hualan Biological Engineering, 2013-2018
Revenue Breakdown of Hualan Biological Engineering (by Product), 2013-2018
Revenue Structure of Hualan Biological Engineering (by Product), 2013-2018
Gross Margin of Blood Products of Hualan Biological Engineering (by Product), 2013-2018
R&D Costs and % of Total Revenue of Hualan Biological Engineering, 2013-2018
Category and Specification of Blood Products of Hualan Biological Engineering
Revenue of Blood Products of Hualan Biological Engineering, 2013-2018
Lot Release Volume of Blood Products of Hualan Biological Engineering, 2015-2018
Revenue and Net Income of Shanghai RAAS Blood Products, 2013-2018
Revenue Breakdown of Shanghai RAAS Blood Products (by Product), 2013-2018
Revenue Structure of Shanghai RAAS Blood Products (by Product), 2013-2018
Revenue Breakdown of Shanghai RAAS Blood Products (by Region), 2013-2018
Revenue Structure of Shanghai RAAS Blood Products (by Region), 2013-2018
Gross Margin of Shanghai RAAS Blood Products (by Product), 2013-2018
R&D Costs of Shanghai RAAS Blood Products, 2015-2018
Blood Products of Shanghai RAAS Blood Products and Its Subsidiaries
Revenue and Net Income of Tiantan Biological Products, 2013-2018
Revenue Breakdown of TIANTANBIO (by Product), 2013-2017
Revenue Structure of TIANTANBIO (by Product), 2013-2017
Gross Margin of TIANTANBIO (by Product), 2013-2017
R&D Costs and % of Total Revenue of TIANTANBIO, 2013-2018
R&D Input of Major Projects of TIANTANBIO, 2017
Progress of Major R&D Projects of TIANTANBIO, by the End of 2017
TIANTANBIO’s Major Blood Products Subsidiaries and Stake
Production and Sales of Main Blood Products of TIANTANBIO, 2017
Lot Release Volume of Main Blood Products of TIANTANBIO, 2015-2018
Revenue and Net Income of Chengdu Rongsheng Pharmaceutical, 2015-2018
Revenue and Net Income of Zhenxing Biopharmaceutical & Chemical, 2013-2018
Gross Margin of Zhenxing Biopharmaceutical & Chemical, 2013-2018
R&D Costs and % of Total Revenue of Zhenxing Biopharmaceutical & Chemical, 2013-2018
Revenue and Net Income of Shuanglin Bio-Pharmacy, 2014-2018
Production-use Plasma Volume of Guangdong Shuanglin Bio-Pharmacy, 2013-2018
Production, Inventory and Sales of Main Blood Products of Zhenxing Biopharmaceutical & Chemical, 2013-2017
Lot Release Volume of Blood Products of Guangdong Shuanglin Bio-Pharmacy, 2015-2018
Revenue and Net Income of Jiangxi Boya Bio-Pharmaceutical, 2013-2018
Revenue Breakdown of Jiangxi Boya Bio-Pharmaceutical (by Business), 2013-2017
Revenue Structure of Jiangxi Boya Bio-Pharmaceutical (by Business), 2013-2017
Revenue from Major Blood Products of Jiangxi Boya Bio-Pharmaceutical, 2015-2018
Revenue Proportion of Major Blood Products of Jiangxi Boya Bio-Pharmaceutical, 2015-2018
Gross Margin of Jiangxi Boya Bio-Pharmaceutical (by Product), 2013-2017
Gross Margin of Main Blood Products of Jiangxi Boya Bio-Pharmaceutical, 2013-2018
R&D Costs of Jiangxi Boya Bio-Pharmaceutical, 2013-2018
Production and Sales of Blood Products of Jiangxi Boya Bio-Pharmaceutical, 2016-2017
Lot Release Volume of Blood Products of Jiangxi Boya Bio-Pharmaceutical, 2015-2018
Revenue and Net Income of Shenzhen Weiguang Biological Products, 2014-2018
Revenue Breakdown of Shenzhen Weiguang Biological Products (by Product), 2014-2018
Revenue Structure of Shenzhen Weiguang Biological Products (by Product), 2014-2018
Gross Margin of Shenzhen Weiguang Biological Products, 2014-2018
Gross Margin of Shenzhen Weiguang Biological Products (by Product), 2014-2018
R&D Costs and % of Total Revenue of Shenzhen Weiguang Biological Products, 2014-2018
Progress of Fundraising Projects of Shenzhen Weiguang Biological Products, as of 2018H1
Plasma Collection Volume of Shenzhen Weiguang Biological Products, 2014-2017
Production and Sales of Blood Products of Shenzhen Weiguang Biological Products, 2016-2017
Financial Data of Plasma Collection Stations of Shenzhen Weiguang Biological Products, 2017
Financial Data of Plasma Collection Stations of Shenzhen Weiguang Biological Products, 2018H1
Lot Release Volume of Blood Products of Shenzhen Weiguang Biological Products, 2016-2018
Revenue and Net Income of Beijing Bohui Innovation Technology, 2014-2018
Revenue Breakdown of Beijing Bohui Innovation Technology by Product, 2014-2018
Revenue Structure of Beijing Bohui Innovation Technology by Product, 2014-2018
Gross Margin of Beijing Bohui Innovation Technology by Product, 2014-2018
R&D Costs and % of Total Revenue of Beijing Bohui Innovation Technology, 2014-2018
Progress of Major Blood Product R&D Projects of Beijing Bohui Innovation Technology, 2018H1
Financials of Beijing Bohui Innovation Technology, 2017-2018
Lot Release Volume of Blood Products of Hebei Da’an Pharmaceutical, 2016-2018
Lot Release Volume of Blood Products of Guangdong Weilun Biological Pharmaceutical, 2016-2018
Development Course of Zhongyuan Ruide Biological Products
Financial Data of Zhongyuan Ruide, 2014-2017
Lot Release Volume of Blood Products of Zhongyuan Ruide Biological Products, 2016-2018
Development History of Sichuan Yuanda Shuyang Pharmaceutical
Specification of Blood Products of Sichuan Yuanda Shuyang Pharmaceutical
Lot Release Volume of Blood Products of Sichuan Yuanda Shuyang Pharmaceutical, 2016-2018
Plasma Collection Stations of Shanxi Kangbao Biological Product as of Jan. 2019
Lot Release Volume of Blood Products of Shanxi Kangbao Biological Product, 2016-2018
Plasma Collection Stations of Green Cross China as of Jan. 2019
Lot Release Volume of Blood Products of Green Cross China, 2016-2018
Lot Release Volume of Blood Products of Nanyue Biopharming, 2016-2018
Market Size of Blood Products in China, 2018-2025E
M&A Cases of Foreign Blood Product Companies
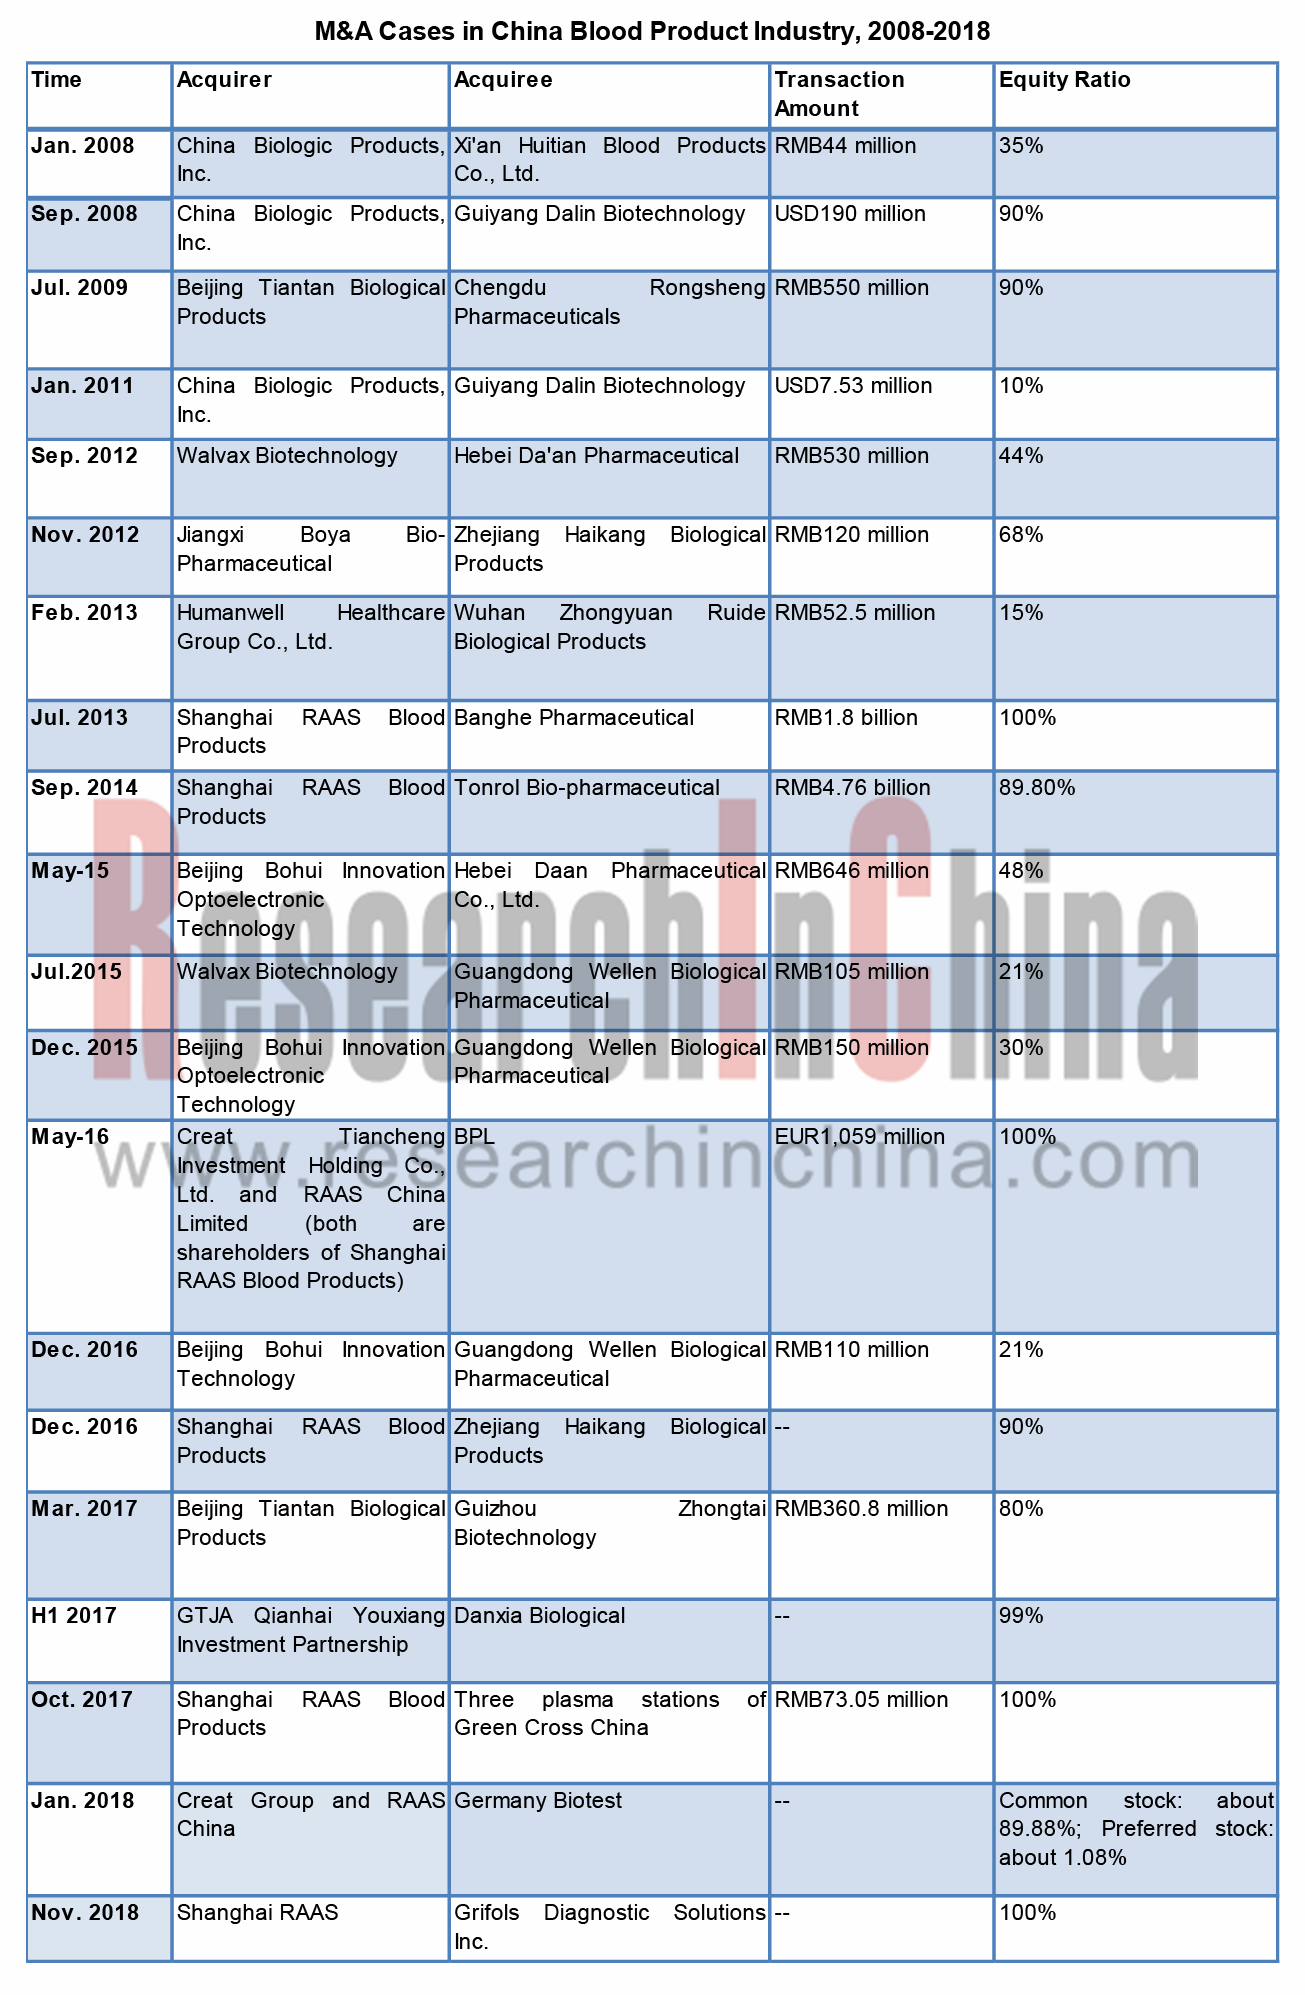
M&A Cases in China Blood Product Industry, 2008-2018
Plasma Collection Volume and YoY Change in China, 2018-2025E
R&D Investment of Major Chinese Blood Product Enterprises, 2013-2018
如果这份报告不能满足您的要求,我们还可以为您定制报告,请 留言说明您的详细需求。
|