|
|
|
报告导航:研究报告—
制造业—材料
|
|
2018-2023年全球及中国稀土永磁材料行业研究报告 |
 |
字数:5.4万 |
页数:165 |
图表数:210 |
|
中文电子版:10000元 |
中文纸版:8000元 |
中文(电子+纸)版:10500元 |
|
英文电子版:3400美元 |
英文纸版:3600美元 |
英文(电子+纸)版:3700美元 |
|
编号:BXM122
|
发布日期:2019-03 |
附件:下载 |
 |
|
|
稀土永磁材料包括钐钴(SmCo)永磁体和钕铁硼(NdFeB)永磁体,其中钕铁硼是第三代稀土永磁材料,具有较高的磁能积,占据绝大多数市场份额。钕铁硼又分为粘结钕铁硼、烧结钕铁硼和热压钕铁硼三种,其中烧结钕铁硼占主导地位;热压钕铁硼产量较少,尚未形成产业。
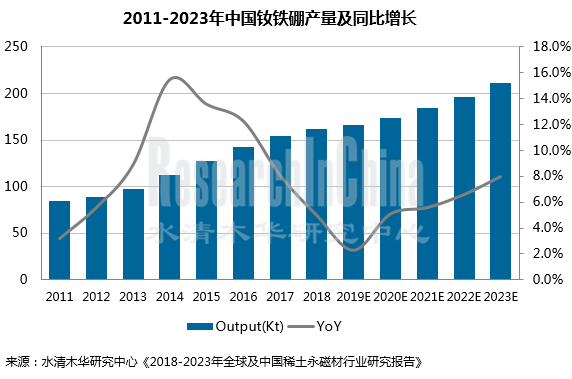
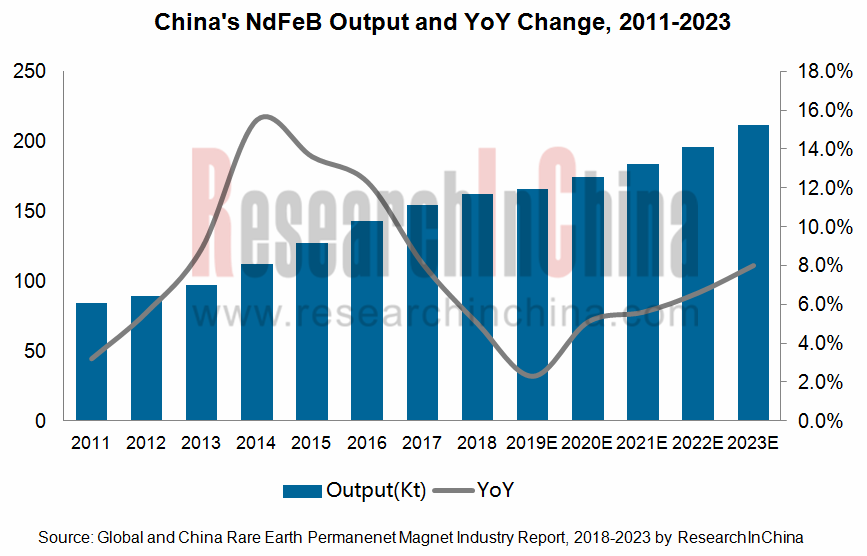
根据最新数据,2018年中国稀土永磁材料产量达到16.45万吨,同比增长4.6%;其中钕铁硼(NdFeB)永磁体16.20万吨,同比增长5.0%,钐钴(SmCo)永磁体0.25万吨,与上年基本持平。2019年稀土永磁市场整体形势不容乐观,预计全年增速下滑至2%左右。
与国际市场相比,中国已经成为全球稀土永磁最大生产国,2018年钕铁硼产量占到全球的90.5%。与此同时,中国也是全球最大的稀土永磁出口国,2018年稀土永磁产品出口约3.9万吨,出口额约18.7亿美元,出口量和出口额均高于上年同期。稀土的永磁铁及磁化后准备制永磁铁的物品(HS:85051110)是出口主力,且享受16%的出口退税(2018年11月最新政策),2018年出口量为3.27万吨,出口额为16.9亿美元。
稀土永磁上游为稀土产业,近年中国将稀土作为战略资源,对开采、冶炼实施总量控制。2018年中国首次增加开采和冶炼指标(自2014年以来),稀土开采指标由10.5万吨增加到12万吨、冶炼分离指标由10万吨增加到11.5万吨。同时,2018年6月颁布的《外商投资准入特别管理措施(负面清单)(2018年)》 中首次取消稀土冶炼、分离限于合资、合作的限制。
稀土永磁下游应用广泛,最大的市场为工业类电机,此外新能源汽车、风电、工业机器人等也成为拉动需求增长的动力。2018年,新能源汽车、节能家电、电动工具、工业机器人等行业为稀土永磁材料行业发展提供了重要支撑,行业发展质量不断提升,产品产量平稳增长,重点企业效益保持良好态势,晶界扩散等先进技术进一步推广,拓展了高铁用牵引电机等新应用领域。
企业方面,目前本土企业占据主导地位,代表企业有中科三环、天和磁材、宁波韵升、金力永磁、烟台首钢、英洛华、正海磁材等,且产品以中高档为主。2018年,中科三环、天和磁材、宁波韵升的产能已经超过1万吨。此外,TDK、日立金属、德国的信越化工、VAC等国际龙头已经进入中国,并不断扩大规模,提高市场份额。2018年中国钕铁硼价格先增后降,受价格波动影响,多数生产企业出现净利润下滑的局面。
水清木华研究中心《2018-2023年全球及中国稀土永磁材料行业研究报告》着重研究了以下内容:
 全球稀土永磁材料生产、消费情况,企业竞争格局及专利现状; 全球稀土永磁材料生产、消费情况,企业竞争格局及专利现状;
中国稀土永磁生产、消费、进出口情况,以及企业、区域、产品竞争格局,价格走势、技术现状等;
上游稀土储量、市场供需、价格走势以及下游(汽车/新能源汽车、风电设备、变频空调、节能电梯、机器人、消费电子等)市场现状及对稀土永磁材料的需求;
全球5家、中国23家生产商经营情况、稀土永磁材料业务、发展战略、未来预测等。
Rare earth permanent magnets consist of SmCo permanent magnet and NdFeB permanent magnet among which NdFeB as a kind of 3rd-Gen rare earth permanent magnetic material takes a lion’s share of the market due to its excellent magnetic energy product. NdFeB falls into bonded NdFeB, sintered NdFeB and hot-pressed NdFeB, where sintered NdFeB plays a key role while hot-pressed NdFeB is rarely produced and its industry has not taken shape yet.
As is shown from the latest data, China produced 164.5 kt of rare earth permanent magnets in 2018, edging up 4.6% on an annualized basis. Elaborately, the output of NdFeB permanent magnets posted 162 kt with a year-on-year increase of 5.0%; and that of SmCo permanent magnets stood at 2.5 kt and remained a par with the figure in 2017. It is expected that the rare earth permanent magnet market is beyond optimism and keep a growth rate of down to 2% or so in 2019.
China is the world’s largest both producer and exporter of rare earth permanent magnets. In 2018, it occupied 90.5% of the global total output and exported roughly 39kt worth $1.87 billion, higher volume and value than those in the previous year. The permanent magnets of rare earth metals and permanent magnets of other metals and articles intended to become permanent magnets after magnetization (HS: 85051110) account for the bulk of the exports and enjoy an export tax rebate rate of 16% (according to the latest policy released in November 2018), with 32.7kt in volume or $1.69 billion in value exported in 2018.
In recent years, China has taken rare earth, the upstream of rare earth permanent magnet materials industry, as a resource of strategic importance and restricted the total mining and smelting volume. In 2018 the country revised up the indexes for the first time since 2014, increasing the mining volume from 105kt to 120kt and smelting and separation volume from 100kt to 115kt. The Special Administrative Measures for the Access of Foreign Investment (Negative List) (2018) issued in June 2018 first indicates that the limit to co-funded or cooperative smelting and separation of rare earth will be lifted.
Rare earth permanent magnets find wide application in downstream sectors, and it not only gets mostly utilized in industrial motors but is increasingly used in new energy vehicle, wind power, industrial robot, among others. In 2018, new energy vehicle, energy-efficient household appliances, electric tools, industrial robots and so forth give impetus to the industrial development of rare earth permanent magnets whose quality gets incessantly improved and output sees steady growth. The key players maintain a sound development momentum and such advanced technologies as grain-boundary diffusion are promoted further. There emerge new applied fields like the traction motor for high-speed railway.
Nowadays, local Chinese enterprises lead the competition, such as Beijing Zhong Ke San Huan Hi-Tech, Tianhe Magnets, Ningbo Yunsheng, JL MAG Rare-Earth, Yantai Shougang Magnetic Material Inc., Zhejiang Innuovo Magnetics, and Yantai Zhenghai Magnetic Materials, and they provides products of medium and high quality. In 2018, the production capacity of Zhong Ke San Huan Hi-Tech, Tianhe Magnets, Tianhe Magnets, and Ningbo Yunsheng was in excess of 10,000 tons apiece. Additionally, the foreign giants like TDK, Hitachi Metals, VAC, and Shin-Etsu Chemical have forayed into China and have been striving for larger market share there. In 2018, the NdFeB price dropped from an early high, causing a fall in manufacturers’ net income.
The report highlights the following:
 Global production and consumption of rare earth permanent magnets, competition between the players, the status quo of patents; Global production and consumption of rare earth permanent magnets, competition between the players, the status quo of patents;
China’s production, consumption and import & export of rare earth permanent magnets, competition between enterprises, competition by region and product, price trend, status quo of technologies, etc.;
Upstream rare earth reserves, market demand and supply, price tendency as well as the status quo of downstream markets (automobile/NEV, wind power equipment, inverter air-conditioner, energy-saving elevator, robotics, consumer electronics, etc.) and their demand for rare earth permanent magnets;
Five foreign and twenty-three Chinese manufacturers (operation, rare earth permanent magnet business, development strategy, future forecasts, etc.)
第一章 稀土永磁材料简介
1.1 定义及分类
1.2 产业链
1.3 发展历程
第二章 全球稀土永磁材料产业现状
2.1 生产情况
2.1.1 产量
2.1.2 生产结构
2.2 消费情况
2.3 竞争格局
2.4 专利现状
第三章 中国稀土永磁材料发展现状
3.1 产业政策
3.2 市场供需
3.2.1 供给
3.2.2 需求
3.2.3进出口
3.3 竞争格局
3.3.1 企业格局
3.3.2 区域格局
3.3.3 产品结构
3.4 价格走势
3.5 技术现状
3.5.1 技术成果
3.5.2 存在的问题
第四章 中国稀土永磁材料上下游产业
4.1 稀土市场
4.1.1 资源及分布
4.1.2 市场供需
4.1.3 六大集团
4.1.4 价格走势
4.2 应用市场
4.2.1 汽车/新能源汽车
4.2.2 风电设备
4.2.3 变频空调
4.2.4 节能电梯
4.2.5工业机器人
4.2.6 消费电子
第五章 全球主要稀土永磁材料生产商
5.1 日立金属株式会社
5.1.1 公司简介
5.1.2 经营情况
5.1.3 营收结构
5.1.4 稀土永磁业务
5.1.5 在华布局
5.2 信越化学工业株式会社
5.2.1 公司简介
5.2.2 经营情况
5.2.3 营收结构
5.2.4稀土永磁材料业务
5.2.5 在华布局
5.3 Tokyo Denki Kagaku Kogyo K.K.(东电化)
5.3.1 Profile
5.3.2 经营情况
5.3.3 营收结构
5.3.4稀土永磁材料业务
5.3.5 在华布局
5.4 Vacuumschmelze(VAC公司)
5.4.1 Profile
5.4.2 稀土永磁材料业务
5.5 Magnequench(麦格昆磁国际公司)
5.5.1 Profile
5.5.2 稀土永磁业务
5.5.3 专利情况
第六章 中国主要稀土永磁材料生产商
6.1 北京中科三环高技术股份有限公司
6.1.1 公司简介
6.1.2 经营情况
6.1.3 营收结构
6.1.4 稀土永磁业务
6.1.5 研发情况
6.1.6 对外投资
6.1.7 业绩预测
6.2 烟台正海磁性材料股份有限公司
6.2.1 公司简介
6.2.2 经营情况
6.2.3 营收结构
6.2.4 稀土永磁业务
6.2.5 研发情况
6.3 宁波韵升股份有限公司
6.3.1 公司简介
6.3.2 经营情况
6.3.3 营收结构
6.3.4 稀土永磁业务
6.3.5 研发情况
6.3.6 发展战略
6.4 安泰科技股份有限公司
6.4.1 公司简介
6.4.2 经营情况
6.4.3 营收结构
6.4.4 稀土永磁业务
6.4.5 研发情况
6.4.6 发展战略
6.5英洛华科技股份有限公司
6.5.1 企业简介
6.5.2 经营情况
6.5.3 营收结构
6.5.4 稀土永磁业务
6.5.5 研发情况
6.6安徽大地熊新材料股份有限公司
6.6.1 企业简介
6.6.2 经营情况
6.6.3 主要客户
6.6.4 主要子公司
6.6.5 稀土永磁业务
6.7中国北方稀土(集团)高科技股份有限公司
6.7.1 公司简介
6.7.2 经营情况
6.7.3 营收结构
6.7.4 稀土永磁业务
6.7.5 发展战略
6.8 厦门钨业股份有限公司
6.8.1 公司简介
6.8.2 经营情况
6.8.3 营收结构
6.8.4 稀土永磁业务
6.9 成都银河磁体股份有限公司
6.9.1 公司简介
6.9.2 经营情况
6.9.3 营收结构
6.9.4 稀土永磁业务
6.9.5 主要项目
6.10 广晟有色金属股份有限公司
6.10.1 公司简介
6.10.2经营情况
6.10.3 营收结构
6.10.4 稀土永磁业务
6.10.5 发展动态
6.11 中山大洋电机股份有限公司
6.11.1 公司简介
6.11.2 经营情况
6.11.3 稀土永磁业务
6.12 中钢集团安徽天源科技股份有限公司
6.12.1 公司简介
6.12.2 经营情况
6.12.3 营收结构
6.12.4 稀土永磁业务
6.12.5 研发情况
6.13广东领益智造股份有限公司(原江粉磁材)
6.13.1 企业简介
6.13.2 经营情况
6.13.3 营收构成
6.13.4 稀土永磁业务
6.14江西金力永磁科技股份有限公司
6.14.1 企业简介
6.14.2 经营情况
6.14.3 稀土永磁业务
6.14.4 研发情况
6.15京磁材料科技股份有限公司
6.15.1 企业简介
6.15.2 经营情况
6.15.3 稀土永磁业务
6.16 中北通磁
6.16.1 企业简介
6.16.2 经营情况
6.16.3 主要客户
6.16.4 稀土永磁材料业务
6.17其他企业
6.17.1 烟台首钢磁性材料股份有限公司
6.17.2天津天和磁材技术有限公司
6.17.3北京斯洛玛格技术有限公司(原北京银纳金科科技有限公司)
6.17.4 宁波金科磁业有限公司
6.17.5 宁波金鸡强磁股份有限公司
6.17.6 包头金山磁材有限公司
6.17.7 宁波科田磁业有限公司
第七章 总结与预测
7.1 市场
7.2 企业
1 Introduction to Rare Earth Permanent Magnet Material
1.1 Definition and Classification
1.2 Industrial Chain
1.3 Development Course
2 Global Rare Earth Permanent Magnet Material Industry
2.1 Production
2.1.1 Output
2.1.2 Production Structure
2.2 Consumption
2.3 Competitive Landscape
2.4 Patents
3 Chinese Rare Earth Permanent Magnet Material Industry
3.1 Industrial Policy
3.2 Market Demand and Supply
3.2.1 Supply
3.2.2 Demand
3.2.3 Import and Export
3.3 Competitive Landscape
3.3.1 Enterprise Pattern
3.3.2 Regional Pattern
3.3.3 Product Structure
3.4 Price Trend
3.5 Status Quo of Technologies
3.5.1 Technological Achievements
3.5.2 Existing Problems
4 Upstream and Downstream of Rare Earth Permanent Magnet Material in China
4.1 Rare Earth Market
4.1.1 Resources and Distribution
4.1.2 Market Demand and Supply
4.1.3 Six Groups
4.1.4 Price Trend
4.2 Applied Markets
4.2.1 Automobile/New Energy Vehicle
4.2.2 Wind Power Equipment
4.2.3 Inverter Air-conditioner
4.2.4 Energy-saving Elevator
4.2.5 Industrial Robot
4.2.6 Consumer Electronics
5 Main Global Companies
5.1 Hitachi Metals Ltd.
5.1.1 Profile
5.1.2 Operation
5.1.3 Revenue Structure
5.1.4 Rare Earth Permanent Magnet Business
5.1.5 Presence in China
5.2 Shin-Etsu Chemical Co., Ltd.
5.2.1 Profile
5.2.2 Operation
5.2.3 Revenue Structure
5.2.4 Rare Earth Permanent Magnetic Materials Business
5.2.5 Presence in China
5.3 Tokyo Denki Kagaku Kogyo K.K.
5.3.1 Profile
5.3.2 Operation
5.3.3 Revenue Structure
5.3.4 Rare Earth Permanent Magnetic Materials Business
5.3.5 Presence in China
5.4 Vacuumschmelze (VAC)
5.4.1 Profile
5.4.2 Rare Earth Permanent Magnetic Materials Business
5.5 Magnequench
5.5.1 Profile
5.5.2 Rare Earth Permanent Magnetic Materials Business
5.5.3 Patent
6 Leading Chinese Companies
6.1 Beijing Zhong Ke San Huan Hi-Tech Co., Ltd.
6.1.1 Profile
6.1.2 Operation
6.1.3 Revenue Structure
6.1.4 Rare Earth Permanent Magnet Business
6.1.5 R&D
6.1.6 Investment
6.1.7 Performance Forecast
6.2 Yantai Zhenghai Magnetic Materials Co., Ltd.
6.2.1 Profile
6.2.2 Operation
6.2.3 Revenue Structure
6.2.4 Rare Earth Permanent Magnet Business
6.2.5 R&D
6.3 Ningbo Yunsheng Co., Ltd.
6.3.1 Profile
6.3.2 Operation
6.3.3 Revenue Structure
6.3.4 Rare Earth Permanent Magnet Business
6.3.5 R&D
6.3.6 Development Strategy
6.4 Advanced Technology & Materials Co., Ltd (AT&M)
6.4.1 Profile
6.4.2 Operation
6.4.3 Revenue Structure
6.4.4 Rare Earth Permanent Magnet Business
6.4.5 R&D
6.4.6 Development Strategy
6.5 Zhejiang Innuovo Magnetics Co., Ltd.
6.5.1 Profile
6.5.2 Operation
6.5.3 Revenue Structure
6.5.4 Rare Earth Permanent Magnet Business
6.5.5 R&D
6.6 Earth-Panda Advance Magnetic Material Co., Ltd.
6.6.1 Profile
6.6.2 Operation
6.6.3 Major Customers
6.6.4 Main Subsidiaries
6.6.5 Rare Earth Permanent Magnet Business
6.7 China Northern Rare Earth (Group) High-Tech Co., Ltd.
6.7.1 Profile
6.7.2 Operation
6.7.3 Revenue Structure
6.7.4 Rare Earth Permanent Magnet Business
6.7.5 Development Strategy
6.8 Xiamen Tungsten Co., Ltd. (XTC)
6.8.1 Profile
6.8.2 Operation
6.8.3 Revenue Structure
6.8.4 Rare Earth Permanent Magnet Business
6.9 Chengdu Galaxy Magnets Co., Ltd.
6.9.1 Profile
6.9.2 Operation
6.9.3 Revenue Structure
6.9.4 Rare Earth Permanent Magnet Business
6.9.5 Major Projects
6.10 Rising Nonferrous Metals Co., Ltd.
6.10.1 Profile
6.10.2 Operation
6.10.3 Revenue Structure
6.10.4 Rare Earth Permanent Magnet Business
6.10.5 Dynamics
6.11 Zhongshan Broad-Ocean Motor Co., Ltd.
6.11.1 Profile
6.11.2 Operation
6.11.3 Rare Earth Permanent Magnet Business
6.12 Sinosteel Anhui Tianyuan Technology Co., Ltd.
6.12.1 Profile
6.12.2 Operation
6.12.3 Revenue Structure
6.12.4 Rare Earth Permanent Magnet Business
6.12.5 R&D
6.13 Lingyi iTech (Guangdong) Co., Ltd. (formerly known as JPMF Guangdong Co., Ltd.)
6.13.1 Profile
6.13.2 Operation
6.13.3 Revenue Structure
6.13.4 Rare Earth Permanent Magnet Business
6.14 JL MAG Rare-Earth Co., Ltd.
6.14.1 Profile
6.14.2 Operation
6.14.3 Rare Earth Permanent Magnet Business
6.14.4 R&D
6.15 Jingci Material Science Co., Ltd. (formerly known as Beijing Jingci Magnet Co., Ltd.)
6.15.1 Profile
6.15.2 Operation
6.15.3 Rare Earth Permanent Magnet Business
6.16 Shenyang General Magnetic Co., Ltd.
6.16.1 Profile
6.16.2 Operation
6.16.3 Major Customers
6.16.4 Rare Earth Permanent Magnetic Materials Business
6.17 Others
6.17.1 Yantai Shougang Magnetic Material Inc.
6.17.2 Tianhe Magnets Co., Ltd.
6.17.3 Thinova Magnet Co., Ltd. (formerly known as Beijing Thinova Technology Co., Ltd.)
6.17.4 Jin Ke Magnetics Co., Ltd.
6.17.5 Ningbo Jinji Strong Magnetic Material Co., Ltd.
6.17.6 Baotou Jinshan Magnetic Material Co., Ltd.
6.17.7 Ningbo Ketian Magnet Co., Ltd.
7 Summary and Forecast
7.1 Market
7.2 Enterprise
图:磁性材料分类
表:各类磁体关键性能指标对比
图:稀土永磁材料产业链
表:中国稀土永磁材料发展历程
图:2011-2023年全球钕铁硼产量及增速
图:2011-2023年全球高性能钕铁硼产量及增速
图:2010-2023年中国钕铁硼产量全球占比
表:全球主要钕铁硼专利到期时间
表:世界钕铁硼产业向中国转移
表:钕铁硼消费领域
图:高性能钕铁硼主要应用领域
图:2014-2023年全球高性能钕铁硼需求量
表:国际稀土永磁厂商在华工厂
表:2018年底已获取日立金属烧结钕铁硼磁体专利的中国企业
表:2016-2018年中国稀土永磁材料主要政策
图:2011-2023年中国钕铁硼磁材产量及同比增长
图:2011-2023年中国高性能钕铁硼产量及增速
表:2016-2023年中国主要行业高性能钕铁硼需求量
图:2017-2018年中国稀土永磁产品出口量及金额
图:2018年中国稀土永磁产品出口(分品类)构成
图:2010-2018年中国稀土永磁铁(HS:85051110)出口量及金额
图:2018年中国稀土永磁产品出口(分省市)构成
图:2018年中国稀土永磁产品出口(分国家/地区)构成
表:2010-2018年中国稀土永磁铁(HS:85051110)进口量及金额
表:2018年中国稀土永磁产品进口(分国家/地区)构成
表:2018年中国主要稀土永磁材料生产商产能排名
表:2018年中国钕铁硼产能区域分布
图:2018年中国钕铁硼产量区域分布
图:2011-2023年中国烧结钕铁硼产量及占比
图:2018年中国钕铁硼(35UH)价格走势
图:2017-2018年中国钕铁硼(35UH)价格比较
表:2018年中国主要稀土永磁企业业绩变动
表:中国稀土永磁材料高值应用成果
图:2005-2018年中国稀土永磁材料行业专利公开数量变化
表:2018年全球(分国家)稀土开采量及储量
表:2018年中国稀土开采、冶炼分离指标
表:2019年第一批稀土开采、冶炼分离指标
图:2001-2018年中国稀土产量
图:中国稀土应用市场占比
图:2011-2018年中国稀土出口量
表:2018年中国稀土进口量及增速
表:中国六大稀土集团
图:中国稀土企业“1+5”格局
表:六大稀土集团资源整合情况
表:2018年北方稀土(集团)矿山、冶炼分离企业名单
表:2018年中国稀有稀土(中铝旗下)矿山、冶炼分离企业名单
表:2018年南方稀土集团矿山、冶炼分离企业名单
表:2018年广东稀土集团矿山、冶炼分离企业名单
表:2018年厦门钨业矿山、冶炼分离企业名单
表:2018年五矿稀土矿山、冶炼分离企业名单
图:2018-2019年中国氧化镨钕价格走势(元/公斤)
图:2018-2019年中国氧化镝和氧化铽价格走势(元/公斤)
图:2018-2019年中国氧化铕(钆、钬、铒)价格走势(元/公斤)
图:2017-2018年中国氧化镨钕价格对比
图:2017-2018年中国氧化镝价格对比
表:2018年中国主要稀土企业净利润
图:2012-2023年中国汽车产销量
图:2018年全球主要国家新能源汽车销量
图:2012-2023年中国新能源汽车产销量
表:2015-2018年中国新能源汽车(分类型)产销量
表:EPS与液压助力转向系统比较
图:2015-2020年全球新能源汽车产量及稀土永磁用量
表:2016-2023年中国汽车EPS钕铁硼需求量
表:不同车型电机及性能比较
表:2016-2023年中国新能源汽车用钕铁硼需求量
图:2010-2023年中国风电装机容量
表:两种风力发电机性能比较
表:2016-2023年中国风机设备钕铁硼需求量
表:2011-2023年中国家用空调产量
图:2013-2023年中国家用变频空调产量
表:变频空调与定频空调的对比
表:2016-2023年中国变频空调钕铁硼需求量
图:2012-2023年中国电梯产量
图:2014-2023年中国节能电梯产量
图:永磁同步曳引机结构图
表:永磁同步曳引机与蜗轮蜗杆曳引机比较
表:2016-2023年中国节能电梯钕铁硼需求量
图:2009-2021年全球工业机器人销量
Sales Volume of Industrial Robots in China, 2009-2023E
表:2016-2023年中国工业机器人钕铁硼需求量
图:2010-2023年全球及中国智能手机出货量
表:2014-2023年全球及中国智能手机对钕铁硼的需求
图:2018年全球手机VCM市场前12强
图:2011-2018财年日立金属营业收入及净利润
表:2018年日立金属主要业务
表:2015-2017财年日立金属(分产品)营业收入
表:2017财年日立金属(分区域)营业收入构成
表:日立金属磁材产品及应用
图:2013-2018财年日立金属磁材业务收入
图:日立金属磁性材料Medium-Term Management Plan
表:2018年日立金属磁材生产研发基地
图:2017财年日立金属在华业务分布
图:信越化学全球网络
表:2012-2019财年信越化学营业收入及净利润
图:2018-2019财年信越化学(分业务)营业收入构成
图:2018财年信越化学(分地区)营业收入构成
图:信越化学稀土永磁产品及应用
表:2018年信越化学稀土永磁材料生产基地分布
表:信越化学在华公司分布
表:2015-2019年信越化学在华投资情况
图:TDK全球营销网络
图:2012-2019财年TDK营业收入及净利润
表:2018年 TDK主要业务
图:2017-2019财年TDK(分产品)营业收入构成
图:2017-2019财年TDK(分地区)营业收入构成
表:TDK主要磁材产品及应用
图:2017-2018财年TDK 磁材业务运营情况
图:TDK磁材业务2020年发展计划
表:TDK主要磁材工厂分布
图:TDK NEOREC系列永磁材料特性
表:TDK在华公司分布
表:2015-2016年三环瓦克华(北京)主要经济指标
表:麦格昆磁粘结稀土磁体产品及应用
图:2009-2018年中科三环营业收入及净利润
表:2010-2018年中科三环(分产品)主营业务收入
表:2014-2018年中科三环(分地区)主营业务收入
图:2018年中科三环钕稀土永磁材料消费结构
图:2013-2018年中科三环研发投入金额及占比
表:中科三环磁材子公司
表:2016-2020年中科三环营业收入及净利润
图:2009-2018年正海磁材营业收入及净利润
表:2014-2018年正海磁材(分业务)主营业务收入及毛利率
图:2010-2018年正海磁材(分地区)营业收入构成
图:2010-2018年正海磁材钕铁硼业务收入及毛利率
表:2012-2017年正海磁材钕铁硼产销量
表:2017年正海磁材钕铁硼消费结构
图:2011-2018年正海磁材研发投入
图:2009-2018年宁波韵升营业收入及净利润
表:2014-2018年宁波韵升(分产品)主营业务收入
图:2010-2018年宁波韵升(分地区)营业收入构成
表:宁波韵升钕铁硼产品及应用
表:2015-2018年宁波韵升钕铁硼产销量
图:2009-2018年宁波韵升钕铁硼业务收入及毛利率
表:2018年上半年宁波韵升主要磁材子公司营业收入及净利润
表:2015-2018年宁波韵升研发支出
图:安泰科业务分布
图:2009-2018年安泰科技营业收入及净利润
表:安泰科技四大业务板块
表:2015-2018年安泰科技(分业务)主营业务收入
图:2010-2018年安泰科技(分地区)营业收入
表:2013-2018年海美格磁石技术(深圳)有限公司营业收入及净利润
表:2017-2018年安泰科技研发投入及占比
图:截至2018年底安泰科技稀土资产注入情况
图:2014-2018年英洛华营业收入及净利润
表:2015-2018英洛华(分业务)营业收入
表:2014-2018英洛华(分地区)主营业务收入
表:英洛华永磁材料主要子公司
表:2017-2018年英洛华稀土永磁材料子公司经营指标
表:2016-2018英洛华钕铁硼收入及毛利率
表:2015-2018英洛华钕铁硼产销量
表:2014-2017年大地熊营业主要经营指标
表:2015-2017年大地熊(分业务)主营业务收入
表:2015-2017年大地熊(分地区)主营业务收入
表:2017年大地熊销售收入TOP10客户
表:2017年大地熊向经销商销售情况
表:2017年大地熊主要子公司
表:大地熊稀土永磁产品及应用
表:2015-2017年大地熊烧结钕铁硼产销量
图:2015-2017年大地熊烧结钕铁硼销售价格
图:2009-2018年北方稀土营业收入及净利润
表:2014-2017年北方稀土(分产品)主营业务收入
表:2018年北方稀土三大分部运营指标
图:2009-2018年北方稀土(分地区)主营业务收入构成
表:2017-2018年内蒙古包钢稀土磁材公司主要运营指标
表:2017-2018年北京三吉利新材料公司主要运营指标
表:2018年9月厦门钨业股权结构
图:2009-2018年厦门钨业营业收入及净利润
表:2016-2018年厦门钨业(分业务)主营业务收入
表:2015-2017年厦门钨业稀土产品产销量
表:2010-2017年长汀金龙稀土有限公司主要经济指标
图:2009-2018年银河磁体营业收入及净利润
表:2016-2018年银河磁体(分产品)营业收入构成
图:2011-2018年银河磁体(分地区)营业收入构成
表:2012-2017年银河磁体稀土永磁体产销量
表:2014-2018年银河磁体稀土永磁体(分产品)销售收入
图:2009-2018年广晟有色营业收入及净利润
表:2015-2017年广晟有色(分产品)主营业务收入
图:2009-2017年广晟有色(分地区)营业收入构成
表:广晟有色旗下稀土永磁相关企业
表:2012-2017年广东广晟智威稀土新材料有限公司主要经济指标
图:2009-2018年大洋电机营业收入及净利润
表:2016-2018年大洋电机(分业务)营业收入构成
表:2012-2018年大洋电机磁性材料产销量及销售收入
表:中钢天源主要产品及应用
图:2009-2018年中钢天源营业收入及净利润
表:2016-2018年中钢天源(分产品)营业收入构成
图:2009-2018年中钢天源(分地区)营业收入构成
表:2016-2018年中钢天源研发投入
图:2013-2018年领益智造营业收入及净利润
表:2015-2017年领益智造(分业务)营业收入
表:2018上半年公司主营业务收入(分业务)
图:领益智造稀土永磁产品
表:2013-2017年领益智造稀土永磁产销量
图:2013-2017年领益智造稀土永磁销售收入及毛利率
表:2018年底金力永磁股东结构
图:2013-2018年金力永磁营业收入及净利润
表:2015-2017年金力永磁(分业务)营业收入
表:金力永磁钕铁硼产品应用领域及客户
表:2015-2017年金力永磁钕铁硼营业收入
表:2015-2018年金力永磁钕铁硼产、销量
表:2016-2018年金力永磁研发投入
图:2013-2017年京磁股份营业收入及净利润
表:2016年京磁股份钕铁硼(分应用)收入
图:2013-2018年中北通磁营业收入及净利润
表:2016-2018年中北通磁(分业务)营业收入及占比
表:2017年中北通磁Top5客户销售收入及占比
表:2018上半年中北通磁Top5客户销售收入及占比
图:天和磁材产业结构
表:科田磁业磁材应用领域
图:2018年中国钕铁硼企业竞争格局
Classification of Magnetic Materials
Comparison between Various Magnets by Key Performance Indicators
Rare Earth Permanent Magnetic Material Industry Chain
Development Course of Rare Earth Permanent Magnetic Materials in China
Global NdFeB Output and Growth Rate, 2011-2023E
Global High-performance NdFeB Output and Growth Rate, 2011-2023E
China’s NdFeB Output as a Percentage of Global Total, 2010-2023E
Expiration Timetable of Major NdFeB Patents Worldwide
Global NdFeB Industry Transfer to China
NdFeB Consumption Fields
Application Fields of High-performance NdFeB
Global Demand for High-performance NdFeB, 2014-2023E
Factories of International Rare Earth Permanent Magnet Manufacturers in China
Chinese Enterprises that Obtained the Sintered NdFeB Magnet Patent from Hitachi Metals in Late 2018
China’s Major Policies on Rare Earth Permanent Magnetic Materials, 2016-2018
China’s Output of NdFeB Magnetic Materials and YoY Growth, 2011-2023E
China’s Output of High-performance NdFeB and Growth Rate, 2011-2023E
Demand of High-performance NdFeB from Major Industries in China, 2016-2023E
China’s Rare Earth Permanent Magnet Export Volume and Value, 2017-2018
China’s Rare Earth Permanent Magnet Export Structure (by Category), 2018
China’s Rare Earth Permanent Magnet (HS: 85051110) Export Volume and Value, 2010-2018
China’s Rare Earth Permanent Magnet Export by Province/City, 2018
China’s Rare Earth Permanent Magnet Export by Country, 2018
China’s Rare Earth Permanent Magnet (HS: 85051110) Import Volume and Value, 2010-2018
China’s Rare Earth Permanent Magnet Import by Country, 2018
Ranking of Major Rare Earth Permanent Magnetic Material Manufacturers in China by Capacity, 2018
NdFeB Capacity Distribution by Region in China, 2018
NdFeB Capacity Distribution by Region in China, 2018
China’s Sintered NdFeB Output and Its Proportion, 2011-2023E
NdFeB (35UH) Price Trend in China, 2018
NdFeB (35UH) Price Comparison in China, 2017 vs 2018
Variations in Performance of Leading Chinese Rare Earth Permanent Magnet Enterprises, 2018
High-value Application Results of Rare Earth Permanent Magnetic Materials in China
Patent Disclosure of China’s Rare Earth Permanent Magnetic Material Industry, 2005-2018
Global Rare Earth Mining Volume and Reserves (by Country), 2018
China’s Rare Earth Mining, Smelting and Separation Indicators, 2018
China’s 1st Batch of Rare Earth Mining, Smelting and Separation Indicators, 2019
China’s Output of Rare Earths, 2001-2018
Rare Earth Application Market Structure in China
China’s Rare Earth Export Volume, 2011-2018
China’s Rare Earth Import Volume, 2018
Six Largest Rare Earth Groups in China
"1+5" Pattern of Rare Earth Enterprises in China
Resource Integration of Six Major Rare Earth Groups
Mining, Smelting and Separation Enterprises of China Northern Rare Earth (Group) High-Tech Co., Ltd., 2018
Mining, Smelting and Separation Enterprises of China’s Rare Earth Co., Ltd. (under CHALCO), 2018
Mining, Smelting and Separation Enterprises of China Southern Rare Earth Group, 2018
Mining, Smelting and Separation Enterprises of Guangdong Rare Earths Industry Group, 2018
Mining, Smelting and Separation Enterprises of Xiamen Tungsten Co., Ltd., 2018
Mining, Smelting and Separation Enterprises of China Minmetals Rare Earth Co., Ltd., 2018
Average Price of Praseodymium-Neodymium Oxide in China, 2018-2019
Average Prices of Dysprosium Oxide and Terbium Oxide in China, 2018-2019
Price Trend of Europium Oxide (Gadolinium, Holmium, Erbium) in China, 2018-2019 (RMB/kg)
Price Comparison of Praseodymium-Neodymium Oxide in China, 2017 vs 2018
Price Comparison of Dysprosium Oxide in China, 2017 vs 2018
Net Income of Major Rare Earth Companies in China, 2018
Automobile Output and Sales in China, 2012-2023E
Sales Volume of New Energy Vehicle in Major Countries, 2018
China’s New Energy Vehicle Output and Sales Volume, 2012-2023E
China’s New Energy Vehicle Output and Sales Volume (by Type), 2015-2018
Comparison between EPS and Hydraulic Power Steering System
Global Output of New Energy Vehicle and Use of Rare Earth Permanent Magnets, 2015-2020E
The Demand for NdFeB from Automotive EPS in China, 2016-2023E
Performance Comparison between Motors of Different Vehicle Models
The Demand for NdFeB from New Energy Vehicle in China, 2016-2023E
Wind Power Installed Capacity in China, 2010-2023E
Performance Comparison between Two Types of Wind Generators
The Demand for NdFeB from Wind Turbines in China, 2016-2023E
China’s Output of Household Air-conditioners, 2011-2023E
China’s Output of Inverter Air-conditioners, 2013-2023E
Comparison between Inverter Air Conditioners and Constant Frequency Air-conditioners
The Demand for NdFeB from Inverter Air-conditioners in China, 2016-2023E
Output of Elevators in China, 2012-2023E
China’s Output of Energy-saving Elevators, 2014-2023E
Structure Diagram of Permanent Magnet Synchronization Traction Machine
Comparison between Permanent Magnet Synchronization Traction Machine and Worm Gear Traction Machines
The Demand for NdFeB from Energy-saving Elevators in China, 2016-2023E
Global Industrial Robot Sales in China, 2009-2021E
Sales Volume of Industrial Robots in China, 2009-2023E
The Demand for NdFeB from Industrial Robots in China, 2016-2023E
Smartphone Shipments in China and the World, 2014-2023E
The Demand for NdFeB from Smartphone Worldwide and China, 2014-2023E
Top 12 Players in the World Cellphone VCM Market, 2018
Revenue and Net Income of Hitachi Metals, FY 2011-FY2018
Main Businesses of Hitachi Metals, 2018
Revenue of Hitachi Metals by Product, FY2015-FY2017
Revenue of Hitachi Metals by Region, FY 2017
Hitachi Metals’s Magnetic Materials and Applications
Magnetic Materials Revenue of Hitachi Metals, FY2013-FY2018
Magnetic Materials Medium-Term Management Plan of Hitachi Metals
Magnetic Materials Production and R&D Bases of Hitachi Metals, 2018
Hitachi Metals’s Business in China, FY2017
Global Network of Shin-Etsu Chemical
Revenue and Net Income of Shin-Etsu Chemical, FY2012-FY2019
Revenue Structure of Shin-Etsu Chemical by Business, FY2018-FY2019
Revenue Structure of Shin-Etsu Chemical by Region, FY2018
Shin-Etsu Chemical’s Rare Earth Permanent Magnets and Applications
Rare Earth Permanent Magnet Production Bases of Shin-Etsu Chemical, 2018
Subsidiaries Distribution of Shin-Etsu Chemical in China
Capital Investment of Shin-Etsu Chemical in China, 2015-2019
Global Marketing Network of TDK
Revenue and Net Income of TDK, FY2012-FY2019
Main Business of TDK, 2018
Revenue Structure of TDK by Product, FY2017-FY2019
Revenue Structure of TDK by Region, FY2017-FY2019
TDK’s Main Magnetic Materials and Their Applications
Net Sales and Operating Income of Magnetic Application Products of TDK, FY2017-FY2018
Development Plan of Magnetic Materials of TDK, 2020
Key Magnetic Materials Production Bases of TDK
Characteristics of TDK NEOREC Permanent Magnetic Materials
TDK’s Companies in China
Selected Economic Indicators of SANVAC (Beijing) MAGNETICS, 2015-2016
Bonded Rare Earth Magnets and Applications of Magneuench
Revenue and Net Income of Beijing Zhong Ke San Huan Hi-Tech, 2009-2018
Operating Revenue of Beijing Zhong Ke San Huan Hi-Tech by Product, 2010-2018
Operating Revenue of Beijing Zhong Ke San Huan Hi-Tech by Region, 2014-2018
Rare Earth Permanent Magnetic Materials Consumption Structure of Beijing Zhong Ke San Huan Hi-Tech, 2018
R&D Spending and % of Total Revenue of Beijing Zhong Ke San Huan Hi-Tech, 2013-2018
Rare Earth Permanent Magnetic Materials Subsidiaries of Beijing Zhong Ke San Huan Hi-Tech
Revenue and Net Income of Beijing Zhong Ke San Huan Hi-Tech, 2016-2020E
Revenue and Net Income of Yantai Zhenghai Magnetic Materials, 2009-2018
Operating Revenue and Gross Margin of Yantai Zhenghai Magnetic Materials by Business, 2014-2018
Revenue of Yantai Zhenghai Magnetic Materials by Region, 2010-2018
NdFeB Revenue and Gross Margin of Yantai Zhenghai Magnetic Materials, 2010-2018
NdFeB Output and Sales of Yantai Zhenghai Magnetic Materials, 2012-2017
NdFeB Consumption Structure of Yantai Zhenghai Magnetic Materials, 2017
R&D Spending of Yantai Zhenghai Magnetic Materials, 2011-2018
Revenue and Net Income of Ningbo Yunsheng, 2009-2018
Operating Revenue of Ningbo Yunsheng by Product, 2014-2018
Revenue Structure of Ningbo Yunsheng by Region, 2010-2018
NdFeB Products and Application of Ningbo Yunsheng
NdFeB Output and Sales of Ningbo Yunsheng, 2015-2018
NdFeB Revenue and Gross Margin of Ningbo Yunsheng, 2009-2018
Revenue and Net Income of Ningbo Yunsheng’s Major Magnetic Material Subsidiaries, 2018H1
R&D Spending of Ningbo Yunsheng, 2015-2018
Operations of AT&M
Revenue and Net Income of AT&M, 2009-2018
Four Business Segments of AT&M
Operating Revenue of AT&M by Business, 2015-2018
Revenue of AT&M by Region, 2010-2018
Revenue and Net Income of High Mag Technology (Shenzhen), 2013-2018
R&D Spending and % of AT&M, 2017-2018
Rare Earth Asset Injections of AT&M, by End-2018
Revenue and Net Income of Zhejiang Innuovo, 2014-2018
Revenue Structure of Zhejiang Innuovo by Business, 2015-2018
Operating Revenue of Zhejiang Innuovo by Region, 2014-2018
Zhejiang Innuovo’s Rare Earth Permanent Magnetic Materials Subsidiaries
Business Indicators of Zhejiang Innuovo’s Rare Earth Permanent Magnetic Materials Subsidiaries, 2017-2018
NdFeB Revenue and Gross Margin of Zhejiang Innuovo, 2016-2018
NdFeB Output and Sales of Zhejiang Innuovo, 2015-2018
Major Business Indicators of Earth-Panda Advance Magnetic Material, 2014-2017
Operating Revenue of Earth-Panda Advance Magnetic Material by Business, 2015-2017
Operating Revenue of Earth-Panda Advance Magnetic Material by Region, 2015-2017
Top10 Clients of Earth-Panda Advance Magnetic Material, 2017
Earth-Panda Advance Magnetic Material’s Sales to Its Dealers, 2017
Major Subsidiaries of Earth-Panda Advance Magnetic Material, 2017
Permanent Magnets and Applications of Earth-Panda Advance Magnetic Material
NdFeB Output and Sales of Earth-Panda Advance Magnetic Material, 2015-2017
Sintered NdFeB Selling Prices of Earth-Panda Advance Magnetic Material, 2015-2017
Revenue and Net Income of China Northern Rare Earth (Group) High-Tech, 2009-2018
Operating Revenue of China Northern Rare Earth (Group) High-Tech by Product, 2014-2017
Operating Indices of China Northern Rare Earth (Group) High-Tech by Segment, 2018
Revenue of China Northern Rare Earth (Group) High-Tech by Region, 2009-2018
Operating Indices of Inner Mongolia Baosteel Rare Earth Magnetic Materials, 2017-2018
Operating Indices of Beijing Sanjili New Materials Co., Ltd., 2017-2018
Ownership Structure of Xiamen Tungsten, Sep. 2018
Revenue and Net Income of Xiamen Tungsten, 2009-2018
Revenue Breakdown of Xiamen Tungsten by Business, 2016-2018
Output and Sales of Xiamen Tungsten’s Rare Earth Products, 2015-2017
Selected Economic Indicators of Fujian Changting Golden Gragon Rare-Earth Co., Ltd., 2010-2017
Revenue and Net Income of Chengdu Galaxy Magnets, 2009-2018
Revenue Structure of Chengdu Galaxy Magnets by Product, 2016-2018
Revenue Structure of Chengdu Galaxy Magnets by Region, 2011-2018
Permanent Magnet Output and Sales of Chengdu Galaxy Magnets, 2012-2017
Rare Earth Permanent Magnet Sales of Chengdu Galaxy Magnets by Product, 2014-2018
Revenue and Net Income of Rising Nonferrous Metals, 2009-2018
Operating Revenue and Gross Margin of Rising Nonferrous Metals by Product, 2015-2017
Revenue Structure of Rising Nonferrous Metals by Region, 2009-2017
Rare Earth Permanent Magnet-related Enterprises of Rising Nonferrous Metals
Selected Economic Indicators of Guangdong Rising Wisdom Rare Earth New Materials, 2012-2017
Revenue and Net Income of Zhongshan Broad-Ocean Motor, 2009-2018
Revenue Structure of Zhongshan Broad-Ocean Motor by Business, 2016-2018
Magnetic Materials Output & Sales and Revenue of Zhongshan Broad-Ocean Motor, 2012-2018
Main Products and Their Applications of Sinosteel Anhui Tianyuan Technology
Revenue and Net Income of Sinosteel Anhui Tianyuan Technology, 2009-2018
Revenue Structure of Sinosteel Anhui Tianyuan Technology by Product, 2016-2018
Revenue Structure of Sinosteel Anhui Tianyuan Technology by Region, 2009-2018
R&D Spending and % of Sinosteel Anhui Tianyuan Technology, 2016-2018
Revenue and Net Income of Lingyi iTech (Guangdong), 2013-2018
Revenue Breakdown of Lingyi iTech (Guangdong) by Business, 2015-2017
Revenue Breakdown of Lingyi iTech (Guangdong) by Business, 2018H1
Rare Earth Permanent-Magnet Products of Lingyi iTech (Guangdong)
Rare Earth Permanent Magnet Output and Sales of Lingyi iTech (Guangdong), 2013-2017
Rare Earth Permanent Magnet Revenue and Gross Margin of Lingyi iTech (Guangdong), 2013-2017
Ownership Structure of JL MAG Rare-Earth, End 2018
Revenue and Net Income of JL MAG Rare-Earth, 2013-2018
Revenue of JL MAG Rare-Earth by Business, 2015-2017
NdFeB Applications and Customers of JL MAG Rare-Earth
NdFeB Revenue of JL MAG Rare-Earth, 2015-2017
NdFeB Capacity and Output of JL MAG Rare-Earth, 2015-2018
R&D Spending and % of Total Revenue of JL MAG Rare-Earth, 2016-2018
Revenue and Net Income of Jingci Material Science, 2013-2017
NdFeB Revenue of Jingci Material Science by Application, 2016
Revenue and Net Income of Shenyang General Magnetic, 2013-2018
Revenue Structure of Shenyang General Magnetic by Business, 2016-2018
Top5 Customers of Shenyang General Magnetic, 2017
Top5 Customers of Shenyang General Magnetic, 2018H1
Industrial Structure of Tianhe Magnets
Application of Ningbo Ketian Magnet’s Magnetic Materials
Competitive Landscape of NdFeB Enterprises in China, 2018
如果这份报告不能满足您的要求,我们还可以为您定制报告,请 留言说明您的详细需求。
|