|
|
|
报告导航:研究报告—
制造业—化工
|
|
2013-2016年全球及中国环氧树脂行业研究报告 |
 |
字数:3.3万 |
页数:92 |
图表数:113 |
|
中文电子版:8000元 |
中文纸版:4000元 |
中文(电子+纸)版:8500元 |
|
英文电子版:2200美元 |
英文纸版:2300美元 |
英文(电子+纸)版:2500美元 |
|
编号:HK038
|
发布日期:2013-09 |
附件:下载 |
 |
|
|
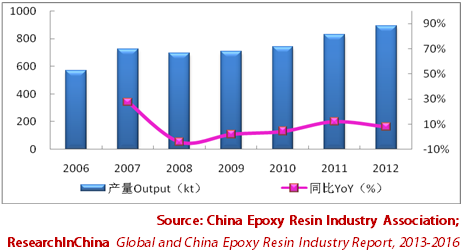
环氧树脂(Epoxy resins)是含有两个或两个以上环氧基团的高分子化合物,主要应用于涂料、电子电气、复合材料等领域。 2012年,全球环氧树脂产量约241万吨(其中约80%-95%为双酚A型环氧树脂),主要分布在亚洲、西欧和美国,三地区的环氧树脂产量占全球总产量的90%以上。近年来,由于欧美环氧树脂市场趋于饱和,新增环氧树脂产能主要集中在亚洲地区特别是中国。 中国是目前全球最大的环氧树脂生产国,产量约为全球总产量的37.1%。2012年,中国环氧树脂市场较低迷,整体表现为低端产品过剩、高端产品供应不足,环氧树脂装置开工率仅为45.9%。未来几年,中国新增高端环氧树脂产能较多,高端产品对进口的依赖程度有望逐步降低。
图:2006-2012中国环氧树脂产量及增长率
全球环氧树脂行业集中度较高,2012年前五家生产企业产能之和占全球总产能的53.1%,主要企业包括南亚塑胶、陶氏化学、迈图、亨斯迈、江苏三木集团等。 中国大陆环氧树脂行业具有绝对规模优势的厂商相对较少,行业集中度低于欧美地区。 2012年中国大陆排名前五的环氧树脂生产企业产能之和占中国总产能的41.8%。其中产能前三的企业分别为南亚环氧树脂(昆山)有限公司、江苏三木集团和巴陵石化,产能分别为31.6万吨、20万吨和12.5万吨。 环氧树脂的主要原料为环氧氯丙烷和双酚A。2012年,中国环氧氯丙烷市场基本由本土厂商主导,自给率为93.9%,产能前三的企业为山东海力化工、益海嘉里集团和山东鑫岳化工;而双酚A市场需求则大部分依赖于进口,自给率仅为39.0%,产能前三的企业为拜耳(上海)聚合物有限公司、中石化三菱化学聚碳酸酯(北京)有限公司和上海中石化三井化工有限公司。 水清木华研究中心《2013-2016年全球及中国环氧树脂产业链研究报告》主要包括以下几个内容:
- 全球环氧树脂行业市场规模、竞争格局、发展趋势等;
- 中国环氧树脂行业政策环境、供需分析、竞争格局、进出口分析、价格走势、发展预测等;
- 上游环氧氯丙烷市场供需分析、竞争格局、进出口分析、价格走势等;
- 上游双酚A市场供需分析、竞争格局、进出口分析、价格走势等;
- 下游涂料、电子电气、复合材料等行业对环氧树脂的需求分析及发展预测;
- 全球及中国17家环氧树脂生产企业的经营情况、环氧树脂业务分析、发展预测等。
Epoxy resin is a macro molecular compound containing two or more epoxy groups, mainly used in paint, electronics, composite materials and other fields. In 2012, the global output of epoxy resin (bisphenol A epoxy resin accounted for about 80% -95%) hit about 2.41 million tons, above 90% of which was contributed by Asia, Western Europe and the United States. In recent years, the epoxy resin market in Europe and the United States has tended to be saturated, while the new capacities have been mainly concentrated in the Asian regions, particularly in China. China is currently the world's largest producer of epoxy resin, sharing approximately 37.1% of the global output. In 2012, the sluggish Chinese epoxy resin market was featured with surplus low-end products, insufficient supply of high-end products and low operating rate (45.9%) of epoxy resin plants. In the next few years, China will improve the capacity of high-end epoxy resin, so as to reduce its dependence on imports.
China’s Epoxy Resin Output and Growth Rate, 2006-2012
The global epoxy resin industry is highly concentrated. In 2012, the combined capacity of top five manufacturers including Nan Ya Plastics, Dow Chemical, Momentive, Huntsman and Jiangsu Sanmu Group accounted for 53.1% of the global capacity. In Mainland China, a few epoxy resin producers enjoy absolute superiority in scale, and the industry concentration degree is lower than that in Europe and America. In 2012, top five epoxy resin manufacturers in Chinese Mainland contributed to 41.8% of China’s total capacity together. By capacity, the first three positions were occupied by Nan Ya Epoxy Resin (Kunshan), Jiangsu Sanmu Group and Baling Petrochemical with 316,000 tons, 200,000 tons and 125,000 tons respectively. Epoxy resin is made from epichlorohydrin and bisphenol A. In 2012, Chinese epichlorohydrin market was basically dominated by local manufacturers with the self-sufficiency rate of 93.9%; the top three enterprises by capacity were Shandong Haili Chemical Industry, Yihai Kerry and Shandong Xinyue Chemical. However, Bisphenol A relies on imports, and the self-sufficiency rate was only 39.0%; Bayer Polymers Shanghai, Sinopec Mitsubishi Chemical Polycarbonate (Beijing) and Shanghai Sinopec Mitsui Chemicals ranked the top three in terms of bisphenol A capacity. The report consists of the followings: Market size, competition pattern and development trends of the global epoxy resin industry; Policies, supply and demand, competition pattern, import and export, price trends and development outlook of China epoxy resin industry; Supply and demand, competition pattern, import and export and price trend of the upstream epichlorohydrin market; Supply and demand, competition pattern, import and export and price trend of the upstream bisphenol A market; The demand of downstream paint, electrical and electronic, composite materials and other industries for epoxy resin and development forecast; Operation, epoxy resin business and prospects of 17 global and Chinese epoxy resin manufacturers.
第一章 环氧树脂行业概述
1.1 定义及性质
1.2 分类及用途
1.3 产业链
第二章 全球环氧树脂行业分析
2.1 发展现状
2.2 市场规模
2.3 竞争格局
2.4 发展趋势
第三章 中国环氧树脂行业分析
3.1 发展历程
3.2 政策环境
3.3 发展现状
3.4 市场供给
3.5 市场需求
3.6 竞争格局
3.7 进出口
3.8 价格分析
3.9 发展及预测
3.9.1 发展趋势
3.9.2 供需预测
第四章 中国环氧树脂上游行业分析
4.1 环氧氯丙烷
4.1.1 概述
4.1.2 发展现状
4.1.3 市场供给
4.1.4 市场需求
4.1.5 进出口
4.1.6 价格趋势
4.2 双酚A
4.2.1 概述
4.2.2 市场供给
4.2.3 市场需求
4.2.4 进出口
4.2.5 价格趋势
第五章 中国环氧树脂下游行业分析
5.1 涂料行业对环氧树脂的需求
5.2 电子电气行业对环氧树脂的需求
5.3 复合材料行业对环氧树脂的需求
5.4 发展预测
第六章 国外主要生产企业
6.1 美国迈图
6.1.1 公司简介
6.1.2 经营情况
6.1.2 环氧树脂业务
6.2 美国陶氏化学
6.2.1 公司简介
6.2.2 经营情况
6.2.3 环氧树脂业务
6.2.4 在华业务
6.3 美国亨斯迈
6.3.1 公司简介
6.3.2 经营情况
6.3.3 环氧树脂业务
6.3.4 在华业务
6.4 韩国国都化学
6.4.1 公司简介
6.4.2 经营情况
6.4.3 在华环氧树脂业务
第七章 中国主要生产企业
7.1 宏昌电子
7.1.1 公司介绍
7.1.2 经营情况
7.1.3 营收构成
7.1.4 毛利率
7.1.5 研发
7.1.6 环氧树脂业务
7.1.7 预测与展望
7.2 蓝星新材
7.2.1 公司简介
7.2.2 经营情况
7.2.3 营收构成
7.2.4 毛利率
7.2.5 客户
7.2.6 环氧树脂业务
7.2.7 预测与展望
7.3 南亚(昆山)
7.3.1 公司简介
7.3.2 南亚(昆山)经营情况
7.3.3 南亚塑胶经营状况
7.3.4 南亚塑胶供应商分析
7.3.5 南亚塑胶环氧树脂业务
7.4 建滔化工
7.4.1 公司简介
7.4.2 建滔积层板经营情况
7.4.3 建滔积层板营收构成
7.4.4 环氧树脂业务
7.5 江苏三木
7.5.1 公司简介
7.5.2 经营情况
7.5.3 环氧树脂业务
7.6 其他企业
7.6.1大连齐化
7.6.2 长春化工
7.6.3 廊坊诺尔信
7.6.4 安徽恒远
7.6.5 扬农锦湖
7.6.6 上海元邦
7.6.7 巴陵石化
7.6.8安徽善孚
1 Overview of Epoxy Resin Industry
1.1 Definition and Properties
1.2 Classification and Application
1.3 Industry Chain
2 Global Epoxy Resin Industry
2.1 Status Quo
2.2 Market Size
2.3 Competition Pattern
2.4 Development Trend
3 China Epoxy Resin Industry
3.1 History
3.2 Policy
3.3 Status Quo
3.4 Market Supply
3.5 Market Demand
3.6 Competition Pattern
3.7 Import & Export
3.8 Price
3.9 Development and Forecast
3.9.1 Development Trend
3.9.2 Supply and Demand Forecast
4 China Epoxy Resin Upstream Industry
4.1 Epichlorohydrin
4.1.1 Overview
4.1.2 Status Quo
4.1.3 Market Supply
4.1.4 Market Demand
4.1.5 Import and Export
4.1.6 Price Trend
4.2 Bisphenol A
4.2.1 Overview
4.2.2 Market Supply
4.2.3 Market Demand
4.2.4 Import and Export
4.2.5 Price Trend
5 China Epoxy Resin Downstream Industry
5.1 Demand from Coating Industry
5.2 Demand from Electrical and Electronic Industry
5.3 Demand from Composite Material Industry
5.4 Development Forecast
6 Major Foreign Manufacturers
6.1 Momentive
6.1.1 Profile
6.1.2 Operation
6.1.2 Epoxy Resin Business
6.2 Dow Chemical
6.2.1 Profile
6.2.2 Operation
6.2.3 Epoxy Resin Business
6.2.4 Business in China
6.3 Huntsman
6.3.1 Profile
6.3.2 Operation
6.3.3 Epoxy Resin Business
6.3.4 Business in China
6.4 Kukdo Chemical
6.4.1 Profile
6.4.2 Operation
6.4.3 Epoxy Resin Business in China
7 Major Chinese Producers
7.1 Epoxy Base Electronic Material
7.1.1 Profile
7.1.2 Operation
7.1.3 Revenue Structure
7.1.4 Gross Margin
7.1.5 R & D
7.1.6 Epoxy Resin Business
7.1.7 Forecast and Outlook
7.2 Blue Star New Chemical Materials
7.2.1 Profile
7.2.2 Operation
7.2.3 Revenue Structure
7.2.4 Gross Margin
7.2.5 Clients
7.2.6 Epoxy Resin Business
7.2.7 Forecast and Outlook
7.3 Nan Ya (Kunshan)
7.3.1 Profile
7.3.2 Operation of Nan Ya (Kunshan)
7.3.3 Operation of Nan Ya Plastics
7.3.4 Suppliers of Nan Ya Plastics
7.3.5 Epoxy Resin Business of Nan Ya Plastics
7.4 Kingboard Chemical
7.4.1 Profile
7.4.2 Operation of Kingboard Laminates
7.4.3 Revenue Structure of Kingboard Laminates
7.4.4 Epoxy Resin Business
7.5 Jiangsu Sanmu
7.5.1 Profile
7.5.2 Operation
7.5.3 Epoxy Resin Business
7.6 Other Enterprises
7.6.1 Dalian Qihua
7.6.2 Changchun Chemical
7.6.3 Langfang NORSUN
7.6.4 Anhui Hengyuan Chemical
7.6.5 Yangnong Kumho
7.6.6 Shanghai Yoo-point Resin
7.6.7 Baling Petrochemical
7.6.8 Anhui Shanfu
表:环氧树脂分类
图:环氧树脂产业链
图:2006-2012年全球环氧树脂产量及增长率
图:2012年全球环氧树脂产量地区分布
图:2012年全球主要环氧树脂生产企业产能占比
图:2012年中国大陆主要的环氧树脂生产企业
图:2013年中国拟建/在建环氧树脂项目
图:2006-2012中国环氧树脂产量及增长率
图:2006-2012年中国环氧树脂表观消费量及自给率
图:2012年中国大陆环氧树脂生产企业竞争格局
图:2008-2013年中国环氧树脂进出口量
图:2008-2013年中国环氧树脂进出口平均价格
图:2012年中国环氧树脂进口来源结构(按进口量) 22
图:2012年中国环氧树脂出口目的地分布(按出口量)
图:2012年中国进口环氧树脂的主要省市及其进口量占比
图:2012年中国出口环氧树脂的主要省市及其出口量占比
图:2006-2013年中国环氧树脂(6101)市场平均价格
图:2012-2016年中国环氧树脂行业供需预测
表:2012年中国大陆环氧氯丙烷生产企业及其产能
图:2012年中国环氧氯丙烷产能地区分布
图:2012年中国环氧氯丙烷产能结构(按生产工艺)
图:2013年中国拟建/在建环氧氯丙烷项目
图:2006-2012年中国环氧氯丙烷产量及同比增长率
图:2006-2012年中国环氧氯丙烷表观消费量及自给率
图:2008-2013年中国环氧氯丙烷进出口量
图:2008-2013年中国环氧氯丙烷进出口平均价格
图:2012年中国环氧氯丙烷进口来源分布(按进口量)
图:2012年中国环氧氯丙烷出口目的地分布(按出口量)
图:2012年中国进口环氧氯丙烷主要地区及其进口量占比
图:2012年中国出口环氧氯丙烷主要地区及其出口量占比
图:2006-2013年中国环氧氯丙烷市场平均价格
图:2012年中国大陆双酚A生产企业及其产能
图:2013年中国拟建/在建双酚A项目
图:2006-2012年中国双酚A产量及增长率
图:2006-2012年中国双酚A表观消费量及自给率
图:2008-2013年中国双酚A进出口量
图:2008-2013年中国双酚A进出口平均价格
图:2012年中国双酚A进口来源结构(按进口量)
图:2012年中国双酚A出口目的地分布(按出口量)
图:2012年中国进口双酚A主要地区及其进口量占比
图:2012年中国出口双酚A主要地区及其出口量占比
图:2006-2013年中国双酚A市场平均价格
图:2012年中国环氧树脂下游消费结构
图:2006-2013年中国涂料产量及增长率
图:2008-2013年中国环氧树脂涂料进出口量
图:2006-2013年中国电子设备制造业主营业务收入及同比增长
图:2003-2012年中国风电装机容量
图:20121和2016年中国环氧树脂下游消费结构预测
图:2008-2010年迈图特种化学净销售额及毛利润
图:2008-2010年迈图特种化学(分产品)净销售额占比
图:2008-2010年迈图特种化学环氧/酚醛树脂部门净销售额及EBITDA
表:美国迈图公司特种环氧树脂产品应用情况
表:美国迈图公司基础环氧树脂产品应用情况
图:2008-2012年陶氏化学净销售额和净利润
图:2012年陶氏化学(分部门)营业收入占比
图:2009-2012年美国陶氏化学高性能材料部门销售额及EBITDA
图:2012年陶氏化学高性能材料部门(分产品)销售额占比
表:陶氏化学环氧树脂相关产品生产基地
图:2007-2009年陶氏化学(张家港)主营业务收入及毛利润
表:亨斯迈业务部门及主要产品
图:2008-2012年亨斯迈营业收入和净利润
图:2012年亨斯迈(分部门)营业收入占比
图:2012年亨斯迈(分部门)Adjusted EBITDA占比
图:2008-2012年亨斯迈先进材料部门营业收入及EBITDA
图:2007-2009年亨斯迈(广东)主营业务收入及毛利润
图:2006-2010年韩国国都化学销售额及净利润
图:2007-2009年国都(昆山)主营业务收入及毛利润
图:2008-2013年宏昌电子营业收入和净利润
表:2011-2013年宏昌电子(分产品)营业收入
图:2011-2013年宏昌电子(分产品)营业收入占比
表:2011-2013年宏昌电子(分地区)营业收入
图:2011-2013年宏昌电子(分地区)营业收入占比
表:2011-2013年宏昌电子主营产品毛利率
表:2012年宏昌电子主要在研项目
图:2010-2012年宏昌电子研发支出及占营业收入比例
表:2002-2013年宏昌电子环氧树脂产能
图:2008-2013年宏昌电子环氧树脂销量
图:2012年宏昌电子环氧树脂产品应用领域
图:2012-2016E宏昌电子营业收入及净利润预测
表:2012年蓝星新材主营业务及其生产能力
图:2008-2013年蓝星新材营业收入及净利润
表:2011-2013年蓝星新材(分产品)营业收入
图:2011-2013年蓝星新材(分产品)营业收入占比
表:2010-2012年蓝星新材(分地区)营业收入
图:2010-2012年蓝星新材(分地区)营业收入占比
表:2010-2013年蓝星新材主营产品毛利率
图:2010-2013年蓝星新材前五名客户贡献收入及占比
表:2013H1蓝星新材前五名客户名称、收入贡献及占比
图:2012-2013年南通星辰营业收入和净利润
图:2011-2013年南通星辰环氧树脂及双酚A产量
图:2012-2016E蓝星新材营业收入及净利润预测
表:南亚塑胶主要产品
图:2008-2010年南亚(昆山)营业收入及营业利润
图:2008-2012年南亚塑胶营业收入和净利润
图:2012年南亚塑胶主营产品销售收入及其营业收入占比
图:2010-2012年南亚塑胶前三名供应商采购金额及占比
表:2012年南亚塑胶前三名供应商名称、采购金额及占比
图:南亚塑胶环氧树脂相关产品及联系
图:2008-2012年南亚塑胶环氧树脂业务收入及其营业收入占比
图:2008-2012年南亚塑胶环氧树脂产销量
图:2008-2012年南亚塑胶环氧树脂自用量和外销量
图:2008-2012年建滔积层板营业收入和净利润
表:2010-2012年建滔积层板(分产品)营业收入
图:2010-2012年建滔积层板(分产品)营业收入占比
表:2010-2012年建滔积层板(分地区)营业收入
图:2010-2012年建滔积层板(分地区)营业收入占比
表:江苏三木主要产品
图:2007-2009年江苏三木主营业务收入及毛利润
图:2007-2009年大连齐化主营业务收入及毛利润
图:2007-2009年长春化工(江苏)主营业务收入及毛利润
图:2007-2009年廊坊诺尔信主营业务收入及毛利润
图:2007-2009年安徽恒远主营业务收入及毛利润
表:2011-2012年巴陵石化产品总量及营业收入
Classification of Epoxy Resin
Epoxy Resin Industry Chain
Global Epoxy Resin Output and Growth Rate, 2006-2012
Global Epoxy Resin Output by Region, 2012
Capacity Breakdown of Major Global Epoxy Resin Producers, 2012
Main Epoxy Resin Manufacturers in China, 2012
China's Planned/Ongoing Epoxy Resin Projects, 2013
China’s Epoxy Resin Output and Growth Rate, 2006-2012
China’s Apparent Consumption of Epoxy Resin and Self-sufficiency Rate, 2006-2012
Competition Pattern of Epoxy Resin Manufacturers in Mainland China, 2012
China’s Epoxy Resin Import and Export Volume, 2008-2013
Average Import and Export Price of Epoxy Resin in China, 2008-2013
China’s Epoxy Resin Import Source Structure (by Import Volume) , 2012
Export Destinations of Chinese Epoxy Resin (by Export Volume), 2012
Major Epoxy Resin Importing Provinces/Municipalities and Import Volume Breakdown in China, 2012
Major Epoxy Resin Exporting Provinces/Municipalities and Import Volume Breakdown in China, 2012
Average Market Price of Epoxy Resin (6101) in China, 2006-2013
Supply and Demand in China Epoxy Resin Industry, 2012-2016E
Epichlorohydrin Manufacturers and Their Capacity in Mainland China, 2012
Geographical Distribution of Epichlorohydrin Capacity in China, 2012
China’s Epichlorohydrin Capacity Structure (by Production Process), 2012
China’s Proposed/Ongoing Epichlorohydrin Projects, 2013
China’s Epichlorohydrin Output and YoY Growth Rate, 2006-2012
China’s Epichlorohydrin Apparent Consumption and Self-sufficiency Rate, 2006-2012
China’s Epichlorohydrin Import and Export Volume, 2008-2013
China’s Average Epichlorohydrin Import and Export Price, 2008-2013
Import Sources of Epichlorohydrin in China (by Import Volume), 2012
Export Destinations of Chinese Epichlorohydrin (by Export Volume), 2012
Major Epichlorohydrin Importing Provinces/Municipalities and Import Volume Breakdown in China, 2012
Major Epichlorohydrin Exporting Provinces/Municipalities and Import Volume Breakdown in China, 2012
China’s Average Epichlorohydrin Market Price, 2006-2013
Bisphenol A Manufacturers and Their Capacity in Mainland China, 2012
China’s Proposed/Ongoing Bisphenol A Projects, 2013
China’s Bisphenol A Output and Growth Rate, 2006-2012
China’s Bisphenol A Apparent Consumption and Self-sufficiency Rate, 2006-2012
China’s Bisphenol A Import and Export Volume, 2008-2013
China’s Average Bisphenol A Import and Export Price, 2008-2013
China’s Bisphenol A Import Source Structure (by Import Volume) , 2012
Export Destinations of Chinese Bisphenol A (by Export Volume), 2012
Major Bisphenol A Importing Provinces/Municipalities and Import Volume Breakdown in China, 2012
Major Bisphenol A Exporting Provinces/Municipalities and Import Volume Breakdown in China, 2012
Average Market Price of Bisphenol A in China, 2006-2013
China’s Epoxy Resin Downstream Consumption Structure, 2012
China’s Paint Output and Growth Rate, 2006-2013
China’s Epoxy Resin Paint Import and Export Volume, 2008-2013
Operating Revenue and YoY Growth Rate of China Electronic Equipment Manufacturing Industry, 2006-2013
China’s Installed Wind Power Capacity, 2003-2012
China’s Epoxy Resin Downstream Consumption Structure, 2012-2016E
Net Sales and Gross Margin of Momentive, 2008-2010
Net Sales of Momentive (by Product), 2008-2010
Net Sales and EBITDA of Momentive’s Epoxy/Phenolic Resin Division, 2008-2010
Application of Special Epoxy Resin Products of Momentive
Application of Basic Epoxy Resin Products of Momentive
Net Sales and Net Income of Dow Chemical, 2008-2012
Revenue Structure of Dow Chemical (by Division), 2012
Revenue and EBITDA of Dow Chemical’s High Performance Materials Division, 2009-2012
Revenue Percentage of Dow Chemical’s High Performance Materials Division (by Product), 2012
Production Bases of Epoxy Resin-Related Products of Dow Chemical
Operating Revenue and Gross Profit of Dow Chemical (Zhangjiagang), 2007-2009
Divisions and Main Products of Huntsman
Revenue and Net Income of Huntsman, 2008-2012
Revenue Structure of Huntsman (by Division), 2012
Adjusted EBITDA Structure of Huntsman (by Division), 2012
Revenue and EBITDA of Huntsman’s Advanced Materials Division, 2008-2012
Operating Revenue and Gross Profit of Huntsman (Guangdong), 2007-2009
Revenue and Net Income of Kukdo Chemical, 2006-2010
Operating Revenue and Gross Profit of Kukdo Chemical (Kunshan), 2007-2009
Revenue and Net Income of Epoxy Base Electronic, 2008-2013
Revenue of Epoxy Base Electronic (by Product), 2011-2013
Revenue Structure of Epoxy Base Electronic (by Product), 2011-2013
Revenue of Epoxy Base Electronic (by Region), 2011-2013
Revenue Structure of Epoxy Base Electronic (by Region), 2011-2013
Gross Margin of Main Products of Epoxy Base Electronic, 2011-2013
Main On-research Projects of Epoxy Base Electronic, 2012
R&D Costs and % of Total Revenue of Epoxy Base Electronic, 2010-2012
Epoxy Resin Capacity of Epoxy Base Electronic, 2002-2013
Epoxy Resin Sales Volume of Epoxy Base Electronic, 2008-2013
Application of Epoxy Resin Products of Epoxy Base Electronic, 2012
Revenue and Net Income of Epoxy Base Electronic, 2012-2016E
Main Business and Capacity of Blue Star New Chemical Materials, 2012
Revenue and Net Income of Blue Star New Chemical Materials, 2008-2013
Revenue of Blue Star New Chemical Materials (by Product), 2011-2013
Revenue Structure of Blue Star New Chemical Materials (by Product), 2011-2013
Revenue of Blue Star New Chemical Materials (by Region), 2010-2012
Revenue Structure of Blue Star New Chemical Materials (by Region), 2010-2012
Gross Margin of Main Products of Blue Star New Chemical Materials, 2010-2013
Revenue from Top 5 clients and % of Total Revenue of Blue Star New Chemical Materials, 2010-2013
Name List and Revenue Contribution of Top 5 Clients of Blue Star New Chemical Materials, 2013H1
Revenue and Net Income of Blue Star New Chemical Materials, 2012-2013
Output of Epoxy Resin and Bisphenol A of Blue Star New Chemical Materials, 2011-2013
Revenue and Net Income of Blue Star New Chemical Materials, 2012-2016E
Main Products of Nan Ya Plastics
Revenue and Operating Profit of Nan Ya (Kunshan), 2008-2010
Revenue and Net Income of Nan Ya Plastics, 2008-2012
Revenue from Main Products and % of Total Revenue of Nan Ya Plastics, 2012
Procurement from Top 3 Suppliers and % of Total Procurement of Nan Ya Plastics, 2010-2012
Name List and Procurement of Top 3 Suppliers of Nan Ya Plastics , 2012
Epoxy Resin-related Products of Nan Ya Plastics
Epoxy Resin Revenue and % of Total Revenue of Nan Ya Plastics, 2008-2012
Epoxy Resin Output and Sales Volume of Nan Ya Plastics, 2008-2012
Epoxy Resin Self-consumption and External Sales Volume of Nan Ya Plastics, 2008-2012
Revenue and Net Income of Kingboard Laminates, 2008-2012
Revenue of Kingboard Laminates (by Product), 2010-2012
Revenue Structure of Kingboard Laminates (by Product), 2010-2012
Revenue of Kingboard Laminates (by Region), 2010-2012
Revenue Structure of Kingboard Laminates (by Region), 2010-2012
Main Products of Jiangsu Sanmu
Operating Revenue and Gross Profit of Jiangsu Sanmu, 2007-2009
Operating Revenue and Gross Profit of Dalian Qihua, 2007-2009
Operating Revenue and Gross Profit of Changchun Chemical (Jiangsu), 2007-2009
Operating Revenue and Gross Profit of Langfang NORSUN, 2007-2009
Operating Revenue and Gross Profit of Anhui Hengyuan Chemical, 2007-2009
Total Output and Revenue of Baling Petrochemical, 2011-2012
如果这份报告不能满足您的要求,我们还可以为您定制报告,请 留言说明您的详细需求。
|