|
|
|
报告导航:研究报告—
TMT产业—电子半导体
|
|
2013-2014年全球及中国晶圆代工行业研究报告 |
 |
字数:1.4万 |
页数:95 |
图表数:102 |
|
中文电子版:8000元 |
中文纸版:4000元 |
中文(电子+纸)版:8500元 |
|
英文电子版:2150美元 |
英文纸版:2300美元 |
英文(电子+纸)版:2450美元 |
|
编号:ZYW183
|
发布日期:2014-09 |
附件:下载 |
 |
|
|
《2013-2014年全球及中国晶圆代工行业研究报告》包含以下内容:
1、全球半导体概况
2、晶圆代工下游市场分析
3、晶圆代工产业分析
4、中国半导体产业分析
5、十三家晶圆代工厂研究
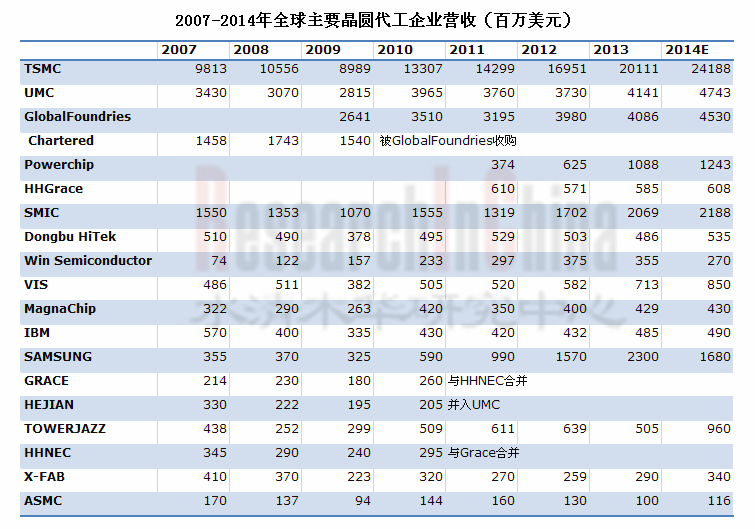
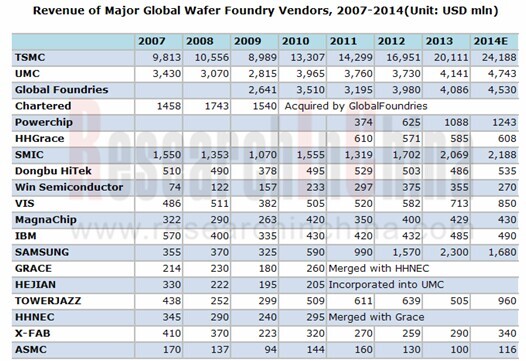
晶圆代工市场呈波浪形发展,自2009年下滑7.9%后2010年大涨39.4%,2011年涨幅萎缩到8.7%,2012年再大涨到21.7%。2013年涨幅减少到6.8%。预计2014年涨幅为15.6%,2015年为6.0%。晶圆代工市场的波动幅度开始越来越小。其主要原因是晶圆代工行业出现分化。
按产品类型,Foundry可以分为两大类,一类为Logic IC Foundry,一类为 specifically Foundry。前者以高量Logic IC为主要产品,包括CPU、GPU、Baseband、Application Processor、FPGA、APU、PLD、Networking Processor、Dtv MPU等。后者以模拟IC、混合信号、Power IC、NVM、RF/HPA、CIS、MEMS、DDI(Display Driver)为主。对前者来说,需要不断提高制造工艺,持续缩小线宽,这样不仅能提高性能,降低功耗,还能降低成本。这些产品更新换代的速度很快,产品生命周期通常不超过3年,Foundry需要持续不断地投入巨量资金研发下一代工艺。而对后者来说,其产品生命周期很长,模拟IC的生命周期一般都在5-10年以上,超过20年的也不罕见。这些产品缩小线宽往往无法降低成本,反而可能提高成本。specifically Foundry的收入规模较小,稳定但缺乏成长性,投入少回报高。Logic IC Foundry收入规模大,但波动也大。最重要的是Logic IC Foundry除非做到第一,否则很容易亏损。而第一名利润很丰厚。以TSMC为例,这家企业自1987年成立以来一直保持全球第一的位置,市场占有率从未低于50%。不仅如此,台积电也是全球利润最高的晶圆代工厂,毛利率从未低于40%,2014年毛利率逼近50%,超过苹果和高通。排名第二第三第四的企业都曾经多年亏损,以大陆最大的SMIC为例,2000-2011年的12年期间,只有2010年盈利,其余年份都亏损。全球排名第三的Global Foundries则是连续巨亏,2013年营业收入微幅增长,但营业亏损从22.17亿AED大增至32.17亿AED 。
按出身,Foundry可以分为两大类,一类为IDM兼职,一类为纯Foundry。前者有三星、英特尔、IBM。Global Foundries也勉强可以算IDM,因为其脱胎自AMD。这些厂家产品线很长,容易与客户造成竞争。并且IDM厂主业不是Foundry,只有产能过剩的时候才会做Foundry。除非特殊原因,这些IDM都不会是客户的首选,都是第二选择。
晶圆代工行业也不是有钱有技术就能做好的,IBM就是最佳例子,最近IBM愿意倒贴10亿美元出售晶圆代工业务给Global Fonudries。Global Fonudries却认为倒贴的太少,得倒贴20亿美元,因为这个每年不到5亿美元营收的业务让IBM每年亏损15亿美元左右。而除台积电外,大部分晶圆代工厂都或多或少买过IBM的技术,尤其是三星、STMicroelectronics、Global Fonudries,基本就是IBM扶植起来的。
三星、STMicroelectronics、Global Fonudries、IBM四家巨头多年来一直结盟对抗台积电,但是毫无成果,反倒台积电越来越强。三星努力多年,晶圆代工业务只有苹果一个客户,而2014年这个客户的主力产品A8的订单全部被台积电拿下,导致三星晶圆代工业务所属的SystemLSI部门多年来第一次出现亏损。
虽然三星的14纳米工艺貌似领先,但并未获得苹果的认可。究其原因,三星、STMicroelectronics、Global Fonudries、IBM四家都是IDM出身。而三星产品线漫长,几乎与世界上任何一家电子公司都是竞争对手。苹果此前不选择台积电是因为台积电的产能吃紧,而台积电产能陆续扩展,达到了苹果的要求后,苹果立刻从三星转向台积电。
台积电是纯晶圆代工厂,不像三星等IDM厂会与客户竞争,因此较能赢得订单。三星、STMicroelectronics、Global Fonudries、IBM和英特尔都只是客户的第二选择。
中国企业在半导体领域内的投资完全依赖政府,效率低下。2010年投资145亿的华力微电子,已经投产3年,但2013年营收还不足12亿人民币。SMIC主要客户包括展讯、RDA、海思、格科微电子、瑞芯微电子、全志科技、兆易创新、中电华大\复旦微电子\同方微电子\大唐微电子。后面几家企业主要依靠政府订单,是社保卡、身份证、SIM卡、银联卡、各种智能卡芯片的主要设计公司。因此中芯国际40%的收入来自低端的0.15/0.18微米工艺,而台积电65纳米以下的收入占其总收入的71%。
Global and China Wafer Foundry Industry Report, 2013-2014 is all about the followings:
1. Overview of Global Semiconductor Industry
2. Downstream Market of Wafer Foundry Industry
3. Wafer Foundry Industry
4. Semiconductor Industry in China
5. 13 Key Wafer Foundry Vendors
The wafer foundry market experienced a wavy development, jumping by 39.4% in 2010 following a 7.9% decline in 2009. And the growth rate first shrank to 8.7% in 2011, then expanded to 21.7% in 2012, and fell back to 6.8% in 2013. It is projected that the growth rate will stand at 15.6% in 2014 and 6.0% in 2015. The fluctuation in the wafer foundry market will begin to present an increasingly small growth rate, which is mainly because of the differentiation in wafer foundry industry.
In terms of product type, foundry can be divided into two categories: Logic IC Foundry and specifically Foundry. The former is mainly comprised of high-shipment Logic IC, including CPU, GPU, Baseband, Application Processor, FPGA, APU, PLD, Networking Processor, and DTV MPU, etc. And the latter primarily consists of analog IC, mixed signals, Power IC, NVM, RF/HPA, CIS, MEMS, DDI (Display Driver). For the former, it is necessary to continuously improve manufacturing process and constantly narrow the line width, which could not only improve performance and reduce power consumption, but also reduce costs. These products update quickly, with the life cycle typically no more than three years, which requires a massive fund for developing next-generation technologies. As for the latter, however, its products have a long life cycle, with the life cycle for analog IC generally exceeding 5-10 years. And even a more than 20-year life cycle is not rare. These products can narrow line width but fail to reduce costs, and could increase costs instead. The specifically Foundry has a small market size and stable sales volume, but with low costs and high returns. In contrast, Logic IC Foundry has a large market size, but with a considerable fluctuation. Most important, only the leading player in the Logic IC Foundry industry can make profit, otherwise it is easy to make a loss. Take TSMC for example, which has taken the lead in the global market since its establishment in 1987, with its market share never less than 50%. Besides, TSMC is also the wafer foundry vendor that earns the highest profit around the globe, with the gross margin never lower than 40% even close to 50% in 2014 (exceeding Apple and Qualcomm). The No.2, No.3 and No. 4 players have ever suffered losses for many years, with SMIC, for example, making profit only in 2010 during the 12 years from 2000 to 2011. And the third player, Global Foundries, has suffered losses for years, with the revenue in 2013 showing a slight growth but the operating loss expanding from AED2.217 billion to AED3.217 billion.
According to the nature of the vendors, the foundry businesses can be divided into two segments, namely, IDMs offering their excess capacity to third parties and pure-play (or dedicated) foundries, with the former including Samsung, Intel, and IBM. Global Foundries can be barely included in IDMs, for it originated from AMD. These vendors have long product lines, which makes it possible to cause competition with their customers. And IDMs, in reality, are not involved in foundry businesses and could conduct foundry business only when they have excess capacity. These IDMs will not become the first choice of the customers unless special reasons.
Money and technology do not always help do well in wafer foundry industry, which has been best illustrated by IBM. Recently, IBM was willing to pay USD1 billion for the sale of its wafer foundry business to Global Foundries. And Global Foundries suggested that the payment was very small and should be expanded to USD2 billion due to the fact that the business, which generates revenue of less than USD500 million annually, caused IBM to suffer approximately USD1.5 billion loss a year. Except TSMC, most foundries have more or less bought IBM's technology, especially Samsung, STMicroelectronics, and Global Foundries, which are all technologically brought up by IBM.
Over the years, the four giants—Samsung, STMicroelectronics, Global Foundries, and IBM have formed an alliance in a vain attempt to compete against TSMC. Instead, TSMC has grown stronger and stronger. After years of efforts, Samsung has won a client in wafer foundry business—Apple. Unfortunately, the order of Apple’s main products A8 was gained by TSMC in 2014, thus leading to the first loss of Samsung System LSI Division over the years.
Although Samsung’s 14nm technology seems to take the lead, this is not approved by Apple. This is mainly because the four companies—Samsung, STMicroelectronics, Global Foundries, and IBM all developed from IDM. And Samsung has a long product line and therefore could compete with any electronic company in the world. Previously, Apple did not choose TSMC because the company suffered capacity constraints, and as TSMC’s capacity was expanded and met Apple’s requirements, Apple lost no time in making a shift from Samsung to TSMC.
Unlike IDMs such as Samsung, TSMC is pure-play foundry and will not compete with clients, which makes it easier for the company to get orders. And Samsung, STMicroelectronics, Global Foundries, IBM and Intel are the second choices for the clients.
The investment of Chinese enterprises in the field of semiconductors is totally dependent on the government, resulting in a lower efficiency. In 2010, Shanghai Huali Microelectronics Corporation was established with an investment of RMB14.5 billion. Although it had been into operation for 3 years, the company's revenue was less than RMB1.2 billion in 2013. SMIC’s major clients include Spreadtrum, RDA, Hisilicon, GalaxyCore Inc., Rockchip, Allwinner Technology, GigaDevice, HED, Fudan Microelectronics, TMC, and DMT. The last few enterprises, which are mainly relied on the government orders, are the major design houses of chips for a variety of smart cards, including social security cards, ID cards, SIM cards, Union Pay cards. Therefore, 40% of SMIC’s revenue came from the low-end 0.15/0.18µm technology while TSMC’s revenue from lower than 65 nm technology accounted for 71% of the total.
第一章、全球半导体产业
1.1、半导体市场概况
1.2、半导体产业供应链
1.3、 半导体产业概况
1.4、半导体产业支出趋势
第二章、FOUNDRY下游市场
2.1、手机市场
2.2、手机产业
2.3、PC市场
2.4、平板电脑市场
2.5、BASEBAND与AP产业
第三章、FOUNDRY产业分析
3.1、晶圆代工产业规模
3.2、晶圆代工行业竞争分析
3.3、晶圆代工产业排名
3.4、FOUNDRY发展趋势
3.5、中国半导体产业概况
3.6、中国半导体市场概况
3.7、中国半导体市场排名
3.8、中国晶圆代工产业发展趋势
第四章、FOUNDRY厂家研究
4.1、TSMC
4.2、UMC
4.3、SMIC
4.4、VIS
4.5、POWERCHIP
4.6、HHGRACE
4.7、DONGBU HITEK
4.8、TOWER
4.9、X-FAB
4.10、ASMC
4.11、三星
4.12、MAGNACHIP
4.13、GLOBALFOUNDRIES
1 Global Semiconductor Industry
1.1 Overview of Semiconductor Market
1.2 Semiconductor Industry Suppy Chain
1.3 Overview of Semiconductor Industry
1.4 Semiconductor Industry Expenditure Trend
2 Foundry Downstream Market
2.1 Mobile Phone Market
2.2 Mobile Phone Industry
2.3 PC Market
2.4 Tablet PC Market
2.5 Baseband IC and AP industries
3 Foundry Industry
3.1 Industry Size
3.2 Industry Competition
3.3 Industry Ranking
3.4 Foundry Development Trends
3.5 Overview of Semiconductor Industry in China
3.6 Overview of Semiconductor Market in China
3.7 Ranking of China’s Semiconductor Market
3.8 Wafer Foundry Trends in China
4 Foundry Vendors
4.1 TSMC
4.2 UMC
4.3 SMIC
4.4 VIS
4.5 POWERCHIP
4.6 HHGRACE
4.7 DONGBU HITEK
4.8 TOWER
4.9 X-FAB
4.10 ASMC
4.11 SAMSUNG
4.12MAGNACHIP
4.13 GLOBALFOUNDRIES
1990-2014 Semiconductor Industry Growth versus Worldwide GDP Growth
2012-2014年全球半导体产业季度收入
2012-2017年全球半导体市场产品分布
2012-2017年各种半导体产品市场规模增幅
Semiconductor Outsourced Supply Chain
Semiconductor Company Systems
Semiconductor Outsourced Supply Chain Example
1Q14 Top25 Semiconductor Sales Leaders
1990-2013 Worldwide IC Sales by Company Headquarters Location
2013 Fabless IC Sales Marketshare by Company Headquarters Location(77.9B)
2008-2013 Top 10 IC Manufacturers in China
2011-2014F Top 10 Spenders Capital Spending Outlook
1994-2013 Top 5 Share of Total Semiconductor Capital Spending
1Q14-WW-Semiconductor-CapitalSpending-Share-of-FullZYear-Budget
2008-2016年平均每部手机IC成本
2007-2015年全球手机出货量
Worldwide Mobile Phone Sales to End Users by Vendor in 2006- 2013 (Thousands of Units)
Worldwide Smartphone Sales to End Users by Vendor in 2006- 2013 (Thousands of Units)
Worldwide Smartphone Sales to End Users by Operating System in 2013 (Thousands of Units)
2013年1季度-2014年1季度主要手机厂家出货量
2008-2015年全球PC用CPU与Discrete GPU 出货量
2008-2015年笔记本电脑出货量
2010-2013年全球主要笔记本电脑ODM厂家出货量
2011-2016年全球平板电脑出货量
2013年平板电脑主要品牌市场占有率
2012、2013年全球平板电脑制造厂家产量
2014年Baseband主要厂家市场占有率(By Revenues)
2014年AP主要厂家市场占有率(By Revenues)
2014年Baseband主要厂家市场占有率(By Units)
2008-2015年全球Foundry市场规模
2012-2017 Foundry Revenue of Advanced Nodes
2012-2018 Global Foundry capacity by node
2012-2018 Global Foundry revenue by node
2005-2014 Global ranking by foundry
2003-2014年中国半导体市场规模
2008-2014年中国主要电子产品产量
Top 10 Semiconductor suppliers to the Chinese market 2012–2013
2013年中国半导体制造企业收入排名
2013年中国10大IC设计公司销售排名
TSMC 组织结构
2005-2014 年TSMC收入、毛利率、营业利润率
2004-2013年TSMC Wafers Shipments and utilization
2009-2013年TSMC Market Capitalization
2009-2013年TSMC Assets 和Shareholders Equity
2009-2014 TSMC R&D Expenses
2009-2014 TSMC Capital Investment
2012Q1-2014Q2 TSMC Quarterly Revenues 、gross profit、operation income、net income
2012Q1-2014Q2 TSMC Quarterly Revenues and Wafers Shipments
2012Q1-2014Q2 TSMC Quarterly Revenues by Node
2012Q1-2014Q2 TSMC Quarterly Revenues by Application
2012Q1-2014Q2 TSMC Quarterly Revenues by Region
2013Q1-2014Q4 TSMC Quarterly Wafer Shipments and ASP
2013Q1-2014Q4 TSMC Quarterly Wafer Shipments and utilization
TSMC Fab List
TSMC上海厂2013年财务数据
2004-2014 UMC 收入与营业利润率
2004-2013 UMC出货量与产能利用率
2012Q3-2014Q2 UMC Quarterly Revenues 、Gross Margin
2012Q3-2014Q2 UMC Quarterly Revenues by Node
2012Q3-2014Q2 UMC Quarterly Revenues by Region
2012Q3-2014Q2 UMC Quarterly Revenues by Application
2006Q1-2014Q2 UMC Quarterly Capacity
UMC operating revenues in 2012 and 2013 by the location of customers.
2003-2014年SMIC收入与营业利润率
2008-2014年SMIC Capacity
2008-2014年SMIC毛利率
2009Q1-2014Q1 SMIC Quarterly Gross Margin
2009Q1-2014Q1 SMIC Quarterly Net Margin
2010-2013年SMIC收入地域分布
2013Q2-2014Q2 SMIC Quarterly Revenue Breakdown by Geography
2010-2013年SMIC收入应用分布
2013Q2-2014Q2 SMIC Quarterly Revenue Breakdown by Application
2010-2013 SMIC Revenue Breakdown by Node
2013Q2-2014Q2 SMIC Quarterly Revenue Breakdown by Node
2013Q2-2014Q2 SMIC Quarterly Capacity
2009Q1-2014Q1 SMIC Quarterly Utilization(%)
ORGANIZATION OF VIS
2005-2014年VIS收入与营业利润率
1Q12-2Q14 VIS Quarterly Revenue And Gross Margin
1Q12-2Q14 VIS Quarterly Revenue And UTILRate
1Q12-2Q14 VIS Quarterly Revenue Breakdown by Node
1Q12-2Q14 VIS Quarterly Revenue Breakdown by Application
1Q12-2Q14 VIS Quarterly Revenue Breakdown by Product
Powerchip组织结构
2012年7月-2014年7月Powerchip月度收入
2011-2013年华虹宏力收入、毛利、营业利润
2011-2014年华虹集团收入、净利润、资产负债率
2011-2013华虹宏力Revenue Breakdown by Product
2011-2013华虹宏力Revenue Breakdown by Node
2011-2013华虹宏力产能利用率
2011-2013华虹宏力Revenue Breakdown by Clients
2011-2013华虹宏力Revenue Breakdown by Region
2011-2013华虹宏力Revenue Breakdown by Application
2005-2014年Dongbu HiTek收入与营业利润率
Dongbu Hitek晶圆厂简介
2003-2014 TowerSemi收入与毛利率
Tower Semiconductor Shareholders Structure
2003-2014年上海先进半导体收入与毛利率
2013年2季度-2014年2季度ASMC收入应用分布
2013年2季度-2014年2季度ASMC收入地域分布
2013年2季度-2014年2季度ASMC收入客户分布
2013年2季度-2014年2季度ASMC收入by Fab
2013年2季度-2014年2季度ASMC UTILRate(%)
2009-2015年三星SystemLSI事业部收入与营业利润率
2005-2014年MagnaChip收入与毛利率
2005-2014年MagnaChip收入与营业利润率
2004-2013年MagnaChip收入产品分布
2004-2013年MagnaChip收入地域分布
MAGNACHIP 各晶圆厂一览
2012/2013年GlobalFoundries财务数据
GlobalFoundries Milestone
GlobalFoundries Global Footprints
GLOBALFOUNDRIES Corporate Headquarters
Semiconductor Industry Growth versus Worldwide GDP Growth, 1990-2014
Quarterly Revenue of Global Semiconductor Industry, 2012-2014
Global Semiconductor Market Breakdown by Product, 2012-2017E
Market Size Growth of Various Semiconductor Products, 2012-2017E
Semiconductor Outsourced Supply Chain
Semiconductor Company Systems
Semiconductor Outsourced Supply Chain Example
Top 25 Semiconductor Sales Leaders, 1Q2014
Worldwide IC Sales by Company Headquarters Location, 1990-2013
Fabless IC Sales Market Share by Company Headquarters Location, 2013
Top 10 IC Vendors in China, 2008-2013
Top 10 Spenders Capital Spending Outlook, 2011-2014F
Top 5 Share of Total Semiconductor Capital Spending, 1994-2013
Proportion of Global Semiconductor Capital Spending in Full-Year Budget, 1Q2014
Average IC Costs Per Mobile Phone, 2008-2016E
Global Mobile Phone Shipments, 2007-2015E
Worldwide Mobile Phone Sales to End Users by Vendor, 2006- 2013
Worldwide Smartphone Sales to End Users by Vendor, 2006-2013
Worldwide Smartphone Sales to End Users by Operating System, 2013
Shipments of Major Mobile Phone Vendors, 1Q2013-1Q2014
Shipments of Global CPU and Discrete GPU for PCs, 2008-2015E
Notebook PCs Shipments, 2008-2015E
Shipments of Major Global Notebook PC ODM Vendors, 2010-2013
Global Tablet PCs Shipments, 2011-2016E
Market Share of Major Tablet PC Brands, 2013
Output of Global Tablet PC Vendors, 2012-2013
Market Share of Major Baseband Companies by Revenue, 2014
Market Share of Major AP Companies by Revenue, 2014
Market Share of Major Baseband Companies by Unit, 2014
Market Size of Global Foundry, 2008-2015E
Foundry Revenue of Advanced Node, 2012-2017E
Global Foundry Capacity by Node, 2012-2018E
Global Foundry Revenue by Node, 2012-2018E
Global Ranking by Foundry, 2005-2014
Semiconductor Market Size in China, 2003-2014
Output of Main Electronic Products in China, 2008-2014
Top 10 Semiconductor Suppliers to the Chinese market, 2012–2013
Ranking of Semiconductor Companies in China, 2013
Ranking of Top 10 IC Design Houses in China by Sales, 2013
Organization Structure of TSMC
Revenue, Gross Margin and Operating Margin of TSMC, 2005-2014
TSMC’s Wafers Shipments and Utilization, 2004-2013
TSMC’s Market Capitalization, 2009-2013
TSMC’s Assets and Shareholders’ Equity, 2009-2013
TSMC’s R&D Expenses, 2009-2014
TSMC’s Capital Investment, 2009-2014
TSMC’s Quarterly Revenues, Gross Profit, Operation Income and Net Income, 2012Q1-2014Q2
TSMC’s Quarterly Revenues and Wafers Shipments, 2012Q1-2014Q2
TSMC’s Quarterly Revenues by Node, 2012Q1-2014Q2
TSMC’s Quarterly Revenues by Application, 2012Q1-2014Q2
TSMC’s Quarterly Revenues by Region, 2012Q1-2014Q2
TSMC’s Quarterly Wafer Shipments and ASP, 2013Q1-2014Q4
TSMC’s Quarterly Wafer Shipments and Utilization, 2013Q1-2014Q4
TSMC’s Fab List
Financial Figures of TSMC's Shanghai Factory, 2013
UMC’s Revenue and Operating Margin, 2004-2014
UMC’s Shipments and Capacity Utilization, 2004-2013
UMC’s Quarterly Revenue and Gross Margin, 2012Q3-2014Q2
UMC’s Quarterly Revenue by Node, 2012Q3-2014Q2
UMC’s Quarterly Revenue by Region, 2012Q3-2014Q2
UMC’s Quarterly Revenue by Application, 2012Q3-2014Q2
UMC’s Quarterly Capacity, 2006Q1-2014Q2
UMC’s Operating Revenue by Client Location, 2012-2013
Revenue and Operating Margin of SMIC, 2003-2014
SMIC’s Capacity, 2008-2014
SMIC’s Gross Margin, 2008-2014
SMIC Quarterly Gross Margin, 2009Q1-2014Q1
SMIC’s Quarterly Net Margin, 2009Q1-2014Q1
Revenue Breakdown of SMIC by Region, 2010-2013
SMIC’s Quarterly Revenue Breakdown by Geography, 2013Q2-2014Q2
Revenue Breakdown of SMIC by Application, 2010-2013
SMIC’s Quarterly Revenue Breakdown by Application, 2013Q2-2014Q2
SMIC’s Revenue Breakdown by Node, 2010-2013
SMIC’s Quarterly Revenue Breakdown by Node, 2013Q2-2014Q2
SMIC’s Quarterly Capacity, 2013Q2-2014Q2
SMIC’s Quarterly Utilization (%), 2009Q1-2014Q1
ORGANIZATION OF VIS
VIS’s Revenue and Operating Margin, 2005-2014
VIS’S Quarterly Revenue and Gross Margin1, 1Q2012-2Q2014
VIS’S Quarterly Revenue and UTIL Rate, 1Q2012-2Q2014
VIS’S Quarterly Revenue Breakdown by Node, 1Q2012-2Q2014
VIS’S Quarterly Revenue Breakdown by Application, 1Q2012-2Q2014
VIS’S Quarterly Revenue Breakdown by Product, 1Q2012-2Q2014
Organization Structure of Powerchip
Monthly Revenue of Powerchip, 7/2012-7/2014
Revenue, Gross Profit, and Operating Income of HHGRACE, 2011-2013
Revenue, Net Income, Asset-liability Ratio of HHGRACE, 2011-2014
Revenue Breakdown of HHGRACE by Product, 2011-2013
Revenue Breakdown of HHGRACE by Node, 2011-2013
Capacity Utilization of HHGRACE, 2011-2013
Revenue Breakdown of HHGRACE by Client, 2011-2013
Revenue Breakdown of HHGRACE by Region, 2011-2013
Revenue Breakdown of HHGRACE by Application, 2011-2013
Revenue and Operating Margin of Dongbu HiTek, 2005-2014
Profile of Dongbu Hitek
Revenue and Gross Margin of TowerSemi, 2003-2014
Tower Semiconductor Shareholders Structure
Revenue and Gross Margin of ASMC, 2003-2014
ASMC’s Revenue Breakdown by Applications, 2Q13-2Q14
ASMC’s Revenue Breakdown by Region, 2Q13-2Q14
ASMC’s Revenue Breakdown by Client, 2Q13-2Q14
ASMC’s Revenue by Fab, 2Q13-2Q14
ASMC’s UTIL Rate (%), 2Q13-2Q14
Revenue and Operating Margin of Samsung’s System LSI Division, 2009-2015
MagnaChip’s Revenue and Gross Margin, 2005-2014
MagnaChip’s Revenue and Operating Margin, 2005-2014
MagnaChip’s Revenue Breakdown by Product, 2004-2013
MagnaChip’s Revenue Breakdown by Region, 2004-2013
Wafer Fabs of MAGNACHIP
Financial Figures for Global Foundries, 2012/2013
Global Foundries Milestone
Global Foundries Global Footprints
GLOBALFOUNDRIES Corporate Headquarters
如果这份报告不能满足您的要求,我们还可以为您定制报告,请 留言说明您的详细需求。
|