|
|
|
报告导航:研究报告—
TMT产业—电子半导体
|
|
2009年全球及中国被动元件行业研究报告 |
 |
字数:3.6万 |
页数:128 |
图表数:80 |
|
中文电子版:6500元 |
中文纸版:3250元 |
中文(电子+纸)版:7000元 |
|
英文电子版:2200美元 |
英文纸版:2000美元 |
英文(电子+纸)版:2500美元 |
|
编号:ZYW027
|
发布日期:2010-03 |
附件:下载 |
 |
|
|
被动元件包括电阻、电容、电感、线圈和磁性元件。严格意义上讲,晶振也是被动元件的一种,但通常都由专业厂家生产,就不纳入本报告的研究范围。不包括晶振,2009年被动元件产业产值大约220亿美元,其中电容所占比例最高,大约为60%。模块产品占大约20%。模块产品特别是LTCC模块产品,通常都是由被动元件厂家生产,其虽然不是严格意义上的被动元件,但蓝牙模块、GPS模块和手机Wi-Fi模块98%以上都是被动元件厂家生产的,因此划归被动元件领域。电容则以MLCC和铝电解电容为主,占电容产值的60%以上。电感的定制化程度高,通常不是标准产品,因此给了许多小企业生产空间。除此之外,行业的集中度很高。
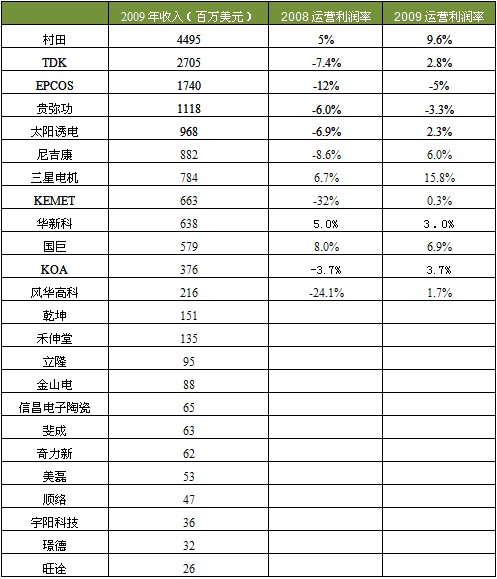
任何电子产品都要使用被动元件,被动元件决定了电子产品的品质稳定度。日本企业占据了被动元件产业60%以上的产值,技术也是出于领先地位。欧美厂家则多以工业产品为主。台湾厂家的技术来源通常是日本厂家,以替代性应用为主。在技术含量低的电阻领域,台湾厂家占据绝对优势,但第一大电阻厂家仍然是日本企业。三星电机则依靠大幅度杀价来获得市场。
被动元件企业提前感受到电子产业的低谷,在2008年6月起,被动元件企业就开始面临订单下滑的局面,3季度被动元件产业遭遇寒流,大部分被动元件企业利润大幅度下滑。不过在大幅度计提和削价后,被动元件企业在2009年轻装上阵,利润大幅度增加。
日本企业保守,不愿意扩产,在2008年经济下滑期,日本企业一定幅度减产。而电子产业快速复苏时,日本企业的产能却无法快速对应增加,因此供需紧张,被动元件在2009年3季度一度面临缺货,不过预计到2010年3季度就会出现平衡。
25家被动元件厂家排名
Passive component consists of resistor, capacitor, inductor, coils and magnetic components. Strictly speaking, crystal oscillator also can be regarded as a kind of passive component. The difference is that crystal oscillator is usually produced by professional manufacturers, so it will not be included in this report. Excluding crystal oscillator, the output value of passive components in 2009 approximated US$22 billion, of which capacitor occupied around 60%, the highest rate. And the output value of module products in 2009 took a 20% share. Module products, in particular the LTCC module products, are usually produced by passive component manufacturers. In spite of module products being not the passive component in the strict sense, the production of over 98% module products like Bluetooth module, GPS module and Mobile Wi-Fi module is undertaken by passive component manufacturers, hence, they are classified into passive components. MLCC capacitor and Aluminum capacitor totally takes the lion’s share, surpassing 60% of the total value. When it comes to inductance, no standard products are available because of the high-degree customized level. This provides small enterprises with the opportunities to produce inductors.
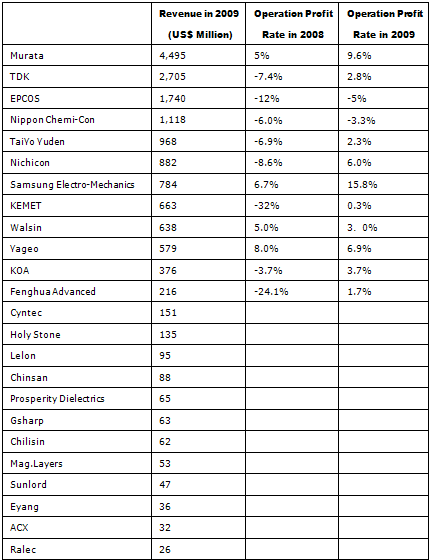
Being indispensable to any electronics, passive components determine the quality of electronic products. More than 60% output value of passive components industry is generated by Japanese enterprises, which also take the lead in terms of technology. While the European and American manufacturers are primarily engaged in industrial products. Alternative application dominates Taiwanese manufacturers, whose technologies are sourced from Japanese enterprises. Although Taiwanese manufacturers play a dominant part in resistance sector with low technical content, the Japanese enterprise still remains to rank No.1. Samsung Electro-Mechanics seizes market shares by price slash.
Enterprises engaging in passive components suffered in advance the trough of the electronic industry. Since June 2008, the orders of passive component enterprises have slumped. In the third quarter of 2008 saw the sharpest falls in profit for a majority of passive component enterprises. However, after the sharp price reduction and accrued loss from devaluation of passive component products, the profit of manufacturers grows considerably.
Yet, most Japanese passive component enterprises didn’t intend to expand their production. During the period of economic turndown in 2008, Japanese companies cut their production to some extent. Furthermore, they could not increase the output capacity accordingly when the electronic industry was rapidly warming up. This resulted in short support of passive components in the third quarter of 2009. However, it is expected to regain balance by the third quarter of 2010.
Ranking list of 25 Passive Component Manufacturing
第一章、被动元件简介
1.1、MLCC简介
1.2、LTCC
1.3、铝质电解电容与固态电容
1.4、贴片电感(SMD电感)
第二章、被动元件下游市场
2.1、全球PC市场规模
2.2、中国笔记本电脑市场规模
2.3、全球手机市场
2.4、蓝芽 (BLUETOOTH)
2.5、WI-FI市场
第三章、被动元件产业
3.1、被动元件产业规模
3.2、电容
3.3、电阻
3.4、MLCC
3.5、被动元件厂家对比
第四章、主要被动元件厂家研究
4.1、贵弥功
4.2、尼吉康
4.3、立隆电子
4.4、金山电
4.5、KEMET
4.6、美磊
4.7、璟德
4.8、信昌电子陶瓷
4.9、风华高科
4.10、宇阳科技
4.11、奇力新
4.12、禾伸堂
4.13、太阳诱电
4.14、京瓷
4.15、国巨
4.16、大毅科技
4.17、旺诠
4.18、乾坤
4.19、KOA
4.20、华新科
4.21、斐成
4.22、蜜望实
4.23、三星电机
4.24、村田
4.25、TDK
4.26、顺络电子
1. Profile of Passive Components
1.1 MLCC
1.2 LTCC
1.3 Aluminum Electrolytic Capacitor & CPAE Capacitor
1.4 Chip Inductors (SMD Inductors)
2. Downstream Market of Passive Components
2.1 PC Market Scale in the World
2.2 Notebook Market Scale in China
2.3 Global Mobile Phone Market
2.4 Bluetooth
2.5 Wi-Fi Market
3. Passive Component Industry
3.1 Industry Scale
3.2 Capacitance
3.3 Resistance
3.4 MLCC
3.5 Comparison between Passive Component Manufacturers
4. Passive Component Manufacturers
4.1 Nippon Chemi-Con
4.2 Nichicon
4.3 Lelon
4.4 Chinsan
4.5 KEMET
4.6 Mag.Layers
4.7 ACX Corp.
4.8 Prosperity Dielectrics
4.9 Fenghua Advanced
4.10 Eyang
4.11 Chilisin
4.12 Holy Stone
4.13 TaiYo Yuden
4.14 Kyocera
4.15 Yageo
4.16 TA-I
4.17 Ralec
4.18 Cyntec
4.19 KOA
4.20 Walsin
4.21 Gsharp
4.22 Honey Hope Honesty
4.23 Samsung Electro-Mechanics
4.24 Murata
4.25 TDK
4.26 Sunlord
2007-2012年全球手机出货量
2007年1季度-2009年4季度全球手机出货量
2007年1季度-2009年4季度全球手机出货量地域分布
2007年1季度-2009年4季度全球手机出货量技术分布
2009年前3季度全球主要手机厂家出货量
2009年全球被动元件产值分布
2009年全球被动元件产值地域分布
2006-2011年全球电容出货量技术类型分布
2006-2011年全球电容产值技术类型分布
2009年非MLCC电容市场主要厂家市场占有率(按金额)
2009年全球电阻厂家市场占有率(按出货量)
2009年全球电阻厂家市场占有率(按金额)
2009年全球MLCC市场主要厂家市场占有率(按金额)
2009年全球MLCC市场主要厂家市场占有率(按出货量)
2008年RF元件主要厂家市场占有率(按出货量)
2005-2009财年贵弥功收入与运营利润率
2008、2009财年贵弥功收入地域分布
2008、2009财年贵弥功收入产品分布
2008、2009财年贵弥功收入产品下游分布分布
2004-2009财年尼吉康收入与运营利润率
2004-2008财年尼吉康收入产品分布
2004-2008财年尼吉康收入地域分布
2004-2010年立隆电子收入与毛利率
2007-2009年立隆电子每月收入
2006年2季度-2009年4季度立隆电子收入与毛利率
2006年2季度-2009年4季度立隆电子负债比例与存货周转天数
2005-2010年金山电收入与毛利率
2005-2010财年KEMET收入与运营利润
2009财年3季度-2010财年3季度KEMET收入与运营利润
2009财年3季度-2010财年2季度KEMET收入产品下游分布
2008、2009财年KEMET各项支出
2007-2009年美磊每月收入
2006年2季度-2009年4季度美磊季度收入与毛利率
2006年2季度-2009年4季度美磊季度负债比率与存货周转天数
2002-2010年璟德电子收入与净利润
2002-2009年3季度璟德电子毛利率和净利率
2009年前3季度璟德电子收入产品分布
2009年前3季度璟德电子收入下游应用分布
2009年前3季度璟德电子收入地域分布
信昌电2004-2009年收入与运营利润
2003-2009年风华高科收入与运营利润率
2008年风华高科各项产品收入、运营利润
2002-2010年奇力新收入与毛利率
2006、2008、2009年奇力新收入产品下游分布
2006、2009年奇力新收入产品分布
2003-2010年禾伸堂收入与毛利率
2006、2009年禾伸堂收入产品分布
2002-2009财年太阳诱电收入与运营利润率
2006、2009财年太阳诱电收入产品分布
2008、2009财年京瓷收入部门分布
2001-2008年上海京瓷收入
2007年1月-2009年12月国巨单月收入统计
2003-2010年国巨收入与毛利率
2006年2季度-2009年4季度国巨每季度收入与毛利率
2006年2季度-2009年4季度国巨每季度负债比率与存货周转天数
2004-2009年国巨收入地域分布
2008年国巨中国主要子公司财务状况
2001-2009年大毅收入与毛利率
2000-2009年旺诠收入与毛利率
2003-2009年乾坤收入与毛利率
2005-2009财年KOA收入与运营利润
2005-2008财年KOA收入产品分布
2005-2008财年KOA收入地域分布
华新咳集团结构
2009年前3季度华新科收入下游应用分布
2009年前3季度华新科收入地域分布
2009年前3季度华新科收入产品分布
华新科全球制造基地分布
2007-2010年裴成收入与毛利率
2008年1季度-2009年4季度三星电机MLCC收入
2008年1季度-2009年4季度三星电机被动元件部门收入与运营利润率
2008财年1季度-2009财年3季度村田收入与运营利润率
2005-2010财年村田收入与运营利润率
2008财年1季度-2009财年3季度村田收入产品结构
2007财年-2009财年3季度村田收入产品结构
2008财年1季度-2009财年3季度村田收入产品下游应用结构
2007财年-2009财年3季度村田收入产品下游应用结构
2004-2009财年TDK收入与运营利润
2007财年3季度-2009财年3季度TDK收入与运营利润率
2007财年3季度-2009财年3季度TDK收入产品分布
2008财年3季度-2009财年3季度EPCOS收入与运营利润率
World's Mobile Phone Shipment, 2007-2012
World's Mobile Phone Shipment, Q1, 2007-Q4, 2009
World's Mobile Phone Shipment by Region, Q1, 2007-Q4, 2009
World's Mobile Phone Shipment by Technology, Q1, 2007-Q4, 09
Mobile Phone Shipment of World's Major Manufacturers, Q1-Q3, 2009
Global Distribution of Passive Components by Output Value, 2009
Output Value Distribution of Passive Components by Region, 2009
Technical Type Distribution of Global Capacitor Shipment, 2006-2011
Technical Type Distribution of Global Capacitor Output Value, 2006-2011
Market Share of Major Non-MLCC Capacitor Manufacturers, 2009 (By Value)
Market Share of Global Resistance Manufacturers, 2009 (By Shipment)
Market Share of Global Resistance Manufacturers, 2009 (By Value)
Market Share of Major MLCC Manufacturers, 2009 (By Value)
Market Share of Major MLCC Manufacturers, 2009 (By Shipment)
Market Share of Major RF Component Manufacturers, 2008 (By Shipment)
Revenue and Operating Profit Margin of Nippon Chemi-Con, FY2005-FY2009
Revenue Distribution of Nippon Chemi-Con by Region, FY 2008 vs. FY 2009
Revenue of Nippon Chemi-Con by Product, FY2008 vs. FY 2009
Revenue of Nippon Chemi-Con by Application, FY 2008/FY 2009
Revenue and Operating Profit Margin of Nichicon, FY2004-FY2009
Revenue Distribution of Nichicon by Product, FY2004-FY2008
Revenue Distribution of Nichicon by Region, FY2004-FY2008
Revenue and Gross Profit Margin of Lelon, 2004-2010
Monthly Revenue of Lelon, 2007-2009
Revenue and Gross Profit Margin of Leon, Q2, 2006-Q4, 2009
Debt Ratio and Days Sales of Inventory of Lelon, Q2, 2006-Q4, 2009
Revenue and Gross Profit Margin of Chinsan, 2005-2010
Revenue and Operating Profit of KEMET, FY2005-FY2010
Revenue and Operating Profit of KEMET, Q3, FY2009-Q3, FY2010
Revenue of KEMET by Application, Q3, FY 09-Q2, FY2010
Expenditure of KEMET, FY08 vs. FY09
Monthly Revenue of Mag.Layers, 2007-2009
Quarterly Revenue and Gross Profit Margin of Mag.Layers, Q2, 2006-Q4, 2009
Debt Ratio and Days Sales of Inventory of Mag.Layers, Q2, 2006-Q4, 2009
Revenue and Net Profit of ACX, 2002-2010
Gross Profit Margin and Net Profit Margin of ACX, Q3, 2002-Q3, 2009
Revenue of ACX by Product, the First 3 Quarters of 2009
Revenue of ACX by Application, the First 3 Quarters of 2009
ACX Revenue by Region, the First 3 Quarters of 2009
Revenue and Operating Profit of Prosperity Dielectrics, 2004-2009
Revenue and Operating Profit of Fenghua Advanced Technology, 2003-2009
Revenue and Operating Profit by Product of Fenghua Advanced Technology, 2008
Revenue and Gross Profit Margin of Chilisin, 2002-2010
Revenue of Chilisin by Application, 2006/2008/2009
Revenue of Chilisin by Product, 2006 vs. 2009
Revenue and Gross Profit Margin of Holy Stone, 2003-2010
Revenue of Holy Stone by Product, 2006 vs. 2009
Revenue and Operating Profit Margin of TaiYo Yuden, FY2002-FY2009
Revenue of TaiYo Yuden by Product, FY 2006 vs. FY 2009
Revenue of Kyocera by Dept., FY 2008 vs. FY 2009
Revenue of Shanghai Kyocera, 2001-2008
Monthly Revenue of Yageo, Jan., 2007-Dec., 2009
Revenue and Gross Profit Margin of Yageo, 2003-2010
Quarterly Revenue and Gross Profit Margin of Yageo, Q2 2003-Q4 2010
Debt Ratio and Days Sales of Inventory of Yageo, Q2, 2006-Q4, 2009
Revenue of Yageo by Region, 2004-2009
Finance of Major Subsidiaries Under Yageo , 2008
Revenue and Gross Profit Margin of TA-I, 2000-2009
Revenue and Gross Profit Margin of Ralec, 2000-2009
Revenue and Gross Profit Margin of Cyntec, 2000-2009
Revenue and Operating Profit of KOA, FY2005-FY 2009
Revenue of KOA by Product, FY2005-FY2008
Revenue of KOA by Region, 2005-2008
Walsin Structure
Revenue of Walsin by Application, the First 3 Quarters of 2009
Revenue of Walsin by Region, the First 3 Quarters of 2009
Revenue of Walsin by Product, the First 3 Quarters of 2009
Walsin Production Bases Worldwide
Revenue and Gross Profit Margin of Gsharp, 2007-2010
MLCC Revenue of Samsung Electro-Mechanics, Q1, 2008-Q4, 2009
Revenue and Operating Profit of Passive Component Department of Samsung Electro-Mechanics, Q1, 2008-Q4, 2009
Revenue and Operating Profit Margin of Murata, Q1, FY 2008-Q3, FY 2009
Revenue and Operating Profit Margin of Murata, FY2005-FY2010
Revenue Structure of Murata by Product, Q1, FY 2008-Q3, FY 2009
Revenue Structure of Murata by Product, FY Q 3, FY 2007-Q 3, FY 2009
Revenue of Murata by Application, Q1, FY 2008-Q3, FY 2009
Revenue of Murata by Application, Q3, FY 2007-Q3, FY 2009
Revenue and Operating Profit of TDK, FY2004-FY2009
Revenue and Operating Profit Margin of TDK, Q3, FY2007-Q3, FY2009
Revenue of TDK by Product, Q3, FY2007-Q3, FY2009
Revenue and Operating Profit of EPCOS, Q3, FY2008-Q3, FY2009
如果这份报告不能满足您的要求,我们还可以为您定制报告,请 留言说明您的详细需求。
|