|
|
|
报告导航:研究报告—
金融与服务业—零售与日用
|
|
2010年全球及中国玩具行业研究报告 |
 |
字数:2.1万 |
页数:73 |
图表数:83 |
|
中文电子版:4500元 |
中文纸版:2250元 |
中文(电子+纸)版:5000元 |
|
英文电子版:1700美元 |
英文纸版:1600美元 |
英文(电子+纸)版:2000美元 |
|
编号:YF003
|
发布日期:2010-07 |
附件:下载 |
 |
|
|
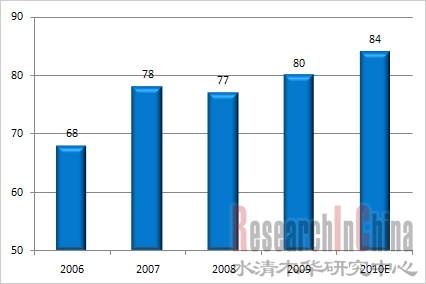
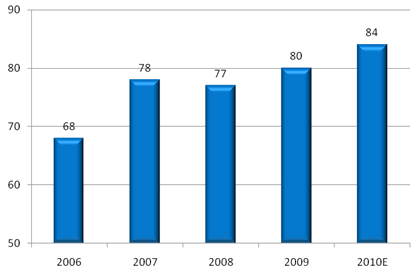
2009年,受金融危机影响,全球玩具销售800亿美元,相比2008年的770亿美元增长3.6%。2010年全球经济逐渐复苏,玩具行业也有所好转,预计2010年全球玩具销售将比2009年增长5.4%,达到843亿美元。在全球十大玩具销售国中,美国、日本、中国占据前三位,分别为215亿、58亿、49亿美元,英、法、德、巴西、印度、澳大利亚、加拿大分别位列4-10位,十大玩具销售国销售额占全球玩具销售总额的66%。
图:2006-2009全球玩具销售额(单位:十亿美元)

来源:WIND、水清木华研究中心;整理:水清木华研究中心
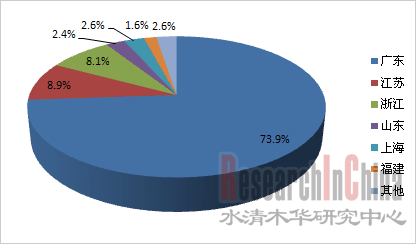
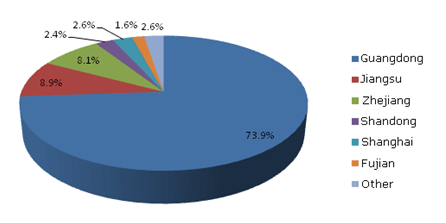
中国是世界上最大的玩具制造国和出口国,全球超过三分之二的玩具是在中国制造的,2009年中国玩具出口额达78亿美元。广东、江苏、浙江、上海、山东是中国玩具最重要的生产和出口基地,占中国玩具年销售额的90%以上,其中,广东以电动和塑料玩具为主;江苏、上海以毛绒玩具为主;浙江以木制玩具为主。
图:2009年中国玩具出口的省市分布

来源:WIND;整理:水清木华研究中心
2009 年,我国11 大类出口玩具中,8 类玩具出现同比下降。其中,动物玩具出口13.6亿美元,下降24.2%。智力玩具和成套玩具分别出口5.2 亿美元和5 亿美元,分别增长6.6%和1.5%。随着技术升级的进步,玩具出口产业已经发生了较大的变化:发达国家对玩具的需求已经从传统的塑料玩具、填充玩具等中低档次产品转向成人玩具、高科技电动玩具、智力开发类、教育类玩具等高档次品种。运用高科技、新技术生产的电子玩具、网络玩具成为新的发展方向。
中国的毛绒玩具在欧美市场所占份额较大,但是主要依靠低价优势和加工贸易,利润微薄,90%以上为贴牌生产和代工生产。随着人民币升值和劳动力成本上升,毛绒玩具制造成本升高,所占份额逐渐减少、木制玩具大约占整个市场的10%,传统的木制玩具向益智木制玩具、宠物木制玩具等方向发展。中国的塑料玩具由于原材料价格持续走高和质量安全问题等原因充满了各种风险。中国益智玩具前景广阔,但需要出台相关标准,以规范该市场的健康发展。
从各国儿童年均玩具消费来看,中国仅20美元,而澳大利亚和美国分别达到了401美元和280美元。目前中国少年儿童数量已经达到了3亿规模,国内玩具消费空间潜力巨大。另一方面,进入2010年,80年代婴儿出生高峰期带来的回声潮一代将逐渐成为玩具消费的主力。预期未来几年,国内玩具行业需求将快速增长。
面对上升的市场需求,国内主要玩具企业都制定了雄心勃勃的拓展计划。
奥飞动漫公司2009年上市募集了8.6亿资金,使其可以通过兼并、收购等方式并购国内优质企业,开展动漫产业链一体化运营。2010年3月,奥飞动漫公司斥资9000万元收购广东嘉佳卡通影视有限公司60%股权,不仅获得了稀缺的媒体频道资源,而且有利于公司动画片的发行和动漫玩具销售。
星辉车模公司将在现有21 个品牌190 款车模品牌的基础上,计划未来三年将新增国外保时捷以及国内红旗、奇瑞、比亚迪等多个品牌的车模授权,力争使车模授权达到26 个品牌300个款式以上。受产能限制,星辉车模公司产品主要销往国外及北京、上海等一线城市,未来公司在产能得到进一步提高之后,将全面拓展国内二、三线城市的车模市场。
In 2009, influenced by the financial crisis, the global toy sales turned out to be US$80 billion, an increase of 3.6% compared with US$77 billion in 2008. Along with the gradual recovery of global economy in 2010, the toy industry also takes a turn for the better; promisingly, global toy sales in 2010 will be raised by 5.4% compared with the prior year, hitting US$84.3 billion. The USA, Japan, and China rank the Top 3 of toy sales worldwide with the respective sales of US$21.5 billion, US$5.8 billion, and US$4.9 billion, while Britain, France, Germany, Brazil, India, Australia, and Canada take the 4th-10th position. The Top 10 countries occupy 66% of the global total sales of toys.
Global Toy Sales, 2006-2009 (Unit: US$ bn)

Source: WIND; ResearchInChina
China is the world’s largest toy manufacturer and exporter, and over 2/3 of global toys are made in China; the export value of Chinese toys in 2009 reached US$7.8 billion. Guangdong, Jiangsu, Zhejiang, Shanghai, and Shandong are the foremost production and export bases of toys in China, accounting for more than 90% of the annual sales of Chinese toys, of which, Guangdong gives priority to electric toys and plastic toys; Jiangsu and Shanghai are mainly engaged in plush toys; Zhejiang gives first place to wooden toys.
Distribution of Toy Export in China, 2009

Source: WIND; ResearchInChina
In 2009, among the 11 categories of exported toys of China, 8 categories experienced declines; of which, the export value of animal toys was US$1.36 billion, down 24.2%. While the export value of intellectual toys and toy sets amounted to US$520 million and US$500 million, respectively, up 6.6% and 1.5%. In pace with the upgrading of technology, changes have been made to the toy export industry: developed countries have diverted their demands of toys to top-grade types such as adult toys, high-tech electric toys, intellectual & educational toys from traditional medium and low-grade products like plastic toys and stuffed toys. Electric toys and online toys produced with high & new tech become the new development orientation.
China’s plush toys enjoy relatively large shares in European & American market, but the low-price edge and processing trade only brings along meager profits and more than 90% are OEM products. With the appreciation of RMB as well as the rise of labor cost, the manufacturing cost of plush toys goes up and the market share decreases gradually; wooden toys approximately occupy 10% of the market share, with the focus shifting from traditional wooden toys to intellectual wooden toys, pet wooden toys, etc. China’s plastic toys are facing various risks because of the continuously rising price of raw materials, quality and safety issues, etc. And China’s intellectual toys have a broad prospect, but relevant standards need to be released so as to guarantee the healthy development of the market.
From the perspective of annual average consumption of toys by children worldwide, China sees only US$20, while Australia and the USA reach respective US$401 and US$280. At present, the population of Chinese juvenile and children has hit 300 million, so, there is huge potentiality of toy consumption in domestic market. On the other hand, as we entering 2010, the Echo Boomers born in 1980s will become the main force of toy consumption. It is predicted that the demand of domestic toy industry will increase dramatically in the following several years.
Facing the rising market demand, major toy enterprises in China have worked out ambitious development plans.
Guangdong Alpha Animation and Culture Co., Ltd. raised RMB860 million from the IPO in 2009, which enables it to carry out integrated operation of animation industry chain through merging and acquiring excellent domestic enterprises. In March 2010, it invested RMB90 million to acquire a 60% stake in Guangdong Jiajia Cartoon Film Co., Ltd. in an effort to obtain rare media channel resources and promote the release of animated films and the selling of cartoon toys.
Based on the current 21 brands and 190 models of model cars, Xinghui Auto Model Co., Ltd. plans to get the model car authorization of foreign brands including Porsche, and domestic brands including Hongqi, Chery and BYD in the coming three years, striving for the authorization of 26 brands and over 300 models. Restricted by output capacity, the products of Xinghui Auto Model Co., Ltd. are mainly sold to foreign countries and first-tier domestic cities like Beijing and Shanghai; the company will further expand its market in second and third-tier domestic cities after the improvement of its output capacity in the future.
第一章玩具行业概述
1.1玩具的定义和分类
1.2玩具行业发展历程
第二章 全球玩具行业分析
2.1全球玩具市场发展概况
2.2主要国家
2.2.1美国玩具市场
2.2.2日本玩具市场
第三章 中国玩具行业发展概况
3.1发展现状
3.1.1 中国玩具行业发展现状
3.1.2 2009年中国玩具市场发展回顾
3.2进出口分析
3.2.1中国玩具进口情况
3.2.2中国玩具出口情况分析
3.2.3中国玩具行业出口的困境
第四章 玩具行业关联产业
4.1塑料行业
4.2动漫行业
4.3游戏行业
第五章 玩具子产业分析
5.1 毛绒玩具
5.1.1毛绒玩具发展概况
5.1.2中国毛绒玩具的发展困境
5.2 木制玩具
5.2.1木制玩具行业现状
5.2.2木制玩具市场需求分析
5.3 塑料玩具
5.3.1中国塑料玩具行业发展概况
5.3.2中国塑料玩具出口市场分析
5.3.3中国塑料玩具行业发展困境
5.4 电子玩具
5.4.1 智能电子玩具受欢迎
5.4.2 电动毛绒玩具发展状况
5.4.3 中国电玩业受RoHS指令影响
5.5 益智玩具
5.5.1 益智玩具成为玩具主流
5.5.2 益智玩具市场行业标准
5.5.3 国内益智玩具市场需要大力开发
第六章 国内主力玩具厂商分析
6.1奥飞动漫(Guangdong Alpha Animation and Culture Co.,LTD.)
6.1.1公司介绍
6.1.2经营状况
6.1.3公司策略
6.2星辉车模(Xing Hui Auto Model Co., Ltd )
6.2.1公司介绍
6.2.2经营状况
6.3高乐股份(GOLDLOK TOYS HOLDINGS CO.,LTD.)
6.3.1公司介绍
6.3.2经营状况
6.4龙昌国际(Lung Cheong International Holdings Limited)
6.4.1公司介绍
6.4.2经营状况
6.5江苏好孩子集团
6.6香港隆成集团(Lerado Group)
6.6.1公司介绍
6.6.2经营状况
6.7英德玩具
6.7.1公司介绍
6.7.2经营状况
6.8广东骅威玩具工艺(集团)有限公司
6.8.1公司介绍
6.8.2经营状况
第七章 国外主要玩具厂商分析
7.1美国美泰(Mattel)
7.1.1公司介绍
7.1.2经营状况
7.2美国孩之宝(Hasbro)
7.2.1公司介绍
7.2.2经营状况
7.3日本Takara Tomy
7.3.1公司介绍
7.3.2经营状况
7.4丹麦乐高(LEGO)
7.4.1公司介绍
7.4.2经营状况
7.5 BANDAI NAMCO
7.5.1公司介绍
7.5.2经营状况
第八章 中国玩具市场发展趋势
1. Overview of Toy Industry
1.1 Definition and Category
1.2 Development History
2. Global Toy Industry
2.1 Development
2.2 Major Countries
2.2.1 USA
2.2.2 Japan
3. China Toy Industry
3.1 Current Development
3.1.1 Status Quo
3.1.2 Development in 2009
3.2 Export & Import
3.2.1 Import
3.2.2 Export
3.2.3 Export Predicament
4. Related Industries
4.1 Plastic Industry
4.2 Cartoon & Animation Industry
4.3 Game Industry
5. Sub-industries
5.1 Plush Toy
5.1.1 Overview
5.1.2 Development Predicament of China Plush Toy Industry
5.2 Wooden Toy
5.2.1 Status Quo
5.2.2 Market Demand
5.3 Plastic Toy
5.3.1 Overview of China Plastic Toy Industry
5.3.2 Export of Chinese Plastic Toys
5.3.3 Development Predicament of China Plastic Toy Industry
5.4 Electronic Toy
5.4.1 Popular Intelligent Electronic Toy
5.4.2 Development of Electric Plush Toy
5.4.3 Influence of RoHS Directive on China Electronic Toy Industry
5.5 Intellectual Toy
5.5.1 Mainstream Status
5.5.2 Industry Standard
5.5.3 Huge Market Potential
6. Key Toy Enterprises in China
6.1 Guangdong Alpha Animation and Culture Co., Ltd.
6.1.1 Profile
6.1.2 Operation
6.1.3 Strategy
6.2 Xinghui Auto Model Co., Ltd.
6.2.1 Profile
6.2.2 Operation
6.3 Goldlok Toys Holdings (Guangdong) Co., Ltd.
6.3.1 Profile
6.3.2 Operation
6.4 Lung Cheong International Holdings Limited
6.4.1 Profile
6.4.2 Operation
6.5 Jiangsu Goodbaby Group
6.6 Lerado Group
6.6.1 Profile
6.6.2 Operation
6.7 Intex Toys
6.7.1 Profile
6.7.2 Operation
6.8 Guangdong Huawei Toys Craft Co., Ltd.
6.8.1 Profile
6.8.2 Operation
7. Key Toy Enterprises Overseas
7.1 Mattel
7.1.1 Profile
7.1.2 Operation
7.2 Hasbro
7.2.1 Profile
7.2.2 Operation
7.3 Takara Tomy
7.3.1 Profile
7.3.2 Operation
7.4 LEGO
7.4.1 Profile
7.4.2 Operation
7.5 BANDAI NAMCO
7.5.1 Profile
7.5.2 Operation
8. Development Trend of Chinese Toy Market
图:2006-2010年全球玩具销售额
图:2009年全球玩具市场(分地区)销售额
图:2008-2009全球玩具市场销售额统计
图:2007-2009年全球玩具(分地区)销售额构成
图:2003-2009年美国玩具销售额
图:2008-2009年美国玩具(分产品)销售额
图:2003-2008年美国玩具进口额及从中国进口额
图:2008年美国玩具进口来源分布
图:2003-2008年美国玩具出口额
图:2008年美国玩具出口目的地分布
图:2004-2009年日本玩具销售额
图:2005-2009年中国玩具制造企业工业总产值及同比增长率
图:2009年中国城市、农村消费者购买玩具倾向
图:2009年部分国家儿童玩具年均消费
图:2007.02-2010.05中国玩具行业毛利率
图:2009.01-2009.12中国玩具出口额
图:2009年中国消费者购买玩具价格分布
图:2001-2009年中国玩具进口金额
图:2000和2009年中国玩具(分产品)出口对比
图:2001-2009年中国玩具出口金额及同比增长率
图:2009年中国玩具出口目的地分布
图:2009年中国玩具出口来源地分布
图:2009年中国玩具(分产品)出口额及同比增长率
图:2000-2009年中国塑料工业总产值
图:2000-2009年中国塑料制品产量及增长率
图:2000-2009年塑料制品行业进出口数据
图:1999-2008年日本动画DVD销售与租借收益
图:2004-2009年国产电视动画片生产数量
图:2009年发达国家动漫玩具占玩具市场份额
图:2001-2009年中国网络游戏市场规模
图:2006-2009年中国网络游戏用户数统计
表:2007-2009年中国十大网游厂商游戏收入
图:2006-2009年中国网络游戏数量统计
图:2007-2012年中国电视游戏平台硬件销售量及增长率
图:2007-2012年中国掌机游戏平台硬件销售量及增长率
图:2004-2009年中国毛绒玩具出口额
图:2009年中国毛绒玩具出口目的地分布
图:2009年1-11月毛绒玩具部分出口地及出口额
图:2009年美国木制玩具进口来源国
图:2009年英国木制玩具进口来源国
图:2008年中国塑料玩具出口目的地分布
图:2008年美国塑料玩具进口来源地分布
图:2008年德国塑料玩具进口来源地分布
图:2008-2009年中国智力玩具出口目的地及出口额
图:2009年1-11月中国智力玩具主要出口地及出口额
图:2007-2010Q1奥飞动漫营业收入和净利润
图:2009年奥飞动漫(分产品)营业收入及增长率
图:2007-2009年奥飞动漫(分产品)营业收入增长率统计
图:2006-2009年奥飞动漫(分地区)收入构成
图:2007-2009年奥飞动漫分业务毛利率
图:2006-2009年奥飞动漫动漫玩具收入及占比
图:2007-2010Q1星辉车模营业收入和净利润
表:2009年星辉车模(分产品)营业收入及增长率统计
图:2006-2009年星辉车模(分产品)收入构成
图:2006-2009年星辉车模车模销售收入占比
图:2006-2009年星辉车模毛利率
图:2006-2009年星辉车模(分地区)收入构成
图:星辉车模获得的授权品牌
图:2007-2010Q1高乐玩具营业收入和净利润
图:2008-2009年高乐玩具(分产品)营收结构
图:2008-2009年高乐玩具(分地区)营收占比
表:2009年高乐玩具细分市场竞争状况
图:2006-2009年高乐玩具主要销售渠道收入构成
图:2007-2009年龙昌国际毛利润
图:2007-2009年龙昌国际(分地区)收入构成
图:2007-2009年龙昌国际(分产品)收入构成
图:2006-2009年隆成集团营业收入
图:2008-2009年隆成集团(分业务)收入构成
图:2007-2008年东莞英德玩具营业收入
图:2006-2009年美泰营业收入和净利润
图:2007-2009年美泰(分地区)收入构成
图:2007-2009年美泰(分产品)收入构成
图:2001-2009年孩之宝营业收入
图:2007-2009年孩之宝(分产品)营业收入
图:2007-2009年孩之宝(分地区)营业收入
图:2007-2010财年Tomy 营业收入
图:2008-2009财年Tomy(分地区)营业收入
图:2009财年Tomy(分产品)收入构成
图:2005-2009年LEGO Group营业收入
图:2005-2009年LEGO Group净利润
图:2006-2010财年BANDAI销售额和毛利润
图:2008-2010财年 BANDAI(分产品)销售额
图:2006-2010财年 BANDAI(分地区)销售额
Global Toy Sales, 2006-2010
Global Toy Market Sales (by Region), 2009
Global Toy Market Sales, 2008-2009
Global Toy Sales Structure (by Region), 2007-2009
Sales of Toys in the USA, 2003-2009
Sales of Toys in the USA (by Product), 2008-2009
Import Value and Import Value from China of Toys in the USA, 2003-2008
Import Source Distribution of Toys in the USA, 2008
Export Value of American Toys, 2003-2008
Distribution of Export Destinations of American Toys, 2008
Sales of Japanese Toys, 2004-2009
Gross Industrial Output Value and Growth Rate of Chinese Toy Manufacturers, 2005-2009
Purchase Inclinations of Urban & Rural Consumers in China, 2009
Annual Average Consumption of Children’s Toys in Some Countries, 2009
Gross Margin of China Toy Industry, Feb.2007- May 2010
Export Value of Chinese Toys, Jan. 2009-Dec.2009.12
Prices of the Toys Bought by Chinese Consumers, 2009
Import Value of Toys in China, 2001-2009
Export of Chinese Toys (by Product), 2000 VS 2009
Export Value and Growth Rate of Chinese Toys, 2001-2009
Distribution of Export Destinations of Chinese Toys, 2009
Distribution of Export Sources of Chinese Toys, 2009
Export Value and Growth Rate of Chinese Toys (by Product), 2009
Gross Output Value of China Plastic Industry, 2000-2009
Output and Growth Rate of Chinese Plastic Products, 2000-2009
Export & Import Data of Plastic Industry, 2000-2009
Sales and Leasing Profits of Japanese Cartoon DVD, 1999-2008
Output of Domestic TV Animation, 2004-2009
Market Share of Cartoon & Animation Toys of Developed Countries, 2009
Market Size of Online Games in China, 2001-2009
Number of Online Game Players in China, 2006-2009
Revenue of Top 10 Online Game Manufacturers in China, 2007-2009
Quantity of Chinese Online Games, 2006-2009
Sales Volume and Growth Rate of TV Game Platform Hardware in China, 2007-2012
Sales Volume and Growth Rate of PSP Platform Hardware in China, 2007-2012
Export Value of Chinese Plush Toys, 2004-2009
Distribution of Export Destinations of Chinese Plush Toys, 2009
Partial Export Destinations and Export Value of Plush Toys, Jan.-Nov. 2009
Import Sources of Wooden Toys in the USA, 2009
Import Sources of Wooden Toys in Britain, 2009
Distribution of Export Destinations of Chinese Plastic Toys, 2008
Import Source Distribution of Plastic Toys in the USA, 2008
Import Source Distribution of Plastic Toys in Germany, 2008
Export Destinations and Export Value of Chinese Intellectual Toys, 2008-2009
Major Export Destinations and Export Value of Chinese Intellectual Toys, Jan.-Nov.2009
Operating Income and Net Profit of Alpha Animation, 2007-2010Q1
Operating Income and Growth Rate of Alpha Animation (by Product), 2009
Operating Income and Growth Rate of Alpha Animation (by Product), 2007-2009
Revenue Structure of Alpha Animation (by Region), 2006-2009
Gross Margin of Alpha Animation (by Business), 2007-2009
Revenue from Cartoon Toys and Its Proportion of Alpha Animation, 2006-2009
Operating Income and Net Profit of Xinghui Auto Model, 2007-2010Q1
Operating Income and Growth Rate of Xinghui Auto Model (by Product), 2009
Revenue Structure of Xinghui Auto Model (by Product), 2006-2009
Proportion of Revenue from Model Cars of Xinghui Auto Model, 2006-2009
Gross Margin of Xinghui Auto Model, 2006-2009
Revenue Structure of Xinghui Auto Model (by Region), 2006-2009
Authorized Brands Obtained by Xinghui Auto Model
Operating Income and Net Profit of Goldlok Toys, 2007-2010Q1
Operating Income Structure of Goldlok Toys (by Product), 2008-2009
Operating Income Proportion of Goldlok Toys (by Region), 2008-2009
Segmented Market Competition of Goldlok Toys, 2009
Revenue Structure of Goldlok Toys by Sales Channel, 2006-2009
Gross Profit of Lung Cheong International, 2007-2009
Revenue Structure of Lung Cheong International (by Region), 2007-2009
Revenue Structure of Lung Cheong International (by Product), 2007-2009
Operating Income of Lerado Group, 2006-2009
Revenue Structure of Lerado Group (by Business), 2008-2009
Operating Income of Dongguan Intex Toys, 2007-2008
Operating Income and Net Profit of Mattel, 2006-2009
Revenue Structure of Mattel (by Region), 2007-2009
Revenue Structure of Mattel (by Product), 2007-2009
Operating Income of Hasbro, 2001-2009
Operating Income of Hasbro (by Product), 2007-2009
Operating Income of Hasbro (by Region), 2007-2009
Operating Income of Tomy, FY2007-FY2010
Operating Income of Tomy (by Region), FY2008-FY2009
Revenue Structure of Tomy (by Product), FY2009
Operating Income of LEGO Group, 2005-2009
Net Profit of LEGO Group, 2005-2009
Sales and Gross Profit of BANDAI, FY2006-FY2010
Sales of BANDAI (by Product), FY2008-FY2010
Sales of BANDAI (by Region), FY2006-FY2010
如果这份报告不能满足您的要求,我们还可以为您定制报告,请 留言说明您的详细需求。
|