|
|
|
报告导航:研究报告—
生命科学—生物科技
|
|
2010年全球及中国生物制药行业研究报告 |
 |
字数:3.0万 |
页数:124 |
图表数:136 |
|
中文电子版:6000元 |
中文纸版:3000元 |
中文(电子+纸)版:6500元 |
|
英文电子版:2000美元 |
英文纸版:1900美元 |
英文(电子+纸)版:2300美元 |
|
编号:YF005
|
发布日期:2010-09 |
附件:下载 |
 |
|
|
生物制药行业近年来一直是全球医药行业中增长最为迅速的子行业,1998-2009年的复合增长率达到了18.6%,远高于全球药品市场8.5%的增长率。美国生物技术医药产品的研发创新最活跃,稳居全球生物技术产业的核心,目前全球近60%的生物技术专利为美国所有。 目前中国生物生化制药行业的企业有700多家,2009年总销售收入约为753亿元,2005-2009年复合增长率约30%,是医药行业增长最为迅速的领域之一。中国生物医药发展水平与欧美发达国家仍然存在明显差距。目前中国生物生化制药产业在整个医药产业中所占的比重还不高,2009年销售占比仅为10%,具有广阔的成长空间。
图:2005-2009年中国生物生化制药销售收入及同比增长率
整理:水清木华研究中心
从各细分市场来看,血液制品国际市场呈现大公司垄断格局,拜耳、百特的市场占有率高达80%。中国的血液制品受血浆不足呈现供求紧张的局面,且集中度不高,生产厂商众多。国际血液制品市场上,凝血因子类产品占据主导地位;而中国市场上,则是人血白蛋白和免疫球蛋白产品占据主导地位,凝血因子占比很小,未来增长空间很大。华兰生物、上海莱士血液制品产品种类较多,竞争力较强。
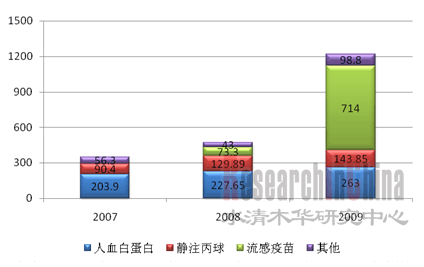
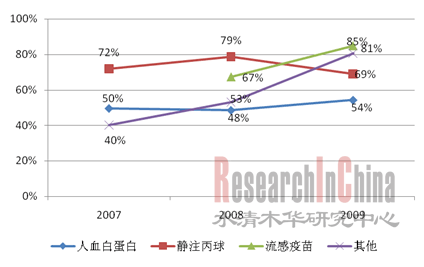
图:2007-2009年华兰生物(分产品)营业收入(单位:百万元)  来源:水清木华研究中心 图:2007-2009年华兰生物(分产品)毛利率 来源:水清木华研究中心 国际疫苗市场集中度相当高,葛兰素史克、赛诺菲-安万特,默克、瑞辉/惠氏、诺华处于市场领导地位。中国疫苗市场集中度不高,生产厂商较多;一类疫苗(计划疫苗)由于中国儿童死亡率和高收入国家的较大差距,未来仍然有扩张潜力;二类疫苗随着人均收入提高和公民防患意识的普及,未来扩张潜力巨大。天坛生物疫苗种类众多,再加上公司收购了有最大血液制品车间之一的成都蓉生,公司未来会迎来新的增长。 国际诊断试剂市场并购不断,制药巨头们大举收购中小诊断试剂公司, 产品线增多和应用领域的拓广,诊断试剂处于快速成长期;中国诊断试剂市场的主要公司有科华生物、达安基因等。国内诊断试剂目前集中在比较低端的生化诊断试剂,逐渐向国际市场的主流免疫诊断试剂和核酸诊断试剂发展。 单克隆抗体是近年来复合增长率最大的一类抗体药物,2009 年排在全球畅销药物排行榜前二十名的药物中,就有四个单抗药物。1999 年-2009 年十年间,全球单抗药物市场的复合增长率达到了 62.88%。中国单克隆抗体药物市场尚处于起步期,市场规模仅有10亿元,距离欧美发达国家还有很大差距。国内目前形成了北京、上海、西安等抗体药物的产业化基地。北京基地以北京百泰生物技术公司和北京天广实生物技术有限公司等为主;上海基地以上海中信国健药业有限公司等为主;西安基地由第四军医大学和成都华神集团合作形成。 重组蛋白类药物在各种重大疾病中有广泛应用,市场潜力巨大。长春高新子公司金赛药业是国内第一家开发出重组人生长素的公司,目前市场占比较大;安科生物是目前唯一同时获得干扰素和生长激素两类生物制品生产批文的生产厂商;通化东宝是国内胰岛素行业的龙头企业,长效胰岛素是公司未来增长的亮点;双鹭药业的治疗性抗体和基因工程疫苗将给公司带来巨大的收入。
In recent years, biopharmaceutical industry has been the fastest growing sector in the global pharmaceutical industry. From 1998 to 2009, the compound annual growth rate of biopharmaceutical industry reached 18.6%, far higher than 8.5% of the global pharmaceutical market. USA is the most active country in R & D and innovation of biopharmaceutical products, taking the core position in the global biotechnology industry. Now, nearly 60% of biotechnology patents are held by USA. At present, there are more than 700 companies in China’s biological and bio-chemical pharmaceutical industry, with total sales revenue of about RMB75.3 billion in 2009. Growing at a compound annual growth rate of about 30% from 2005 to 2009, China biological and bio-chemical pharmaceutical industry had become one of the fastest growing fields in China pharmaceutical industry. China is still backward in biomedical development compared with European and American countries. Currently, China biological and bio-chemical pharmaceutical industry only takes a small proportion in China pharmaceutical industry, and only contributed 10% to the total sales revenue in 2009, so it has broad room for growth.
Sales Revenue and YoY Growth Rate of China Biological and Bio-chemical Pharmaceutical Industry, 2005-2009
Source: ResearchInChina
As for segments, the international blood products market is monopolized by big companies, Bayer and Baxter acquire as high as 80% market shares. Due to the lack of plasma, China is confronted with tight supply of blood products, with low concentration degree and many manufacturers. In the international blood products market, coagulation factor products take the dominating position; however, in the Chinese blood products market, human albumin and immune globulin products take the dominating position, while coagulation factor products account for a small proportion and have huge potentials in the future. Hualan and Shanghai RAAS have diversified blood products with strong competitiveness.
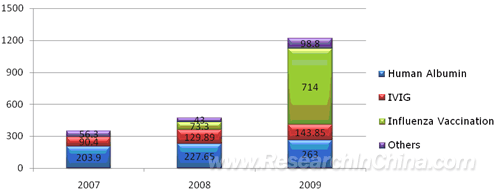
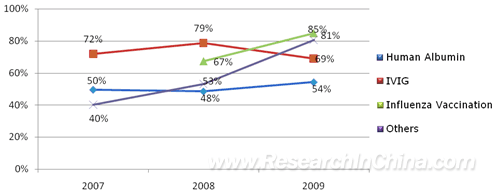
Hualan’s Operating Income (by Product), 2007-2009 (Unit: RMB mln)  Source: ResearchInChina Hualan’s Gross Margin (by Product), 2007-2009  Source: ResearchInChina The international vaccine market has high concentration degree. GlaxoSmithKline, Sanofi-Aventis, Merck, Pfizer/Wyeth and Novartis are the leaders in the market. Chinese vaccine market has low concentration degree, with many manufacturers. Vaccine I (planned vaccine) still has potentials because of the big difference between China and high-income countries in child mortality; Vaccine II has huge potentials in the future with the rise of per capita income and the enhancement of citizens’ awareness of disease prevention. Tiantan Biological has many types of vaccine, and it has acquired Chengdu Ronsen which has one of the largest blood product workshops, so it will achieve growth in the future. In the international diagnostic reagent market, mergers and acquisitions frequently occur. The pharmaceutical giants are aggressively acquiring small and medium diagnostic reagent companies. Increased product lines and expanded application fields make diagnostic reagent grow rapidly. In Chinese diagnostic reagent market, the major companies include KHB, Da An Gene and so on. The low-end biochemical diagnostic reagents occupy the leading position in Chinese market, but China is developing mainstream immune diagnostic reagents and nucleic acid diagnostic reagents which are popular in the international market. Monoclonal antibody drugs have been the antibody drugs with the highest compound annual growth rate in recent years. Among Top 20 Best-Selling Drugs in the World in 2009, there were four monoclonal antibody drugs. During 1999 to 2009, the compound growth rate of the global monoclonal antibody drug market reached 62.88%. Chinese monoclonal antibody drug market is still in the initial stage, and the market only values RMB1 billion, showing a big gap with the developed countries in Europe and the United States. Now, China has had antibody drug industrial bases in Beijing, Shanghai and Xi'an. The base in Beijing is led by Beijing Biotech Pharmaceutical Co., Ltd. (BPL) and Beijing Mabworks Biotech Co., Ltd. The base in Shanghai is led by Shanghai CP Guojian Pharmaceutical Co., Ltd. (CPGJ). The base in Xi'an is led by the Fourth Military Medical University and Chengdu Huasun Group. Recombinant protein drugs are widely used in the treatment of a variety of major diseases, with huge market potentials. GeneScience Pharmaceuticals Co., Ltd. (GenSci) which is a subsidiary of Changchun High and New Technology Industries (Group) Inc. is the first one to develop recombinant human growth hormone in China, with large market shares. Anke Biotechnology is the only manufacturer that is granted with the approval to produce interferon and growth hormone at the same time. Tonghua Dongbao is a leading enterprise in China insulin industry, and long-acting insulin will be the highlight in its future growth. Therapeutic antibodies and genetic engineering vaccines will generate considerable revenue for SL Pharmaceutical.
第一章 生物制药行业概述
1.1生物制药行业简介
1.2生物制药行业主要产品
第二章 全球生物制药行业概况
2.1全球生物制药行业发展概况
2.2美国
2.3欧洲
2.4日本
第三章 中国生物制药行业发展现状
3.1生物制药快速增长
3.2政策支持
第四章 生物制药主要细分市场分析
4.1血液制品
4.1.1血液制品概念
4.1.2全球血液制品市场
4.1.3中国血液制品市场
4.2疫苗
4.2.1疫苗特点及分类
4.2.2全球疫苗发展情况
4.2.3中国疫苗发展概况
4.3诊断试剂
4.4单克隆抗体
4.4.1单克隆抗体药物介绍
4.4.2全球单克隆抗体发展状况
4.4.3中国单克隆抗体发展状况
4.5重组蛋白药物
4.5.1干扰素
4.5.2生长激素
4.5.3重组人胰岛素
4.5.4重组人促卵泡激素
4.5.5长效重组蛋白药物
第五章 中国企业分析
5.1华兰生物
5.1.1公司介绍
5.1.2经营状况
5.2上海莱士
5.2.1公司介绍
5.2.2经营状况
5.2.3公司战略
5.3科华生物
5.3.1公司介绍
5.3.2经营状况
5.3.3公司战略
5.4达安基因
5.4.1公司介绍
5.4.2经营状况
5.4.3公司战略
5.5天坛生物
5.5.1公司介绍
5.5.2经营状况
5.5.3公司战略
5.6双鹭药业
5.6.1公司介绍
5.6.2经营状况
5.6.3公司战略
5.7长春高新
5.7.1公司介绍
5.7.2经营状况
5.7.3公司战略
5.8安科生物
5.8.1公司介绍
5.8.2经营状况
5.8.3公司战略
5.9 通化东宝
5.9.1公司介绍
5.9.2经营状况
5.9.3公司战略
5.10中国生物制药公司
5.10.1公司介绍
5.10.2经营状况
5.11其他公司
5.11.1百泰生物
5.11.2中信国健
5.11.3万泰生物
5.11.4丽珠集团
5.11.5四川蜀阳
第六章 国际生物制药企业
6.1葛兰素史克(GlaxoSmithKline)
6.1.1公司介绍
6.1.2经营状况
6.1.3葛兰素史克中国
6.2罗氏(Roche)
6.2.1公司介绍
6.2.2经营状况
6.2.3上海罗氏制药有限公司
6.3 安进(Amgen
6.3.1公司介绍
6.3.2经营状况
6.4诺和诺德(Novo Nordisk)
6.4.1公司介绍
6.4.2经营状况
6.4.3诺和诺德(中国)制药有限公司
6.5默克(Merck)
6.5.1公司介绍
6.5.2经营状况
6.6诺华(Novartis)
6.6.1公司介绍
6.6.2经营状况
6.6.3诺华(中国)生物医学研究有限公司
6.7赛诺菲-安万特(Sanofi-Aventis)
6.7.1公司介绍
6.7.2经营状况
6.7.3在中国运作情况
6.8阿斯利康(AstraZeneca)
6.8.1公司介绍
6.8.2经营状况
6.8.3阿斯利康中国
6.9百时美施贵宝(Bristol-Myers Squibb)
6.9.1公司介绍
6.9.2经营状况
6.9.3百时美施贵宝中国
6.10礼来(Eli Lilly)
6.10.1公司介绍
6.10.2经营状况
6.10.3礼来在中国运作情况
6.11 强生(Johnson & Johnson)
6.11.1公司介绍
6.11.2经营状况
6.11.3强生在中国运作情况
1. Overview of Biopharmaceutical Industry
1.1 Introduction
1.2 Main Products
2. Overview of Global Biopharmaceutical Industry
2.1 Development
2.2 USA
2.3 Europe
2.4 Japan
3. Status Quo of China Biopharmaceutical Industry
3.1 Rapid Growth
3.2 Policy Support
4. Key Segment Markets of Biopharmaceutical Industry
4.1 Blood Products
4.1.1 Concept
4.1.2 Global Market
4.1.3 Chinese Market
4.2 Vaccine
4.2.1 Characteristics and Classification
4.2.2 Development in the World
4.2.3 Development in China
4.3 Diagnostic Reagents
4.4 Monoclonal Antibodies
4.4.1 Profile
4.4.2 Development in the World
4.4.3 Development in China
4.5 Recombinant Protein Drugs
4.5.1 Interferon
4.5.2 Growth Hormone
4.5.3 Recombinant Human Insulin
4.5.4 Recombinant Human Follicle-stimulating Hormone
4.5.5 Long-acting Recombinant Protein Drugs
5. Chinese Enterprises
5.1 Hualan Biological Engineering
5.1.1 Profile
5.1.2 Operation
5.2 Shanghai RAAS
5.2.1 Profile
5.2.2 Operation
5.2.3 Strategy
5.3 KHB
5.3.1 Profile
5.3.2 Operation
5.3.3 Strategy
5.4 Da An Gene
5.4.1 Profile
5.4.2 Operation
5.4.3 Strategy
5.5 Tiantan Biological
5.5.1 Profile
5.5.2 Operation
5.5.3 Strategy
5.6 SL Pharmaceutical
5.6.1 Profile
5.6.2 Operation
5.6.3 Strategy
5.7 Changchun High and New Technology
5.7.1 Profile
5.7.2 Operation
5.7.3 Strategy
5.8 Anke Biotechnology
5.8.1 Profile
5.8.2 Operation
5.8.3 Strategy
5.9 Tonghua Dongbao
5.9.1 Profile
5.9.2 Operation
5.9.3 Strategy
5.10 Sino Biopharmaceutical Limited
5.10.1 Profile
5.10.2 Operation
5.11 Other Companies
5.11.1 BPL
5.11.2 CPGJ
5.11.3 Wantai Biological Pharmacy
5.11.4 Livzon
5.11.5 Sichuan Shuyang
6. International Biopharmaceutical Companies
6.1 GlaxoSmithKline
6.1.1 Profile
6.1.2 Operation
6.1.3 GlaxoSmithKline (China)
6.2 Roche
6.2.1 Profile
6.2.2 Operation
6.2.3 Shanghai Roche
6.3 Amgen
6.3.1 Profile
6.3.2 Operation
6.4 Novo Nordisk
6.4.1 Profile
6.4.2 Operation
6.4.3 Novo Nordisk (China)
6.5 Merck
6.5.1 Profile
6.5.2 Operation
6.6 Novartis
6.6.1 Profile
6.6.2 Operation
6.6.3 China Novartis Institute for BioMedical Research
6.7 Sanofi-Aventis
6.7.1 Profile
6.7.2 Operation
6.7.3 Operation in China
6.8 AstraZeneca
6.8.1 Profile
6.8.2 Operation
6.8.3 AstraZeneca (China)
6.9 Bristol-Myers Squibb
6.9.1 Profile
6.9.2 Operation
6.9.3 Bristol-Myers Squibb (China)
6.10 Eli Lilly
6.10.1 Profile
6.10.2 Operation
6.10.3 Operation in China
6.11 Johnson & Johnson
6.11.1 Profile
6.11.2 Operation
6.11.3 Operation in China
表:生物制品主要种类
图:2000-2009年全球生物制药市场规模及同比增长率
图:2008年全球生物制药(分地区)收入占比
图:2008年全球生物制药(分地区)研发费用占比
图:2008年全球领先生物制药企业研发投入
表:2009年全球生物制药“重磅炸弹”
图:2008年美国处于临床试验的生物技术药物种类
图:2005-2009年中国生物生化制药销售收入及同比增长率
图:2009年中国医药制造子行业销售占比
图:2009年国际市场血液制品(分产品)占比
图:2008年中国市场血液制品(分产品)占比
图:2006年中国血液制品生产企业占比
图:2009年中国人血白蛋白市场主要厂商及份额
图:2009年中国静注人免疫球蛋白主要厂商及份额
图:2009年中国人凝血因子VIII市场主要厂商及份额
图:2009年中国人凝血酶原复合物市场主要厂商及份额
图:2005-2009年全球疫苗市场销售规模及同比增长率
表:2006-2009年全球主要疫苗生产商疫苗销售额(单位:十亿美元)
图:2009年全球疫苗市场主要厂商及份额
图:全球疫苗产业防治领域及份额
图:2006-2009年全球疫苗重炸弹级产品销售额(单位:十亿美元)
图:2006-2009年中国疫苗销售额(单位:十亿元)
表:2009年中国甲流疫苗各公司批签发情况
图:2009年中国流感裂解疫苗市场主要厂商及份额(按照批签发量)
表:2009年和2010.1-4月水痘疫苗批签发数量(千人份)
图:2009年中国水痘疫苗市场主要厂商及份额(按批签发量计)
表:2007.01-2010.01全球诊断试剂行业并购案
表:中国诊断试剂主要生产厂家
图:2009年中国诊断试剂分类占比
表:单抗药物与传统药物的比较(以治疗肿瘤为例)
图:1999-2009年全球单克隆抗体销售额及同比增长率
图:重组蛋白类药物分类
图:2009年全球重组蛋白类药物主要分产品及份额
图:2003-2009年国际干扰素市场规模(单位:百万美元)
图:2004-2008年中国干扰素市场规模(单位:百万元)
图:2009年中国干扰素市场主要厂商及份额
图:2003-2008年国际生长激素市场规模及同比增长率
图:2004-2008年中国生长激素市场规模及同比增长率
图:2009年中国生长激素市场主要厂商及份额
图:2004-2009年中国重组胰岛素医院终端规模及增长率
图:2009年中国胰岛素市场主要厂商及份额
图:2009年中国促卵泡激素市场主要厂商及份额
表:2009年全球主要长效重组蛋白类药物销售额
图:2006-2010Q1华兰生物营业收入和净利润(单位:百万元)
图:2007-2009年华兰生物(分行业)营业收入(单位:百万元)
图:2007-2009年华兰生物(分产品)营业收入(单位:百万元)
图:2007-2009年华兰生物(分地区)营业收入(单位:百万元)
图:2007-2009年华兰生物(分产品)毛利率
表:2009年中国血液制品厂商生产情况
图:2006-2010Q1上海莱士营业收入和净利润(单位:百万元)
表:2009年上海莱士生物制品批签发情况
图:2005-2009年上海莱士(分产品)营业收入(单位:百万元)
图:2005-2009年上海莱士(分产品)毛利率
图:2007-2011E年上海莱士投浆量(单位:千吨)
图:2008-2009年上海莱士(分地区)营业收入(单位:百万元)
表:基因重组类血制品与传统血制品对比
图:2006-2010Q1科华生物营业收入和净利润(单位:百万元)
图:2007-2009年科华生物(分产品)营业收入
图:2007-2009年科华生物诊断试剂(分产品)销售收入
表:科华生物血筛市场业务收入预测
图:2006-2010Q1达安基因营业收入和净利润(单位:百万元)
图:2007-2009年达安基因(分产品)营业收入(单位:百万元)
图:2004-2008年达安基因核酸诊断试剂营业收入及同比增长率
表:达安基因血筛市场业务收入预测
图:2006-2010Q1天坛生物营业收入和净利润(单位:百万元)
图:2007-2009年天坛生物(分产品)营业收入(单位:百万元)
图:2007-2009年天坛生物(分产品)毛利率
图:2007-2009年天坛生物(分地区)营业收入(单位:百万元)
图:2006-2010Q1双鹭药业营业收入和净利润(单位:百万元)
图:2007-2009年双鹭药业研发投入费用在营业收入中的占比
图:2007-2009年双鹭药业(分地区)营业收入
图:2006-2010Q2长春高新营业收入和净利润(单位:百万元)
图:2007-2010H1年长春高新(分行业)营业收入(单位:百万元)
图:2007-2009年长春高新(分地区)营业收入(单位:百万元)
图:2003-2009年金赛药业销售收入和净利润(单位:百万元)
表:2010年金赛药业即将上市的新药
图:2006-2010Q1安科生物营业收入和净利润(单位:百万元)
图:2006-2009年安科生物(分产品)营业收入(单位:百万元)
图:2006-2009年安科生物主要生物制品营业收入(单位:百万元)
图:2007-2010Q2通化东宝营业收入和净利润(单位:百万元)
图:2007-2009年通化东宝主要(分产品)营业收入(单位:百万元)
图:2007-2009年通化东宝主要分产品毛利率
图:2007-2009年通化东宝(分地区)营业收入(单位:百万元)
图:2007-2010Q2中国生物制药公司营业收入和毛利润
图:2007-2009年中国生物制药公司(分产品)营业收入
图:2006-2009年中信国健益赛普销售额(单位:百万元)
图:2006-2010Q1葛兰素史克营业收入和营业利润(单位:十亿英镑)
图:2007-2009年葛兰素史克各治疗领域收入(单位:十亿英镑)
图:2007-2009年葛兰素史克(分地区)收入(单位:十亿英镑)
图:2007-2008年上海葛兰素史克生物制品有限公司营业收入和营业利润
图:2007-2010H1罗氏销售额和净利润(单位:十亿瑞士法郎)
图:2007-2009年罗氏(分行业)销售额(单位:十亿瑞士法郎)
图:2007-2009年罗氏制药行业(分领域)销售额
图:2008-2009年罗氏制药行业(分地区)销售额
图:2002-2009年罗氏诊断试剂销售收入(单位:十亿瑞士法郎)
图:2007-2009年罗氏诊断领域(分产品)收入构成
图:2007-2009年罗氏诊断领域(分地区)收入构成
图:2006-2009年罗氏四大单抗药物销售额(单位:十亿美元)
图:2007-2008年上海落实制药有限公司营业收入和营业利润
图:2006-2009年安进营业收入和净利润(单位:十亿美元)
图:2007-2009年安进(分产品)营业收入(单位:百万美元)
图:2005-2010H1诺和诺德销售额和净利润(单位:十亿丹麦克朗)
图:2005-2009年诺和诺德(分行业)销售额(单位:十亿丹麦克朗)
图:2005-2009年糖尿病领域(分产品)销售额(单位:十亿丹麦克朗)
图:2005-2009年生物制药领域(分产品)销售额
图:2005-2009年诺和诺德(分地区)销售额(单位:十亿丹麦克朗)
图:2007-2008年诺和诺德(中国)制药有限公司营业收入和营业利润
图:2007-2009年默克销售额和净利润(单位:十亿美元)
图:2007-2009年默克(分地区)收入(单位:十亿美元)
图:2002-2008年默克公司疫苗产品收入及同比增长率
图:2007-2009年诺华净销售额和净利润(单位:十亿美元)
图:2008-2009年诺华(分行业)净销售额(单位:十亿美元)
图:2007-2009年诺华(分地区)净销售额(单位:十亿美元)
图:2007-2010H1赛诺菲-安万特净销售额和净利润(单位:十亿欧元)
图:2009年赛诺菲-安万特人用疫苗销售额(单位:百万欧元)
图:2007-2008年杭州赛诺菲-安万特民生制药有限公司营业收入和营业利润
图:2007-2008年深圳赛诺菲巴斯德生物制品有限公司营业收入和营业利润
图:2007-2008年赛诺菲-安万特(北京)制药有限公司营业收入和营业利润
图:2007-2010H1阿斯利康销售额和营业利润(单位:十亿美元)
图:2007-2009年阿斯利康(分领域)销售额(单位:十亿美元)
图:2007-2009年阿斯利康(分地区)销售额(单位:十亿美元)
图:2007-2009年阿斯利康北美(分地区)销售额(单位:百万美元)
图:2007-2009年阿斯利康其他市场(分地区)销售额
图:2007-2009年阿斯利康新兴市场(分地区)销售额
图:2007-2008年阿斯利康中国营业收入和营业利润(单位:百万元)
图:2007-2009年百时美施贵宝净销售额、生物制药净销售额及占比
图:2007-2009年百时美施贵宝主要产品净销售额(单位:百万美元)
图:2007-2009年百时美施贵宝(分地区)净销售额(单位:十亿美元)
图:2007-2008年中美上海施贵宝营业收入和营业利润
图:2006-2010H1礼来营业收入和净利润(单位:十亿美元)
图:2007-2009年礼来主要产品营业收入(单位:百万美元)
图:2007-2008年礼来苏州制药有限公司营业收入和营业利润(单位:百万元)
图:2006-2009年强生营业收入和净利润(单位:十亿美元)
图:2007-2009年强生(分行业)营业收入(单位:十亿美元)
图:2007-2009年强生(分地区)营业收入(单位:十亿美元)
图:2007-2008年西安杨森营业收入和营业利润(单位:百万元)
Major Types of Biological Products
Global Biopharmaceutical Market Scale and YoY Growth Rate, 2000-2009
Proportion of Global Biopharmaceutical Income (by Region), 2008
Proportion of Global Biopharmaceutical R & D Expenses (by Region), 2008
R & D Investment of Leading Biopharmaceutical Enterprises in the World, 2008
"Blockbusters" in Global Biopharmaceutical Industry, 2009
Types of Biotechnology Drugs in Clinical Trials in USA, 2008
Sales Revenue and YoY Growth Rate of China Biological and Bio-chemical Pharmaceutical Industry, 2005-2009
Sales Proportion of Chinese Pharmaceutical Manufacturing Sub-sectors, 2009
Proportion of Blood Products in Global Market (by Product), 2009
Proportion of Blood Products in Chinese Market (by Product), 2008
Proportion of Chinese Blood Products Manufacturers, 2006
Major Manufacturers and Their Shares in Chinese Human Albumin Market, 2009
Major Manufacturers and Their Shares in Chinese Intravenous Human Immunoglobulin Market, 2009
Major Manufacturers and Their Shares in Chinese Human Coagulation Factor VIII Market, 2009
Major Manufacturers and Their Shares in Chinese Human Prothrombin Complex Market, 2009
Sales Revenue and YoY Growth Rate of Global Vaccine Market, 2005-2009
Vaccine Sales Revenue of Major Vaccine Manufacturers in the World, 2006-2009
Major Manufacturers and Their Shares in Global Vaccine Market, 2009
Prevention Sector and Share in Global Vaccine Industry
Sales Revenue of Blockbuster Vaccine Products in the World, 2006-2009
Sales Revenue of Vaccines in China, 2006-2009
Lot Release of H1N1 Influenza Vaccines of All Companies in China, 2009
Major Manufacturers and Their Shares in Chinese Influenza Split Vaccine Market (by Lot Release), 2009
Lot Release of Varicella Vaccines, 2009 & Jan-Apr 2010
Major Manufacturers and Their Shares in Chinese Varicella Vaccine Market (by Lot Release), 2009
M & A Cases in Global Diagnostic Reagent industry, Jan 2007-Jan 2010
Major Diagnostic Reagent Manufacturers in China
Categories of Diagnostic Reagents in China by Proportion, 2009
Comparison between Monoclonal Antibody Drugs and Traditional Drugs (for cancer)
Sales Revenue and YoY Growth Rate of Global Monoclonal Antibodies, 1999-2009
Classification of Recombinant Protein Drugs
Recombinant Protein Drugs by Product and Share, 2009
Global Interferon market Scale, 2003-2009
Chinese Interferon market Scale, 2004-2008
Major Manufacturers and Their Shares in Chinese Interferon Market, 2009
Global Growth Hormone Market Scale and YoY Growth Rate, 2003-2008
Chinese Growth Hormone Market Scale and YoY Growth Rate, 2004-2008
Major Manufacturers and Their Shares in Chinese Growth Hormone Market, 2009
Hospital Terminal Scale and Growth Rate of Chinese recombinant insulin, 2004-2009
Major Manufacturers and Their Shares in Chinese Insulin Market, 2009
Major Manufacturers and Their Shares in Chinese Follicle-stimulating Hormone Market, 2009
Sales Revenue of Major Long-acting Recombinant Protein Drugs in the World, 2009
Hualan’s Operating Income and Net Profit, 2006-1Q2010
Hualan’s Operating Income (by Industry), 2007-2009
Hualan’s Operating Income (by Product), 2007-2009
Hualan’s Operating Income (by Region), 2007-2009
Hualan’s Gross Margin (by Product), 2007-2009
Production of Blood Products Manufacturers in China, 2009
Operating Income and Net Profit of Shanghai RAAS, 2006-1Q2010
Lot Release of Biological Products of Shanghai RAAS, 2009
Operating Income of Shanghai RAAS (by Product), 2005-2009
Gross Margin of Shanghai RAAS (by Product), 2005-2009
Plasma Volume of Shanghai RAAS, 2007-2011E
Operating Income of Shanghai RAAS (by Region), 2008-2009
Comparison between Gene Recombinant Blood Products and Traditional Blood Products
KHB’s Operating Income and Net Profit, 2006-1Q2010
KHB’s Operating Income (by Product), 2007-2009
Sales Revenue of KHB’s Diagnostic Reagents (by Product), 2007-2009
Forecast for KHB’s Income from Blood Screening Business
Operating Income and Net Profit of Da An Gene, 2006-1Q2010
Operating Income of Da An Gene (by Product), 2007-2009
Operating Income and YoY Growth Rate of Nucleic Acid Diagnostic Reagents of Da An Gene, 2004-2008
Forecast for Income of Da An Gene from Blood Screening Business
Operating Income and Net Profit of Tiantan Biological, 2006-1Q2010
Operating Income of Tiantan Biological (by Product), 2007-2009
Gross Margin of Tiantan Biological (by Product), 2007-2009
Operating Income of Tiantan Biological (by Region), 2007-2009
Operating Income and Net Profit of SL Pharmaceutical, 2006-1Q2010
Proportion of R & D Cost to Operating Income of SL Pharmaceutical, 2007-2009
Operating Income of SL Pharmaceutical (by Region), 2007-2009
Operating Income and Net Profit of Changchun High and New Technology, 2006-2Q2010
Operating Income of Changchun High and New Technology (by Industry), 2007-1H2010
Operating Income of Changchun High and New Technology (by Region), 2007-2009
GenSci’s Sales Revenue and Net Profit, 2003-2009
GenSci’s Upcoming New Drugs, 2010
Operating Income and Net Profit of Anke Biotechnology, 2006-1Q2010
Operating Income of Anke Biotechnology (by Product), 2006-2009
Operating Income of Major Biological Products of Anke Biotechnology, 2006-2009
Operating Income and Net Profit of Tonghua Dongbao, 2007-2Q2010
Prime Operating Income of Tonghua Dongbao (by Product), 2007-2009
Gross Margin of Tonghua Dongbao by Product, 2007-2009
Operating Income of Tonghua Dongbao (by Region), 2007-2009
Operating Income and Gross Profit of Sino Biopharmaceutical, 2007-2Q2010
Operating Income of Sino Biopharmaceutical (by Product), 2007-2009
CPGJ’s Sales Revenue from Etanercept, 2006-2009
GlaxoSmithKline’s Operating Income and Operating Profit, 2006-1Q2010
GlaxoSmithKline’s Income in All Therapeutic Sectors, 2007-2009
GlaxoSmithKline’s Income (by Region), 2007-2009
Operating Income and Operating Profit of Shanghai GlaxoSmithKline, 2007-2008
Roche’s Sales Revenue and Net Profit, 2007-1H2010
Roche’s Sales Revenue (by Industry), 2007-2009
Roche‘s Sales Revenue in Pharmaceutical Industry (by Sector), 2007-2009
Roche‘s Sales Revenue in Pharmaceutical Industry (by Region), 2008-2009
Roche’s Sales Revenue from Diagnostic Reagents, 2002-2009
Roche’s Income Structure in Diagnostics Sector (by Product), 2007-2009
Roche’s Income Structure in Diagnostics Sector (by Region), 2007-2009
Roche’s Sales Revenue from Four Monoclonal Antibody Drugs, 2006-2009
Operating Income and Operating Profit of Shanghai Roche, 2007-2008
Amgen’s Operating Income and Net Profit, 2006-2009
Amgen’s Operating Income (by Product), 2007-2009
Sales Revenue and Net Profit of Novo Nordisk, 2005-1H2010
Sales Revenue of Novo Nordisk (by Industry), 2005-2009
Sales Revenue (by Product) in Diabetes Sector, 2005-2009
Sales Revenue (by Product) in Biopharmaceutical Sector, 2005-2009
Sales Revenue of Novo Nordisk (by Region), 2005-2009
Operating Income and Operating Profit of Novo Nordisk (China), 2007-2008
Merck’s Sales Revenue and Net Profit, 2007-2009
Merck’s Income (by Region), 2007-2009
Income and YoY Growth Rate of Merck’s Vaccine Products, 2002-2008
Novartis’s Net Sales Revenue and Net Profit, 2007-2009
Novartis’s Net Sales Revenue (by Industry), 2008-2009
Novartis’s Net Sales Revenue (by Region), 2007-2009
Net Sales Revenue and Net Profit of Sanofi-Aventis, 2007-1H2010
Sales Revenue of Human Vaccines of Sanofi-Aventis, 2009
Operating Income and Operating Profit of Hangzhou Sanofi-Aventis Minsheng Pharmaceutical, 2007-2008
Operating Income and Operating Profit of Shenzhen Sanofi Pasteur, 2007-2008
Operating Income and Operating Profit of Sanofi-Aventis (Beijing), 2007-2008
AstraZeneca’s Sales Revenue and Operating Profit, 2007- H1 2010
AstraZeneca’s Sales Revenue (by Sector), 2007-2009
AstraZeneca’s Sales Revenue (by Region), 2007-2009
AstraZeneca’s Sales Revenue in North America (by Region), 2007-2009
AstraZeneca’s Sales Revenue in Other Markets (by Region), 2007-2009
AstraZeneca’s Sales Revenue in Emerging Markets (by Region), 2007-2009
AstraZeneca’s Operating Income and Operating Profit in China, 2007-2008
Net Sales Revenue, Net Biopharmaceutical Sales Revenue and Its Proportion of Bristol-Myers Squibb, 2007-2009
Net Sales Revenue of Main Products of Bristol-Myers Squibb, 2007-2009
Net Sales Revenue of Bristol-Myers Squibb (by Region), 2007-2009
Operating Income and Operating Profit of Sino-American Shanghai Squibb, 2007-2008
Operating Income and Net Profit of Eli Lilly, 2006-1H2010
Operating Income of Main Products of Eli Lilly, 2007-2009
Operating Income and Operating Profit of Eli Lilly (Suzhou), 2007-2008
Operating Income and Net Profit of Johnson & Johnson, 2006-2009
Operating Income of Johnson & Johnson (by Industry), 2007-2009
Operating Income of Johnson & Johnson (by Region), 2007-2009
Operating Income and Operating Profit of Xi’an-Janssen, 2007-2008
如果这份报告不能满足您的要求,我们还可以为您定制报告,请 留言说明您的详细需求。
|