|
|
|
报告导航:研究报告—
TMT产业—电信
|
|
2010年中国智能手机行业消费者调查分析报告 |
 |
字数:1.5万 |
页数:52 |
图表数:62 |
|
中文电子版:5500元 |
中文纸版:2750元 |
中文(电子+纸)版:6000元 |
|
英文电子版:1300美元 |
英文纸版:1200美元 |
英文(电子+纸)版:1600美元 |
|
编号:CS005
|
发布日期:2010-09 |
附件:下载 |
 |
|
|
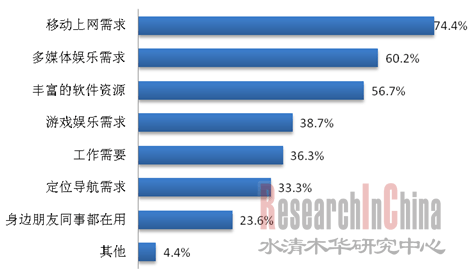
2009年中国智能手机市场上诺基亚依然一家独大。摩托罗拉的品牌推广和新产品发布缺乏足够支撑,又缺乏足够的经销商支持,导致其销量下滑。2010年,中国智能手机市场版图发生巨大变化,摩托罗拉借助Android系统重回市场;苹果凭借iPhone 4,在行货市场销量大增。 水清木华研究中心与第一调查网合作,于2010年8月开展了一项关于智能手机的问卷调查活动。本次调查样本量为600份,涉及年龄层次主要为20-50岁的男女性,其中男性占比47.3%,女性占比52.7%。调研区域主要覆盖上海、深圳、北京、广州和成都等一、二、三线共计21个城市。职业类型覆盖了国家公务员、教师、军人、企业高管和一般职员、个体户、蓝领职工和学生等众多群体。 从调查结果来看,移动上网、多媒体娱乐、大量的第三方软件都是智能手机的优势所在,而这也是消费者选择智能手机的主要原因,在苹果iPhone手机的带领下,大屏幕触控智能手机日渐流行,为消费者提供了更好的使用体验。
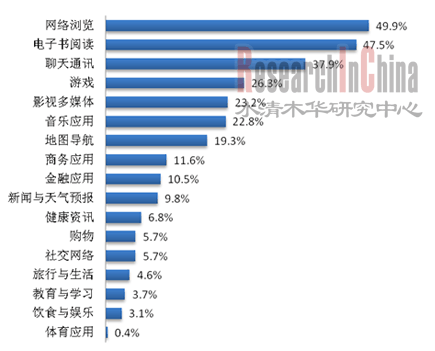
图:消费者选择智能手机的原因  来源:水清木华研究中心;第一调查网 根据被调查消费者的选择,网络浏览、电子书阅读和移动聊天通讯是智能手机用户最常使用的三个功能,渗透率分别达到50%、47.5%和38%。消费者对这些应用的高度需求也成为大屏幕触控智能手机发展的主要推动力之一。
图:消费者常用的智能手机应用  来源:水清木华研究中心;第一调查网
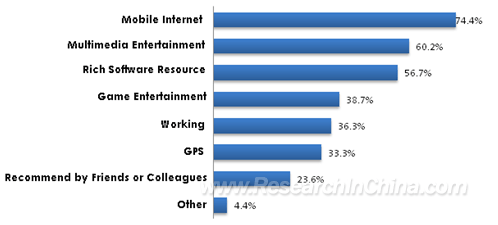
In 2009, the smart phone market of China was still dominated by Nokia, while Motorola witnessed a drop in sales volume since the brand promotion and new product launch were lack of adequate support, as well as the support from dealers. In 2010, Chinese smart phone market has witnessed fundamental changes. Motorola returned to the market by virtue of Android system, and Apple achieved substantial growth of sales volume in licensed market via IPhone4. In cooperation with www.1diaocha.com, ResearchInChina conducted an online questionnaire survey on smart phone in August, 2010. Among the 600 samples, the respondents included both males and females aged from 20 to 50, with the gender proportion of 47.3% and 52.7% respectively. The questionnaire was carried out in 21 first-tier, second-tier and third-tier cities including Shanghai, Shenzhen, Beijing, Guangzhou and Chengdu, targeting groups all walks of life like civil servants, teachers, soldiers, business executives as well as staff members, self-employed entrepreneurs, blue-collar workers and students. As is shown from survey findings, mobile internet, multimedia entertainment and rich software resource were the outstanding advantages of smart phone, which were the incentives to consumers to buy smart phones. Promoted by Apple iPhone, the large-size touch-panel smart phone, with better user experience, is growing popular.
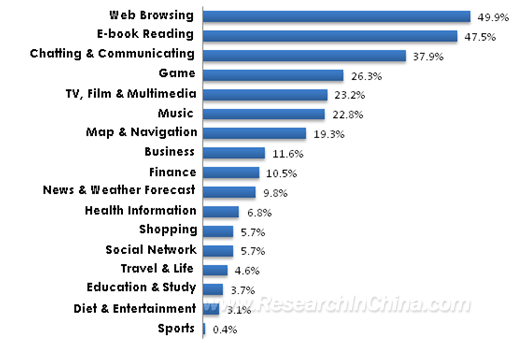
Reasons for Consumers to Choose Smart Phone  Source: ResearchInChina, www.1diaocha.com In the meantime, the web browsing, e-book reading and mobile chatting are the top three applications for smart phone users, with penetration rate of 49.9%, 47.5% and 37.9% respectively. In addition, the consumer’s high requirements for those applications become one of the main drivers for the development of large-size touch-panel smart phone.
Smart Phone Applications Commonly Used by Consumers  Source: ResearchInChina, www.1diaocha.com
第一章 全球手机市场及发展趋势
1.1 全球智能手机市场
1.2 中国手机市场与产业
1.3 中国智能手机市场
第二章 2010年中国智能手机消费者群体调查统计
2.1 调查背景
2.1.1 年龄分布
2.1.2 学历分布
2.1.3 职业分布
2.1.4 收入分布
2.1.5 城市分布
2.2 对智能手机的关注度
2.3 智能手机用户对手机的满意度
2.4 选择智能手机的原因
2.5 消费者更换手机的频率
2.6 智能手机附加功能的关注度
2.7 获取智能手机软件的途径
2.8 智能手机软件的安装数量
2.9 常用的智能手机应用分布
2.10 对付费智能手机软件的选择
2.11 未选择智能手机的原因
2.12 未来购买手机的选择
第三章 智能手机厂家研究
3.1 诺基亚
3.2 摩托罗拉
3.3 三星
3.4 索尼爱立信
3.5 LG
3.6 RIM
3.7 苹果
3.8 宏达电HTC
1 Global Mobile Phone Market & Development Trend
1.1 Global Smart Phone Market
1.2 China Mobile Phone Market & Industry
1.3 China Smart Phone Market
2 Survey on Smart Phone Consumer Group in China, 2010
2.1 Background
2.1.1 Distribution by Age
2.1.2 Distribution by Education Background
2.1.3 Distribution by Vocation
2.1.4 Distribution by Income
2.1.5 Distribution by City
2.2 Attention on Smart Phone
2.3 Satisfaction of Smart Phone Users
2.4 Reasons for Choosing Smart Phones
2.5 Frequency of Consumers to Change Mobile Phones
2.6 Attention on Additional Functions of Smart Phone
2.7 Means to Obtain Smart Phone Software
2.8 Number of Software Installed in a Smart Phone
2.9 Commonly Used Applications of Smart Phone
2.10 Selection of Paid Smart Phone Software
2.11 Reasons for Not Choosing Smart Phone
2.12 Selection of Buying Mobile Phone in the Future
3 Smart Phone Manufacturers
3.1 Nokia
3.2 Motorola
3.3 Samsung
3.4 Sony Ericsson
3.5 LG
3.6 RIM
3.7 Apple
3.8 HTC
图:2008-2010年全球智能手机厂家市场占有率
图:2004-2012年中国手机市场销量与智能手机所占比例统计
图:2009年中国主要手机厂家市场占有率
图:2008、2009年中国智能手机主要厂家市场占有率
图:消费者调查群体年龄分布情况
图:消费者调查群体学历分布情况
图:消费者调查群体职业分布情况
图:消费者调查群体收入分布情况
图:消费者对智能手机的关注度分布
图:智能手机用户对手机的满意度
图:消费者选择智能手机的原因
图:消费者更换手机的频率
图:消费者对智能手机附加功能的关注度
图:不同性别消费者对智能手机附加功能的关注度
图:不同年龄消费者对智能手机附加功能的关注度
图:消费者获取智能手机软件的方式
图:消费者在智能手机上安装的软件数量
图:不同性别消费者在手机上安装的软件数量
图:消费者常用的智能手机应用
图:消费者对付费智能手机软件的选择
图:消费者没有选择付费智能手机软件的原因
图:消费者没有选择智能手机的原因
图:消费者更换下一部手机时的选择
图:消费者可以接受的智能手机价格分布
图:消费者对智能手机品牌的选择
图:消费者购买智能手机的途径
图:不同年龄消费者购买智能手机的途径
图:消费者选购智能手机时对参数指标的关注度
图:消费者对智能手机操作系统的选择
图:消费者对智能手机外形的选择
图:不同性别消费者对智能手机外形的选择
图:消费者对未来智能手机的期望
图:2008年Q1-2010年Q1诺基亚手机平均销售价格与运营利润率
图:2008年Q1-2010年Q1诺基亚手机出货量与平均价格
图:2008年Q1-2010年Q1诺基亚手机出货量地域分布
图:2009年Q1、2010年Q1诺基亚手机销售额地域分布
图:2007年Q1-2010年Q1诺基亚大中华区手机出货量(百万部)
图:2008年Q1-2010年Q1摩托罗拉手机部门收入与运营利润率
图:2008年Q1-2010年Q1摩托罗拉手机出货量与平均销售价格
图:2008年Q1-2010年Q1摩托罗拉手机出货量与市场占有率
图:2009年Q1、Q4、2010年Q1摩托罗拉手机收入地域分布
表:摩托罗拉3款手机零组件配置清单
图:三星2001-2009年手机出货量与年增幅
图:三星2008年Q1到2010年Q1每季度手机出货量(百万部)
图:2007年Q1到2010年Q1三星手机出口平均价格与运营利润率
图:2008年Q1-2010年Q1索尼爱立信出货量与平均销售价格
图:2008年Q1-2010年Q1索尼爱立信收入与运营利润率
表:索爱手机平台一览
图:2001-2009年LG手机出货量与年增幅
图:2008年Q1-2010年Q1 LG手机每季度销售额与运营利润
图:2007年Q1到2009年Q3 LG手机部门地域收入结构
图:RIM 2004财年-2009财年收入与毛利率
图:黑莓国际用户数与RIM收入地域分布
图:2004-2010财年黑莓手机销量
图:RIM 2005财年-2009财年收入结构
图:RIM 2005财年-2009财年手机入网用户数与出货量
图:2007年Q1-2009年Q3苹果与RIM出货量
图:苹果2004-2009财年收入与净利润
图:苹果2004-2008财年地域收入结构
图:苹果2004-2009财年产品收入结构比例
图:2003-2010年宏达电收入与毛利率
图:2004-2010年宏达电出货量与平均价格
Market Shares of Smart Phone Manufacturers Worldwide, 2008-2010
Mobile Phone Market Sales of China and Ratio of Smart Phone, 2004-2012E
Market Shares of Major Mobile Phone Manufacturers in China, 2009
Market Shares of Major Smart Phone Manufacturers in China, 2008 vs. 2009
Smart Phone Consumer Group by Age
Smart Phone Consumer Group by Education Background
Smart Phone Consumer Group by Vocation
Smart Phone Consumer Group by Income
Consumers’ Attention on Smart Phone
Smart Phone User Satisfaction with Mobile Phone
Reasons for Consumers to Choose Smart Phone
Frequency of Consumers to Change a Mobile Phone
Consumers’ Attention on Additional Functions of Smart Phone
Consumers’ Attention on Additional Functions of Smart Phone by Gender
Consumers’ Attention on Additional Functions of Smart Phone by Age
Means of Consumers to Obtain Smart Phone Software
Number of Software that Consumer Installs in a Smart Phone
Number of Software that Consumer Installs in a Smart Phone by Gender
Smart Phone Applications Commonly Used by Consumers
Consumer’s Selection of Paid Smart Phone Software
Reasons for Consumers not Choosing Paid Smart Phone Software
Reasons for Consumers not Choosing Smart Phone
Selections for Consumers when Changing the Next Mobile Phone
Smart Phone Prices Accepted by Consumers
Consumers’ Selection of Smart Phone Brands
Means of Consumers to Buy Smart Phone
Means of Consumers to Buy Smart Phone by Age
Consumer’s Attention on Parameter Index while Buying a Smart Phone
Consumer’s Selection of Smart Phone Operating System
Consumer’s Selection of Smart Phone Appearance
Consumer’s Selection of Smart Phone Appearance by Gender
Consumer’s Expectations for Future Smart Phone
Average Selling Price & Operating Margin of Nokia Mobile Phone, 2008Q1-2010Q1
Shipment & Average Price of Nokia Mobile Phone, 2008Q1-2010Q1
Nokia Mobile Phone Shipment by Region, 2008Q1-2010Q1
Nokia Mobile Phone Sales by Region, 2009Q1-2010Q1
Nokia Mobile Phone Shipment in Greater China, 2007Q1-2010Q1
Revenue & Operating Margin of Motorola’s Mobile Phone Division, 2008Q1-2010Q1
Shipment & Average Selling Price of Motorola Mobile Phone, 2008Q1-2010Q1
Motorola Mobile Phone Shipment & Market Share, 2008Q1-2010Q1
Motorola Mobile Phone Revenue by Region, 2009 Q1&Q4-2010Q1
Parts Configurations of Motorola’s Three Models of Mobile Phone
Shipment & Annual Growth Margin of Samsung Mobile Phone, 2001-2009
Quarterly Shipment of Samsung Mobile Phone, 2008Q1-2010Q1
Average Price & Operating Margin of Samsung Mobile Phone, 2007Q1-2010Q1
Shipment & Average Selling Price of Sony Ericsson, 2008Q1-2010Q1
Revenue & Operating Margin of Sony Ericsson, 2008Q1-2010Q1
Mobile Phone Platforms of Sony Ericsson
LG Mobile Phone Shipment & Annual Growth Margin, 2001-2009
Quarterly Sales & Operating Profit of LG Mobile Phone, 2008Q1-2010Q1
LG Mobile Phone Revenue by Region, 2007Q1-2009Q3
RIM Revenue & Gross Margin, FY2004-FY2009
Blackberry User Number Worldwide & RIM Revenue by Region
Blackberry Mobile Phone Sales, FY2004-FY2010
RIM Revenue Structure, FY2005-FY2009
Access Network User Number & Shipment of RIM Mobile Phone, FY2005-FY2009
Apple & RIM Shipment, 2007Q1-2009Q3
Apple Revenue & Net Income, FY2004-FY2009
Apple Revenue Structure by Region, FY2004-FY2008
Apple Revenue Structure by Product, FY2004-FY2009
HTC Revenue & Gross Margin, 2003-2010E
HTC Shipment & Average Price, 2004-2010E
如果这份报告不能满足您的要求,我们还可以为您定制报告,请 留言说明您的详细需求。
|