|
|
|
报告导航:研究报告—
TMT产业—电子半导体
|
|
2010年中国照明光源行业研究报告 |
 |
字数:3.8万 |
页数:77 |
图表数:77 |
|
中文电子版:6500元 |
中文纸版:3250元 |
中文(电子+纸)版:7000元 |
|
英文电子版:1800美元 |
英文纸版:1900美元 |
英文(电子+纸)版:2100美元 |
|
编号:LYY001
|
发布日期:2011-03 |
附件:下载 |
 |
|
|
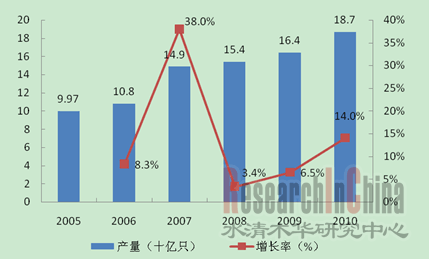
从2001年至2010年,是中国电光源产业快速成长的黄金十年,产业规模得到最大化扩张。2010年,中国电光源年总产量接近187亿只,总产值超过720亿元。
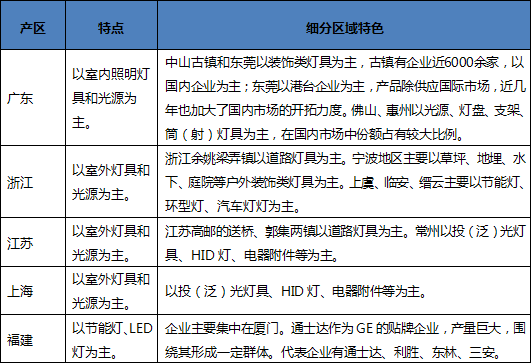
图表 2005-2010年中国电光源(灯泡)产量及其增长率  数据来源:中国照明学会;整理:水清木华研究中心 2010年行业总资产达到483亿元,比2009年增长28%。产业规模的迅速扩张,一方面是由于原有企业自身规模的扩大,另一方面更是由于大量外围企业的纷纷涌入。2010年中国电光源企业数量达到931家,比2009年增长16% 。 近年来中国电光源企业发生了较大的变化:东北、西北、西南等地企业逐渐萎缩,原来只有西藏、海南、宁夏三省区无电光源生产企业,现在己增加到10余个省市。电光源行业经过整合,目前基本集中在珠江三角洲和长江三角洲两个地区,成为全球最大的电光源产业区域基地。 广东、江苏、上海、浙江、福建等沿海省市成为主要产区,并形成一些产品特色区域。
图表 中国五大照明光源主产区及其特点 整理:水清木华研究中心
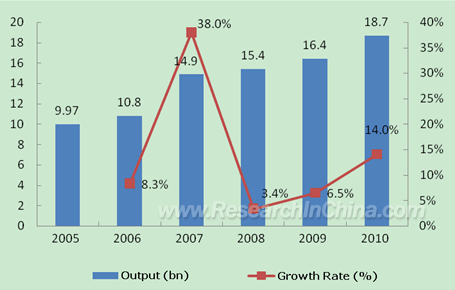
During 2001-2010, Chinese electric light source industry witnessed rapid growth with the maximized expansion of industrial scale. In 2010, the annual output of electric light source in China approximated 18.7 billion, and the total output value surpassed RMB72 billion.
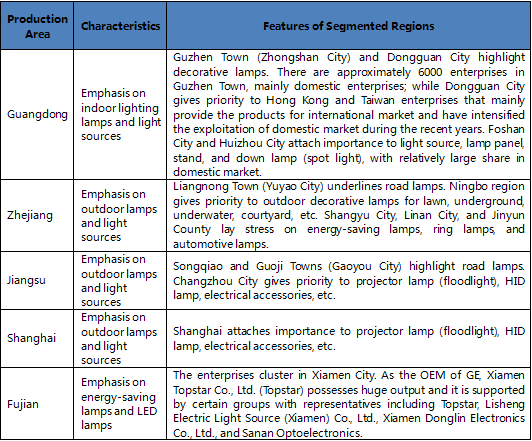
Output and Growth Rate of Electric Light Source (Bulb) in China, 2005-2010  Source: China Illuminating Engineering Society (CIES); ResearchInChina The total assets of the industry reached RMB48.3 billion in 2010, up 28% against 2009. The fast expansion of the industrial scale lied in the growing scale of original enterprises as well as the successive surge of peripheral enterprises. In 2010, the number of electric light source enterprises in China registered 931, an increase of 16% from 2009. Chinese electric light source enterprises have undergone great changes in recent years. Enterprises in such places as the northeast, northwest, and southwest regions have gradually shrunken, and the quantity of provinces without electric light source manufacturers has exceeded 10 from the former three provinces of Tibet, Hainan, and Ningxia. After integration, electric light source industry nowadays is basically centralized in Pearl River Delta and Yangtze River Delta which become the major regional bases of electric light source industry around the globe. Such coastal provinces and cities as Guangdong, Jiangsu, Shanghai, Zhejiang, and Fujian have been turned into major production areas and shaped certain characteristic regions.
Top 5 Lighting Source Production Areas and Characteristics in China  Source: ResearchInChina
第一章 中国电光源制造行业概述
1.1 电光源制造业定义及数据来源说明
1.2 中国电光源制造行业整体情况
1.2.1 地理分布情况
1.2.2 行业规模情况
1.3 中国电光源制造行业政策分析
1.3.1 中国照明行业“十二五”规划
1.3.2 财政补贴政策
1.3.3 环保要求
1.3.4 产业标准
1.4 中国LED照明产业政策分析
1.4.1 中国LED照明产业政策
1.4.2 中国LED照明产业标准体系建设
第二章 中国电光源制造行业市场分析
2.1 中国电光源制造行业市场规模
2.1.1中国电光源产量情况
2.1.2 中国电光源销售情况
2.1.3中国电光源进出口情况
2.2 中国电光源制造行业细分产品市场规模
2.2.1 白炽灯发展及市场现状
2.2.2 荧光灯发展及市场现状
2.2.3 其他类型电光源发展及市场现状
2.3 中国LED照明市场分析
2.3.1 中国LED照明产业发展状况
2.3.2 中国LED照明产业经营数据
第三章 中国电光源制造行业竞争分析
3.1 行业竞争格局分析
3.1.1 整体竞争情况
3.1.2 市场集中度分析
3.2 全球及中国白炽灯禁用进度及白炽灯替代进程
3.2.1 白炽灯淘汰时间表
3.2.2 白炽灯、荧光灯、LED灯的替代进程
3.3 中国LED 照明产业竞争分析
3.3.1 MOCVD设备定货量
3.3.2 LED芯片市场
3.3.3 LED封装市场
3.3.4 LED应用市场
第四章 中国电光源制造行业区域运行分析
4.1 区域综述
4.2 华东地区电光源市场
4.3 华南地区电光源市场
4.4 华中地区电光源市场
4.5 西南地区电光源市场
4.6 西北地区电光源市场
4.7 东北地区电光源市场
4.8 华北地区电光源市场
第五章 中国电光源制造行业重点企业分析
5.1 浙江阳光集团股份有限公司
5.1.1 公司简介
5.1.2 经营情况
5.1.3 2011年经营要点
5.1.4 最近3 年主要投资方向
5.2 佛山电器电光源股份有限公司
5.2.1 公司简介
5.2.2 经营情况
5.2.3 公司重大事项
5.3 广东雪莱特光电科技股份有限公司
5.3.1 公司简介
5.3.2 经营情况
5.3.3 公司重大事项
5.4 光磊
5.4.1 公司简介
5.4.2 经营情况
5.4.3 光磊与Nichia 代工营运模式介绍
5.4.4 进入大型灯光系统/显示幕领域
5.5 亿光
5.5.1 公司简介
5.5.2 经营情况
5.6 晶元光电
5.6.1 公司简介
5.6.2 经营情况
5.7 欧司朗(中国)有限公司
5.7.1 欧司朗(OSRAM)简介
5.7.2 欧司朗(OSRAM)在中国的情况
5.8 飞利浦电光源
5.8.1 公司简介
5.8.2 飞利浦照明在中国的情况
1 Overview of Electric Light Source Manufacturing in China
1.1 Definition and Data Source
1.2 Profile
1.2.1 Geographic Distribution
1.2.2 Industrial Scale
1.3 Policy Analysis
1.3.1 The 12th Five-Year Plan
1.3.2 Fiscal Subsidy
1.3.3 Environment-friendly Request
1.3.4 Industrial Standards
1.4 Policy Analysis of LED Lighting Industry in China
1.4.1 Policies
1.4.2 Standard System Construction
2 Market Analysis of Electric Light Source Manufacturing in China
2.1 Market Size
2.1.1 Output
2.1.2 Sales
2.1.3 Import & Export
2.2 Market Size of Product Segments
2.2.1 Development and Status Quo of Incandescent Lamp
2.2.2 Development and Status Quo of Fluorescent Lamp
2.2.3 Development and Status Quo of Other Electric Light Sources
2.3 China LED Lighting Market Analysis
2.3.1 Development
2.3.2 Operation Data
3 Competition Analysis of Electric Light Source Manufacturing in China
3.1 Competition Pattern
3.1.1 Overview
3.1.2 Market Concentration
3.2 Incandescent Lamp Prohibition Progress and Substitute Process in China and Beyond
3.2.1 Elimination Schedule
3.2.2 Substitute Process of Incandescent Lamp, Fluorescent Lamp, and LED Lamp
3.3 Competition Analysis of China LED Lighting Industry
3.3.1 Order Quantity of MOCVD Equipment
3.3.2 LED Chip Market
3.3.3 LED Packaging Market
3.3.4 LED Application Market
4 Regional Operation of Electric Light Source Manufacturing in China
4.1 Overview
4.2 East China
4.3 South China
4.4 Central China
4.5 Southwest China
4.6 Northwest China
4.7 Northeast China
4.8 North China
5 Key Enterprises
5.1 Zhejiang Yankon Group Co., Ltd.
5.1.1 Profile
5.1.2 Operation
5.1.3 Operating Points in 2011
5.1.4 Major Investment Orientations in Recent 3 Years
5.2 Foshan Lighting
5.2.1 Profile
5.2.2 Operation
5.2.3 Major Events
5.3 Cnlight
5.3.1 Profile
5.3.2 Operation
5.3.3 Major Events
5.4 OPTOTECH
5.4.1 Profile
5.4.2 Operation
5.4.3 Nichia OEM
5.4.4 Access into Large-scale Lighting System/Display Curtain Field
5.5 Everlight Electronics
5.5.1 Profile
5.5.2 Operation
5.6 Epistar
5.6.1 Profile
5.6.2 Operation
5.7 OSRAM China Lighting Ltd.
5.7.1 OSRAM Profile
5.7.2 OSRAM in China
5.8 Philips Lighting
5.8.1 Profile
5.8.2 Development in China
图表 中国五大电光源主产区分布及其特点
图表 2005-2010年中国电光源企业资产总计及其增长率
图表 2005-2010年中国电光源企业数量统计及其增长率
图表 中国电光源产业国家标准统计表
图表 中国电光源产业行业标准统计表
图表 2005-2010年中国电光源(灯泡)产量及其增长率统计
图表 2005-2010年中国电光源(灯泡)总产值及其增长率统计
图表 2005-2010年中国电光源(灯泡)销售收入及其增长率统计
图表 2005-2010年中国电光源(灯泡)产销率统计
图表 2005-2010年中国电光源(灯泡)进出口总额统计
图表 2010年中国电光源(灯泡)主要商品海关进出口额
图表 2007-2010中国白炽灯产量及增长率统计
图表 2006-2013年中国荧光灯产量及其预测
图表 2006-2013年我国荧光灯产品结构变化情况
图表 2010年中国LED行业发展状况统计
图表 2010年中国LED照明产业产值统计
图表 2010年度中国LED主要产品种类产量统计
图表 中国电光源市场三大阵营
图表 2010年中国国内品牌公司前三强销售收入情况
图表 国家和地区禁用(禁售) 白炽灯泡进度统计
图表 几种照明方式效能对比
图表 白炽灯、荧光灯和 LED灯使用 10000小时成本对比
图表 LED灯和荧光灯的对比消长
图表 全球LED芯片市场主要生产厂商销售份额统计
图表 2010年中国LED芯片产量及芯片国产率
图表 中国LED封装市场规模及增长率变化
图表 2010年中国LED应用领域产值
图表 2010年中国LED照明应用领域分布
图表 2010年中国主要省份电光源(灯泡)产量统计
图表 2010年中国各区域电光源(灯泡)产量统计
图表 2010年中国各区域电光源(灯泡)产量比重统计
图表 2006-2010年中国华东地区电光源(灯泡)产量及其增长率统计
图表 2010年华东各省份电光源(灯泡)产量统计
图表 2010年华东各省份电光源(灯泡)生产份额统计
图表 2005-2010年中国华南地区电光源(灯泡)产量及其增长率统计
图表 2005-2010年中国华中地区电光源(灯泡)产量及其增长率统计
图表 2010年华中各省份电光源(灯泡)产量统计
图表 2010年华中各省份电光源(灯泡)生产份额统计
图表 2005-2010年中国西南地区电光源(灯泡)产量及其增长率统计
图表 2005-2010年中国东北地区电光源(灯泡)产量及其增长率统计
图表 2005-2010年中国华北地区电光源(灯泡)产量及其增长率统计
图表 2006-2010年华北地区主要电光源生产省市产量统计(单位:亿只)
图表 2008-2010年阳光照明公司经营情况统计
图表 2010年阳光照明公司主要财务指标
图表 2010年阳光照明主营业务分行业、产品情况
图表 2010年阳光照明公司主营业务分地区情况
图表 2010年阳光照明公司主营业务地区占比
图表 2010Q2佛山照明营业收入情况
图表 2010Q2佛山照明主要财务指标
图表 2010Q2佛山照明主营业务分地区情况
图表 2008-2010年雪莱特经营情况统计
图表 2010Q2雪莱特主要财务指标
图表 2010Q2雪莱特主营业务分行业、分产品经营情况
图表 2010Q2雪莱特主营业务分地区情况
图表 2010Q2雪莱特主营业务地区占比
图表 2007-2010年光磊主要财务数据
图表 2006-2010年光磊细分产品营收统计
图表 2010年光磊五大产品领域占营收比重
图表 光磊产品领域代表产品
图表 光磊各地区营收比重
图表 LED产业上、中、下游业营运方式
图表 光磊LED产品切入北京奥运大型灯光系统/显示屏示意图
图表 2002-2010年亿光收入与运营利润率统计
图表 2006-2010年亿光主要财务指标
图表 2008-2010年亿光产品收入结构
图表 2005-2010年亿光产品下游应用比例结构
图表 2005-2010年晶元光电收入与运营利润率统计
图表 2009-2011晶元光电主要财务指标
图表 2010-2011年晶元光电产品组合
图表 2010-2012年晶元光电LED TV市场情况
图表 2008-2010欧司朗营业收入及利润率统计
图表 欧司朗国际化成果
图表 2009年欧司朗发达国家市场和新兴市场的销售占比
图表 欧司朗低成本地区职员占企业总人员比例
图表 飞利浦LED销售额状况
图表 飞利浦电子(中国)集团在中国主要投资地区
图表 飞利浦电子(中国)集团在中国主要投资企业
Top 5 Electric Light Source Production Areas and Characteristics in China
Total Assets and Growth Rate of Electric Light Source Enterprises in China, 2005-2010
Quantity and Growth Rate of Electric Light Source Enterprises in China, 2005-2010
National Standard Statistics of Chinese Electric Light Source Industry
Industrial Standard Statistics of Chinese Electric Light Source Industry
Output and Growth Rate of Electric Light Source (Bulb) in China, 2005-2010
Total Output Value and Growth Rate of Electric Light Source (Bulb) in China, 2005-2010
Revenue and Growth Rate of Electric Light Source (Bulb) in China, 2005-2010
Output/Sales Ratio of Electric Light Source (Bulb) in China, 2005-2010
Total Foreign Trade Value of Electric Light Source (Bulb) in China, 2005-2010
Customs Import & Export Value of Major Electric Light Source (Bulb) Commodities in China, 2010
Output and Growth Rate of Incandescent Lamp in China, 2007-2010
Output of Fluorescent Lamp in China, 2006-2013E
Product Structure of Fluorescent Lamp in China, 2006-2013E
Chinese LED Industry Development, 2010
Output Value of LED Lighting Industry in China, 2010
Output of Major LED Products (by Type) in China, 2010
Top 3 Camps in Chinese Electric Light Source Market
Revenue of Top 3 Domestic Brand Companies in China, 2010
Incandescent Lamp Prohibition (Sales Ban) Progress by Country and Region
Efficiency Comparison among Several Lighting Modes
Cost Comparison among Incandescent Lamp, Fluorescent Lamp and LED Lamp after the Service Life of 10000 Hours
Comparison between LED Lamp and Fluorescent Lamp
Market Share of Global Major LED Chip Manufacturers by Sales
LED Chip Output and Localization Rate in China, 2010
Market Size and Growth Rate of LED Packaging in China
Output Value of LED Applications in China, 2010
Distribution of LED Applications in China, 2010
Electric Light Source (Bulb) Output of Major Provinces in China, 2010
Electric Light Source (Bulb) Output by Region in China, 2010
Output Proportion of Electric Light Source (Bulb) in China by Region, 2010
Output and Growth Rate of Electric Light Source (Bulb) in East China, 2006-2010
Output of Electric Light Source (Bulb) in East China by Province, 2010
Production Shares of Electric Light Source (Bulb) in East China by Province, 2010
Output and Growth Rate of Electric Light Source (Bulb) in South China, 2005-2010
Output and Growth Rate of Electric Light Source (Bulb) in Central China, 2005-2010
Output of Electric Light Source (Bulb) in Central China by Province, 2010
Production Shares of Electric Light Source (Bulb) in Central China by Province, 2010
Output and Growth Rate of Electric Light Source (Bulb) in Southwest Region, 2005-2010
Output and Growth Rate of Electric Light Source (Bulb) in Northeast Region, 2005-2010
Output and Growth Rate of Electric Light Source (Bulb) in North China, 2005-2010
Electric Light Source (Bulb) Output in North China by Provinces and Cities, 2006-2010
Operation of Zhejiang Yankon Group Co., Ltd., 2008-2010
Major Financial Indices of Zhejiang Yankon Group Co., Ltd., 2010
Main Business of Zhejiang Yankon Group Co., Ltd. by Sector and Product, 2010
Main Business of Zhejiang Yankon Group Co., Ltd. by Region, 2010
Main Business Structure of Zhejiang Yankon Group Co., Ltd. by Region, 2010
Operating Income of Foshan Lighting, 2010Q2
Major Financial Indices of Foshan Lighting, 2010Q2
Main Business of Foshan Lighting by Region, 2010Q2
Cnlight Operation, 2008-2010
Major Financial Indices of Cnlight, 2010Q2
Main Business of Cnlight by Sector and Product, 2010Q2
Main Business of Cnlight by Region, 2010Q2
Main Business Structure of Cnlight by Region, 2010Q2
Major Financial Data of OPTOTECH, 2007-2010
Operating Income of OPTOTECH by Product, 2006-2010
Operating Income Proportion of OPTOTECH Top 5 Product Fields, 2010
Representatives of OPTOTECH Product Fields
Operating Income Proportion of OPTOTECH by Region
Operating Modes of LED Upstream, Midstream, and Downstream Industries
Sketch Map of OPTOTECH LED Product Application in Large-scale Lighting System/Display of Beijing Olympics
Revenue and Operating Margin of Everlight Electronics, 2002-2010
Major Financial Indices of Everlight Electronics, 2006-2010
Revenue Structure of Everlight Electronics by Product, 2008-2010
Application Structure of Everlight Electronics by Product, 2005-2010
Revenue and Operating Margin of Epistar, 2005-2010
Major Financial Indices of Epistar, 2009-2011
Epistar Product Mix, 2010-2011
Epistar LED TV Market, 2010-2012E
OSRAM Operating Income and Profit Margin, 2008-2010
Internationalized Achievements of OSRAM
Sales Proportion of OSRAM in Developed Countries and Emerging Markets, 2009
Employee Proportion of OSRAM in Low-Cost Regions
Philips LED Sales
Major Investment Regions of Philips Electronics China Group
Major Investment Enterprises of Philips Electronics China Group
如果这份报告不能满足您的要求,我们还可以为您定制报告,请 留言说明您的详细需求。
|