|
|
|
报告导航:研究报告—
金融与服务业—零售与日用
|
|
2010-2011年中国体育用品行业研究报告 |
 |
字数:2.0万 |
页数:55 |
图表数:74 |
|
中文电子版:5000元 |
中文纸版:2500元 |
中文(电子+纸)版:5500元 |
|
英文电子版:1700美元 |
英文纸版:1800美元 |
英文(电子+纸)版:2000美元 |
|
编号:ZJF018
|
发布日期:2011-03 |
附件:下载 |
 |
|
|
近年来,随着北京奥运会、广州亚运会的举办,包括运动鞋、运动服装以及体育器械在内的中国体育用品市场也随之被拉动起来,呈现快速发展的状态。根据《2010-2011年中国体育用品行业研究报告》的分析,2010年中国体育用品产业的市场规模为1061亿元。 图:2006-2013年中国体育用品行业市场规模(十亿人民币) 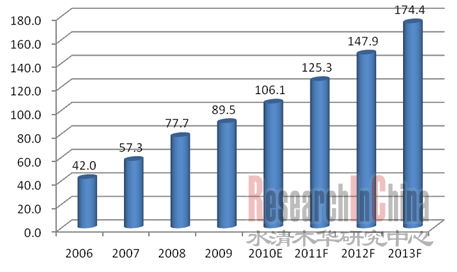 来源:水清木华研究中心 中国体育用品市场以鞋类和服装为主,知名的体育用品品牌有阿迪达斯、耐克、李宁、安踏、匹克等。其中耐克和阿迪达斯以高端市场为主,其质量和品牌优势使其多年占据着市场前两把交椅。李宁作为较早进入体育用品市场的品牌,近年来重视产品质量和市场营销,逐步摆脱了低价竞争的重围,获得不错的成绩。现已取代阿迪达斯成为中国第二大体育用品品牌。 在中国体育服装市场,耐克、阿迪达斯、卡帕、彪马以及斐乐等品牌占据着高端市场,市场价格大约在400元/件以上;而中端市场主要由安踏和李宁占据,售价大约在200-400元/件;在200元以下的低端消费市场,典型厂商有特步、匹克、361°以及鸿星尔克等。 在中国运动鞋市场上,按照品牌来分主要有包括耐克、阿迪达斯、彪马、锐步、斐乐、美津浓、茵宝、卡帕等国外品牌;以及李宁、安踏、特步、361度、鸿星尔克、匹克、乔丹、德尔惠、贵人鸟等国内品牌。耐克、阿迪达斯、锐步等品牌占据着高端市场,其市场价格大约在500元/双以上;中端市场主要有卡帕和李宁占据,他们的售价大约在300-500元/双;在300元以下的低端消费市场,则聚集着数量众多的本地品牌。 目前,年销售超过1,000万双的中国运动鞋生产企业约十几家,年销售在几十万至几百万双的企业有近百家。从地域上看,运动鞋的生产研制已形成了以福建泉州、广东东莞为代表的产业集群。以泉州地区为核心的产业集群,年总产量约14 亿双。泉州地区集中了国内大部分知名运动鞋品牌。以东莞地区为核心的产业集群,年总产量约8 亿双,该产业集群多以给国外知名品牌贴牌生产为主。
In recent years, Chinese sporting goods market (inclusive of sports
footwear, sports apparel and sports equipment) has seen rapid
development driven by Beijing Olympic Games and Guangzhou Asian Games.
In 2010, the scale of Chinese Sporting Goods market reached RMB106.1
billion.
Market Scale of China Sporting Goods Industry, 2006-2013F(RMB bn) 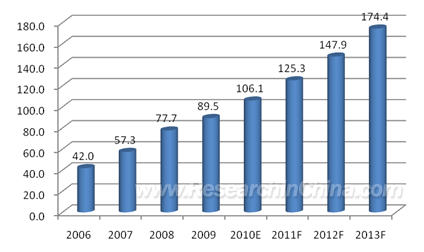 Source: ResearchInChina In
Chinese sporting goods market, famous brands consist of Nike, Adidas,
Li Ning, Anta, Peak, etc., all of them are engaged in sports shoes and
sportswear. Nike and ADIDAS focus on the high-end market, their product
quality and brand superiority make them take the leading positions for
many years. Li Ning entered the sporting goods market earlier, and it
has in recent years attached importance to the product quality and
marketing, and has gone out of the low-price competition and made
brilliant achievements. Now, Li Ning has replaced ADIDAS to become the
second well-known sporting goods brand in China. As for the
sports apparel market in China, Nike, ADIDAS, Kappa, Puma and Fila
occupy the high-end market, the unit price is about RMB400 or more. The
medium-end market is dominated by Li Ning and Anta, and the unit price
is roughly between RMB200-400. In the low-end market, XTEP, Peak, 361 °,
and ERKE are typical vendors, and the unit price is less than RMB200. In
the sports footwear market in China, the brands include foreign brands
(Nike, ADIDAS, Puma, Reebok, Fila, Mizuno, Umbro, Kappa) and local
brands (Li Ning, Anta, XTEP, 361 Degrees, ERKE, Peak, Jordan, Deerway,
Guirenniao). NIKE, ADIDAS and Reebok occupy the high-end market, and the
unit price is about RMB500 or more. The medium-end market is dominated
by Kappa and Li Ning, and the unit price is RMB300-500. In the low-end
market, there are many local brands, and the unit price is less than
RMB300. In China, over 10 manufacturers sell more than 10 million
pairs of sports shoes apiece every year, nearly one hundred companies
sell hundreds of thousands or even several million pairs of shoes each
year. On a regional basis, Quanzhou (Fujian)-centered and Dongguan
(Guangdong)-centered industrial clusters have emerged. The annual output
of Quanzhou-centered cluster is 1.4 billion pairs. Most well-known
domestic sports shoes brands are located in Quanzhou. The annual output
of Dongguan-centered cluster is about 800 million pairs, and the cluster
focus on OEM service for famous foreign brands.
第一章 中国体育产业的发展现状
1.1中国体育产业的总体发展现状
1.2 中国体育用品行业现状
第二章 中国体育用品行业发展前景
2.1 中国体育用品行业发展潜力
2.2 中国体育用品行业政策分析
第三章 体育用品行业细分市场分析
3.1 运动鞋行业分析
3.2 体育服装行业分析
3.3 体育器械行业分析
第四章 中国体育用品零售格局
4.1 中国体育用品零售方式
4.2 中国体育用品零售店对比
4.3 中国体育用品零售店重点城市
第五章 体育用品行业主要公司分析
5.1信隆实业
5.1.1 公司简介
5.2.2 经营状况
5.2探路者
5.2.1 公司简介
5.2.2 经营状况
5.2.3 零售店经营状况
5.3李宁
5.3.1 公司简介
5.3.2 经营状况
5.3.3 零售店经营状况
5.4 鸿星尔克
5.4.1 公司简介
5.4.2 经营状况
5.4.3 零售店经营状况
5.5 安踏
5.5.1 公司简介
5.5.2 经营状况
5.5.3 零售店经营状况
5.6 匹克
5.6.1 公司简介
5.6.2 经营状况
5.6.3 零售店经营状况
5.7 361度
5.7.1 公司简介
5.7.2 经营状况
5.7.3 零售店经营状况
5.8 特步
5.8.1 公司简介
5.8.2 经营状况
5.8.3 零售店经营状况
5.9 中国动向
5.9.1 公司简介
5.9.2 经营状况
5.9.3 零售店经营状况
5.10 NIKE
5.10.1 公司简介
5.10.2 经营状况
5.10.3 耐克中国
5.11 ADIDAS
5.11.1 公司简介
5.11.2 经营状况
5.11.3 分产品类别状况
5.11.4 阿迪达斯中国
1 Evolution of China Sports Industry
1.1 Overall Development of China Sports Industry
1.2 Status Quo of China Sporting Goods Industry
2 Prospect of China Sporting Goods Industry
2.1 Potential
2.2 Policy
3 Market Segments of Sporting Goods Industry
3.1 Sports Shoes
3.2 Sports Apparel
3.3 Sports Equipment
4 Retail Pattern of Chinese Sporting Goods
4.1 Retail Modes
4.2 Retail Stores
4.3 Key Cities
5 Key Enterprises in Sporting Goods Industry
5.1 HL CORP
5.1.1 Profile
5.2.2 Operation
5.2 TOREAD
5.2.1 Profile
5.2.2 Operation
5.2.3 Operation of Retail Stores
5.3Li Ning
5.3.1 Profile
5.3.2 Operation
5.3.3 Operation of Retail Stores
5.4 ERKE
5.4.1 Profile
5.4.2 Operation
5.4.3 Operation of Retail Stores
5.5 Anta
5.5.1 Profile
5.5.2 Operation
5.5.3 Operation of Retail Stores
5.6 Peak
5.6.1 Profile
5.6.2 Operation
5.6.3 Operation of Retail Stores
5.7 361 Degrees
5.7.1 Profile
5.7.2 Operation
5.7.3 Operation of Retail Stores
5.8 XTEP
5.8.1 Profile
5.8.2 Operation
5.8.3 Operation of Retail Stores
5.9 CHINA DONGXIANG
5.9.1 Profile
5.9.2 Operation
5.9.3 Operation of Retail Stores
5.10 NIKE
5.10.1 Profile
5.10.2 Operation
5.10.3 NIKE CHINA
5.11 ADIDAS
5.11.1 Profile
5.11.2 Operation
5.11.3 Products
5.11.4 ADIDAS China
表:我国城乡居民体育消费情况
图:2006-2013年中国体育用品行业市场规模(十亿人民币)
图:2010年中国体育用品行业市场分布,按产品类别(十亿人民币)
图:2010年中国体育用品行业市场分布,按品牌(百万人民币)
表:2010年城乡居民收入变化分析表
表:“十一五”期间农村居民家庭收入生活消费水平比较(单位:元/人)
表:我国城镇居民家庭人均每年教育、文化、体育、娱乐支出情况(人民币)
表:国务院《关于加快发展体育产业的指导意见》主要内容表列
图:2006-2013年中国运动鞋行业市场规模(十亿人民币)
图:中国运动鞋市场主要品牌区隔
表:中国主要鞋类品牌竞争分析
图:2006-2013年中国运动服装行业市场规模(十亿人民币)
图:中国运动服装市场主要品牌区隔
图:2006-2013年中国运动器械行业市场规模(十亿人民币)
图:2010年中国体育用品企业零售店数量
图:2001-2010年一线城市体育用品零售额的复合增长率
图:2001-2010年中国部分二、三线城市体育用品零售额复合增长率
表:信隆实业 2009-2010年经营业绩(RMB)
图:2007-2010年探路者公司经营数据统计(百万人民币)
图:2010年探路者收入及利润按产品分布
图:2010年探路者公司主营业务分地区情况(百万人民币)
图:探路者经营体系的“微笑曲线”
图:2006-2010年探路者销售门店数目变化走势
图:2004-2010年李宁集团销售收入走势(百万人民币)
图:2010年李宁集团旗下品牌销售额统计(百万人民币)
图:2005-2010年李宁销售门店数目变化走势
图:2010年李宁品牌销售额按地区统计(百万人民币)
图:2006-2010年鸿兴尔克销售收入走势(百万人民币)
图:2010年上半年中国鸿星营业额分种类占比统计(百万人民币)
图:2009-2010年中国鸿星销量分种类统计
图:2006-2010年中国鸿星销售门店数目变化走势
图:2005-2010年安踏经营溢利统计(百万人民币)
图:2010年安踏营业额按地区统计(百万人民币)
图:2010年安踏营业额按种类统计(百万人民币)
图:2010年安踏中国零售店网络分布图
图:2006-2010安踏店总销售面积统计(m2)
图:2006-2010年安踏店数目变化走势
图:2006-2010年匹克销售收入走势(百万人民币)
图:2010年上半年匹克营业额分种类统计
图:2010年上半年匹克营业额分地区统计(百万人民币)
图:2006-2010年匹克店面数量变化图
图:2006-2011财年361度营业收入情况(百万人民币)
图:2006-2011财年361度利润变化走势(百万人民币)
图:2011上半财年361度收入构成,按产品分(百万人民币)
图:2006-2011财年末361度销售门店数目变化走势
图:2010年末361度各地区零售店分布
图:2005-2010年特步公司营业收入变化走势(百万人民币)
图:2006-2010年特步门店数目变化走势
表:截至2010上半年特步全国主要门店分布状况
图:2005-2010年中国动向营业收入变化走势(百万人民币)
图:2010上半年中国动向销售收入地区分布(百万人民币)
图:2010上半年中国分部Kappa品牌收入情况(分类别)(百万人民币)
图:2010上半年日本分部各品牌收入情况(百万人民币)
图:2006-2010年中国动向国内Kappa门店数目变化走势
图:2010上半年中国动向零售店分布
图:2005-2011财年耐克公司收入情况(百万美元)
图:2011上半财年耐克收入产品分布情况(百万美元)
图:2008-2011财年耐克大中华区收入情况(百万美元)
图:2011上半财年耐克大中华区收入产品分布情况(百万美元)
图:2004-2010年阿迪达斯收入及增长率状况(百万欧元)
图:2010年阿迪达斯公司收入构成,按产品分(百万欧元)
图:2010年阿迪达斯公司收入构成,按旗下品牌分(百万欧元)
图:2010年阿迪达斯鞋产品生产地区分布
图:2006-2010年阿迪达斯鞋产量(m pairs)
图:2010年阿迪达斯服装产品生产地区分布
图:2006-2010年阿迪达斯服装产量(m units)
图:2009-2010年阿迪达斯在华主要业务分布(百万欧元)
Sports Consumption of Urban and Rural Residents
Market Scale of China Sporting Goods Industry, 2006-2013E
Market Distribution of China Sporting Goods Industry by Product, 2010
Market Distribution of China Sporting Goods Industry by Brand, 2010
Income of Urban and Rural Residents, 2010
Income and Consumption of Rural Households during "Eleventh Five-Year" Period
Annual Per Capita Expenditure of Urban Households on Education, Culture, Sports and Entertainment in China
Opinions of the State Council on Accelerating Development of Sports Industry
Market Scale of Chinese Sports Shoes Industry, 2006-2013E
Major Brands in Chinese Sports Shoes Market
Competition among Major Sports Shoes Brands in China
Market Scale of China Sportswear Industry, 2006-2013E
Major Brands in Chinese Sportswear Market
Market Scale of China Sports Equipment Industry, 2006-2013E
Number of Retail Stores of Chinese Sporting Goods Enterprises, 2010
Compound Growth Rate of Retail Sales Revenue of Sporting Goods in Tier-I Cities of China, 2001-2010
Compound Growth Rate of Retail Sales Revenue of Sporting Goods in Some Tier-II and Tier-III Cities of China, 2001-2010
HL's Financial Data, 2009-2010
TOREAD's Financial Data, 2007-2010
TOREAD's Revenue and Profit by Product, 2010
TOREAD's Main Business (by Region), 2010
"Smile Curve"of TOREAD's Operating System
Number of TOREAD's Outlets, 2006-2010
Sales of Li Ning, 2004-2010
Sales of Li Ning by Brand,2010
Number of Outlets of Li Ning, 2005-2010
Sales of Li Ning by Brand and Region,2010
ERKE's Sales, 2006-2010
ERKE's Sales by Product, H1 2010
ERKE's Sales Volume by Product, 2009-2010
Number of ERKE's Outlets, 2006-2010
Anta’s Operating Profit, 2005-2010
Anta’s Turnover (by Region), 2010
Anta’s Turnover (by Product), 2010
Distribution of Anta’s Retail Stores in China, 2010
Anta’s Total Sales Area, 2006-2010
Number of Anta’s Outlets, 2006-2010
Peak’s Sales, 2006-2010
Peak’s Turnover (by Product), H1 2010
Peak’s Turnover (by Region) , H1 2010
Number of Peak’s Outlets, 2006-2010
Operating Income of 361 Degrees, FY2006-FY2011
Profit of 361 Degrees, FY2006-FY2011
Revenue of 361 Degrees (by Product), H1 FY2011
Number of Outlets of 361 Degrees, FY2006-FY2011
Distribution of Retail Stores of 361 Degrees in China, 2010
XTEP’s Operating Income, 2005-2010
Number of XTEP’s Outlets, 2006-2010
Distribution of XTEP’s Outlets in China, H1 2010
Operating Income of China Dongxiang, 2005-2010
Revenue of China Dongxiang by Region, H1 2010
Kappa’s Revenue by Brand in China, H1 2010
Revenue of Brands in Japan, H1 2010
Number of Kappa Outlets of China Dongxiang in China, 2006-2010
Distribution of Retail Stores of China Dongxiang, H1 2010
Nike's Revenue, FY2005-FY2011
Nike's Revenue (by Product), H1 FY2011
Nike's Revenue in Greater China , FY2008-FY2011
Nike's Revenue in Greater China (by Product), H1 FY2011
Adidas' Revenue and Growth Rate, 2004-2010
Adidas' Revenue Structure (by Product), 2010
Adidas' Revenue Structure (by Brand), 2010
Geographical Distribution of Production Places of Adidas Shoes, 2010
Output of Adidas Shoes,2006-2010
Geographical Distribution of Production Places of Adidas Clothes,2010
Output of Adidas Clothes, 2006-2010
Main Business of Adidas Clothes in China, 2009-2010
如果这份报告不能满足您的要求,我们还可以为您定制报告,请 留言说明您的详细需求。
|