为了解本土手机设计厂商(IDH)的发展现状和趋势,《手机报》与水清木华研究中心于2011年3月共同组织了一次手机设计厂商(IDH)调查,共回收了56份有效问卷。
这次调查的主要内容有:
1. 贵公司是否有自有手机品牌?
2. 贵公司选择自建手机品牌的原因?
3. 贵司全职员工规模?
4. 贵公司研发成本占净销售额的比例?
5. 贵公司2010年手机的出货量范围?
6. 贵公司的手机产品2010年销量增长?
7. 贵公司参与产品研发的员工占总员工数的比例?
8. 您主要通过哪些方式推广您的产品?
9. 贵公司参与产品推广的员工占总员工数的比例?
10. 贵公司的手机产品主要面向哪些地区出货?
11. 贵公司在2011年主要面向哪些地区出货?
12. 贵公司手机产品国外销售占全部营收的比例?
13. 您认为贵公司的产品相比一线国际厂商存在哪些优势?
14. 您认为贵公司的产品相比一线国际厂商存在哪些不足?
15. 贵司手机产品的平均设计生产周期?
16. 贵公司的主力机型定价区间(出厂价)是?
17. 贵公司2010年主要采用哪些厂商的芯片方案?
18. 贵公司2011年将采用哪些厂商的芯片方案?
19. 贵公司手机方案是否采用单独的应用处理器?
20. 贵公司倾向于采用哪一家的应用处理器?
21. 贵公司的平板电脑战略?
22. 贵公司平板电脑方案?
23. 贵公司的智能手机市场战略?
24. 贵公司的智能手机操作系统战略?
25. 贵公司智能手机上市的时间?
26. 贵公司的3G手机策略?
27. 贵公司将采用哪种3G制式?
28. 您认为下面哪些因素能体现手机差异化?
29. 您认为未来手机产业中哪个环节将占据主导地位?
30. 贵公司在品牌宣传方面的费用预算?
31. 贵公司目前采用哪种渠道方式进行销售?
32. 贵公司的智能手机产品计划内置什么软件商店?
33. 您认为本土手机厂商中(不包含上市公司)出货量前几名的厂商有哪些?出货量是多少?
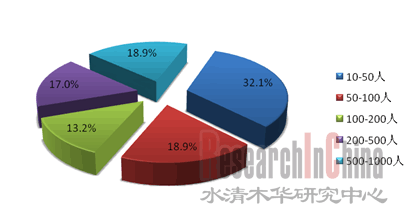
此次调查样本基本覆盖了各种规模的本土手机设计(IDH)企业,其中10-50人的小型企业最多,达到32.1%,而500-1000人的中大型企业占总样本数的18.9%。
图:2010年本土手机设计厂商员工规模分布 
来源:《手机报》,水清木华研究中心
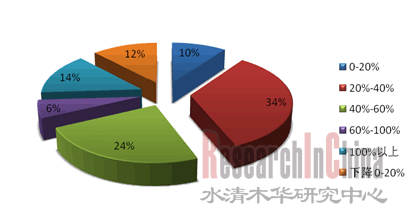
调查发现,2010年中有34%的企业销售增长率保持在20%-40%,24%的企业维持了40%-60%的较高增长率。总体来看,2010年这些本土手机设计厂商仍然处于上升的阶段。
图:2010年本土手机设计厂商销售增长率 
来源:《手机报》,水清木华研究中心
To find out the development status and trends of local independent
design houses (IDH), Mobile Phone Journal and ResearchInChina
implemented an IDH survey jointly in March 2011.
Questionnaire:
1. Do you have your own mobile phone brand?
2. Why do you build your own mobile phone brand?
3. How many employees do you have?
4. What is the proportion of R & D cost in your net sales?
5. How about your mobile phone shipment in 2010?
6. How about your mobile phone sales growth in 2010?
7. What is the proportion of R & D personnel in your staff?
8. How do you promote your products?
9. What is the proportion of promotion personnel in your staff?
10. Where do you sell your mobile phones?
11. Where do you sell your mobile phones in 2011?
12. What is the proportion of overseas sales of mobile phones in your total operating income?
13. What is the advantage of your products compared with first-tier international vendors?
14. What is the disadvantage of your products compared with first-tier international vendors?
15. How long is your average design cycle for mobile phones?
16. How about the ex-factory prices of your major models?
17. Whose chip solutions did you use in 2010?
18. Whose chip solutions will you use in 2011?
19. Does your mobile phone solution involve a separate application processor?
20. Whose application processors do you prefer?
21. What is your strategy for Tablet PC?
22. What is your Tablet PC program?
23. What is your strategy for smart phones?
24. What is your strategy for smart phone operating system?
25. When will you launch your smart phones?
26. What is your 3G mobile phone strategy?
27. Which 3G standard will you use?
28. In your opinion, which of the following factors can reflect the difference among various mobile phones?
29. In your opinion, which sector will dominate the future mobile phone industry?
30. How about your budget in brand promotion?
31. How about your sales channels?
32. What kind of software stores do you plan to install in your smart phones?
33.
In your opinion, which local mobile phone companies (excluding listed
companies) take leading positions in shipment? How about their exact
shipment?
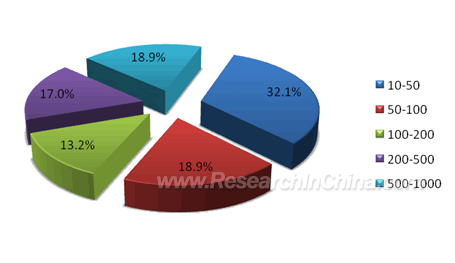
The survey basically covers local IDH enterprises of
all scales. Small enterprises with 10-50 employees accounted for the
highest proportion of 32.1%, while medium and large enterprises with
500-1,000 employees accounted for 18.9%.
Employee Distribution of Local IDH, 2010 
Source: Mobile Phone Journal; ResearchInChina
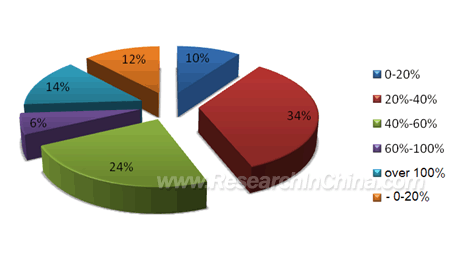
In
2010, 34% of enterprises gained the sales growth rate of 20%-40%, while
24% obtained 40%-60%. Overall, all of local IDH witnessed growth in
2010.
Sales Growth of Local IDH, 2010 
Source: Mobile Phone Journal; ResearchInChina