|
|
|
报告导航:研究报告—
金融与服务业—交通物流
|
|
2010-2011年中国航空运输及机场行业研究报告 |
 |
字数:3.1万 |
页数:87 |
图表数:98 |
|
中文电子版:7000元 |
中文纸版:3500元 |
中文(电子+纸)版:7500元 |
|
英文电子版:2000美元 |
英文纸版:2100美元 |
英文(电子+纸)版:2300美元 |
|
编号:ZJF024
|
发布日期:2011-06 |
附件:下载 |
 |
|
|
得益于中国经济的平稳增长,中国民航业在全球范围内率先实现复苏,2010年全行业完成运输总周转量538.45亿吨公里,同比增长26.1%。2011年一季度,由于受到国际油价上升的影响,以及世界局势动荡和日本地震的影响,总周转量仅同比增长8.0%,相对于2010年一季度总周转量增长32.2%有较大的下滑。
图:2006-2011年中国民航运输总周转量及同比增长情况(单位:亿吨公里) 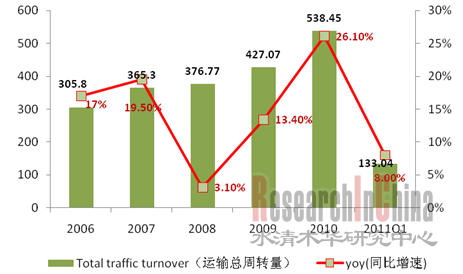 来源:国家统计局;整理:水清木华研究中心 2010年根据航空公司月平均客运量及机队规模排名,排名前三的是南航、东航、国航,其月平均客运输量分别为:南航581.48万人次,东航492.65万人次,国航435.07万人次;其机队规模分别为:南航422架,国航393架,东航348架。后十五位的航空公司占不论机队规模还是客运量,在行业总体份额中比重均很小。 南方航空:是中国运输飞机最多、年客运量最大的航空公司。2010年,南航旅客运输量位列亚洲第一、全球第三。2010 年,中国南方航空实现净利润58.05亿元,同比上年的净利润3.58亿元增长93.83%。 东方航空:2010年东航与上航合并后运营规模显著扩大,再加上上海世博会拉动,2010年东航运输收入增长81.49%,达到684.7亿元;但2011年1季度运输收入仅同比增长16.63%。 中国国航:是中国目前资产最多、运输量最大的航空运输企业。2010 年,公司净实现净利润122.08亿元,同比增长142.75%;2011年1季度实现净利润16.71亿元,同比下降23.04%。 2010年中国机场吞吐量各项指标再创历史新高,其中旅客吞吐量56431.2万人次,比上年增长16.1%。完成货邮吞吐量1129.0万吨,比上年增长19.4%。中国机场分为三类:第一类为三大枢纽机场,包括首都机场、浦东机场和白云机场。第二类是“17大”机场,如:成都、昆明、西安、乌鲁木齐、武汉等;第三类是其他类型机场。 2010年中国机场数量有所增加,三大枢纽旅客吞吐量占总量的比重略有下滑,为27.6%。其中,北京首都机场旅客吞吐量最大,占到总量的13.1%;白云机场和浦东机场分别占到7.3%和7.2%的份额。
Benefiting from China's steady economic growth, China aviation industry took the lead in the global recovery. In 2010, it completed an RTK (Revenue Ton Kilometer) of 53.845 billion ton-km, up 26.1% year on year. In Q1 2011, due to the rising international oil prices, the instability in the world and Japan’s earthquake, the RTK of China aviation industry only grew by 8.0% year on year, much less than the growth rate of 32.2% in Q1 2010.
RTK and YoY Growth Rate of China Civil Aviation, 2006-2011 (Unit: 100 million ton-km) 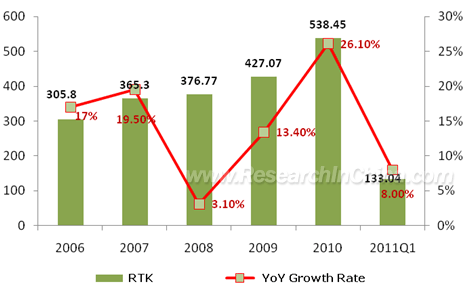 Source: National Bureau of Statistics of China; ResearchInChina In 2010, by average monthly passenger traffic and fleet scale, China Southern Airlines, China Eastern Airlines and Air China International ranked top 3, with average monthly passenger traffic of 5,814,800, 4,926,500 and 4,350,700 respectively, and fleet scale of 422 aircrafts, 348 aircrafts and 393 aircrafts separately. Other airlines occupied very small shares in both passenger traffic and fleet scale in the industry. China Southern Airlines: It has the most aircrafts and annual passenger traffic in China aviation industry. In 2010, its passenger traffic ranked first in Asia and third in the world. In 2010, it achieved net profit of RMB5.805 billion, up 1521.5% from RMB358 million in 2009. China Eastern Airlines: In 2010, China Eastern Airlines and Shanghai Airlines merged, so that the operation scale was larger. Coupled with the driving force of Shanghai World Expo, the transportation revenue gained by China Eastern Airlines in 2010 grew by 81.49% to RMB68.47 billion. However, in Q1 2011, the transportation revenue only grew by 16.63% year on year. Air China International: It has the most assets and traffic in China aviation industry. In 2010, it achieved net profit of RMB12.208 billion, up 142.75% year on year; in Q1 2011, it achieved net profit of RMB1.671 billion, down 23.04% year on year. In 2010, the throughput of Chinese airports touched a record high level. The passenger throughput reached 564,312,000, up 16.1% from last year; cargo and mail throughput was 11.29 million tons, up 19.4% from last year. Chinese airports are divided into three categories: first, three hub airports, including Beijing Capital International Airport, Shanghai Pudong Airport and Guangzhou Baiyun Airport; second, 17 major airports in Chengdu, Kunming, Xi'an, Urumqi, Wuhan and other cities; third, other types of airports. In 2010, the number of airports in China increased. The passenger throughput of three hub airports accounted for 27.6% of the total throughput, declining slightly. The passenger throughput of Beijing Capital International Airport accounted for the highest 13.1%, while Guangzhou Baiyun Airport 7.3 % and Shanghai Pudong Airport 7.2%.
第一章 中国航空运输业发展环境
1.1 经济环境
1.2 政策环境
1.3 社会环境
第二章 中国航空运输业发展概述
2.1 运力供应状况
2.2 航空运输需求状况
2.3 航空公司经营状况
2.4 国内外航空运输业竞争状况分析
第三章 中国航空运输细分市场分析
3.1 航空客运市场
3.2 航空货运市场
3.3 票价指数
3.3.1 国内票价指数
3.3.2 国际票价指数
3.3.3 区域票价指数
第四章 中国机场运输状况及收入分类
4.1 中国机场运输状况
4.1.1 中国通航城市与机场分布
4.1.2 机场吞吐量及其地区分布
4.1.3 飞机起降架次
4.2 中国机场收入分类
第五章 中国主要航空公司运营状况
5.1 航空公司竞争格局
5.2南方航空
5.2.1 企业基本信息
5.2.2 飞机拥有量
5.2.3 运力
5.2.4 运载量
5.2.5 载运率
5.3 东方航空
5.3.1 企业基本信息
5.3.2 财务状况
5.3.3 运力
5.3.4 运载量
5.3.5 载运率
5.3.6 发展战略
5.4 中国国航
5.4.1 基本信息
5.4.2 财务状况
5.4.3 飞机拥有量
5.4.4 运力
5.4.5 运载量
5.4.6 载运率
5.4.7 发展战略
5.5 海南航空
5.5.1 企业基本信息
5.5.2 运力
5.5.3 运载量
5.5.4 载运率
5.5.5 发展战略
5.6 国泰航空
5.6.1 运力
5.6.2 运载量
5.6.3 载运率
5.6.4 发展战略
5.7 其他航空公司
5.7.1 四川航空
5.7.2 深圳航空
5.7.3 山东航空
5.7.4 厦门航空
5.7.5 中国联合航空
5.7.6 中国邮政航空
5.7.7 中国货运航空
5.7.8 春秋航空
5.7.9 奥凯航空
5.7.10 吉祥航空
第六章 中国主要机场运营状况
6.1 中国机场竞争格局
6.2 北京首都国际机场
6.2.1 航班数
6.2.2 旅客吞吐量
6.2.3 货邮吞吐量
6.2.4 飞机起降架次
6.3 上海机场
6.3.1 财务状况
6.3.2 旅客及货邮吞吐量
6.3.3 发展趋势
6.4 白云机场
6.4.1 财务状况
6.4.2 旅客吞吐量
6.4.3 货邮吞吐量
6.4.4 飞机起降架次
6.5 深圳机场
6.5.1 财务状况
6.5.2 客货运输情况
6.5.3 发展预测
6.6 其他机场
6.6.1 成都双流国际机场
6.6.2 昆明巫家坝国际机场
6.6.3 西安咸阳国际机场
6.6.4 杭州萧山国际机场
6.6.5 重庆江北国际机场
6.6.6 厦门高崎国际机场
6.6.7 武汉天河国际机场
6.6.8 长沙黄花国际机场
6.6.9 南京禄口机场
6.6.10 青岛流亭国际机场
第七章 2011-2015年航空运输及机场行业展望
7.1 2011-2015年中国航空运输业影响因素分析
7.1.1 经济政策
7.1.2 航油价格
7.1.3 高铁影响
7.1.4 人民币升值影响
7.2 2011-2015年中国航空运输业发展预测
7.3 2011-2015年中国机场业发展预测
1. DEVELOPMENT ENVIRONMENT OF CHINA AIR TRANSPORT INDUSTRY
1.1 ECONOMIC ENVIRONMENT
1.2 POLICY ENVIRONMENT
1.3 SOCIAL ENVIRONMENT
2. OVERVIEW OF CHINA AIR TRANSPORT INDUSTRY
2.1 CAPACITY
2.2 DEMAND
2.3 OPERATION OF AIRLINES
2.4 COMPETITION AT HOME AND ABROAD
3. MARKET SEGMENTS OF CHINA AIR TRANSPORT INDUSTRY
3.1 AIR PASSENGER MARKET
3.2 AIR FREIGHT MARKET
3.3 TICKETS INDEX
3.3.1 Domestic Tickets Index
3.3.2 International Tickets Index
3.3.3 Tickets Index of Hong Kong, Macau & Taiwan
4. TRANSPORTATION SITUATION & REVENUE CLASSIFICATION OF CHINESE AIRPORTS
4.1 TRANSPORTATION SITUATION
4.1.1 Distribution of Chinese Navigable Cities & Airports
4.1.2 Airport Throughput and Its Regional Distribution
4.1.3 Aircraft Movements
4.2 REVENUE CLASSIFICATION
5. OPERATION OF MAJOR CHINESE AIRLINES
5.1 COMPETITIVE PATTERN
5.2 CHINA SOUTHERN AIRLINES
5.2.1 Profile
5.2.2 Aircraft Ownership
5.2.3 Capacity
5.2.4 Traffic
5.2.5 Load Factor
5.3 CHINA EASTERN AIRLINES
5.3.1 Profile
5.3.2 Financial Situation
5.3.3 Capacity
5.3.4 Traffic
5.3.5 Load Factor
5.3.6 Development Strategy
5.4 AIR CHINA
5.4.1 Profile
5.4.2 Financial Situation
5.4.3 Aircraft Ownership
5.4.4 Capacity
5.4.5 Traffic
5.4.6 Load Factor
5.4.7 Development Strategy
5.5 HAINAN AIRLINES
5.5.1 Profile
5.5.2 Capacity
5.5.3 Traffic
5.5.4 Load Factor
5.5.5 Development Strategy
5.6 CATHAY PACIFIC AIRWAYS
5.6.1 Capacity
5.6.2 Traffic
5.6.3 Load Factor
5.6.4 Development Strategy
5.7 OTHER AIRLINES
5.7.1 Sichuan Airlines
5.7.2 Shenzhen Airlines
5.7.3 Shandong Airlines
5.7.4 Xiamen Airlines
5.7.5 China United Airlines
5.7.6 China Postal Airlines
5.7.7 China Cargo Airlines
5.7.8 Spring Airlines
5.7.9 Okay Airways
5.7.10 Juneyao Airlines
6. OPERATION OF MAJOR CHINESE AIRPORTS
6.1 COMPETITIVE PATTERN
6.2 BEJING CAPITAL INTERNATIONAL AIRPORT
6.2.1 Number of Flights
6.2.2 Passenger Throughput
6.2.3 Cargo & Mail Throughput
6.2.4 Aircraft Movements
6.3 SHANGHAI AIRPORT
6.3.1 Financial Situation
6.3.2 Passenger and Cargo & Mail Throughput
6.3.3 Development Trend
6.4 BAIYUN AIRPORT
6.4.1 Financial Situation
6.4.2 Passenger Throughput
6.4.3 Cargo & Mail Throughput
6.4.4 Aircraft Movements
6.5 SHENZHEN AIRPORT
6.5.1 Financial Situation
6.5.2 Passenger and Cargo & Mail Throughput
6.5.3 Development Forecast
6.6 OTHER AIRPORTS
6.6.1 Chengdu Shuangliu International Airport
6.6.2 Kunming Wujiaba International Airport
6.6.3 Xi’an Xianyang International Airport
6.6.4 Hangzhou Xiaoshan International Airport
6.6.5 Chongqing Jiangbei International Airport
6.6.6 Xiamen Gaoqi International Airport
6.6.7 Wuhan Tianhe International Airport
6.6.8 Changsha Huanghua International Airport
6.6.9 Nanjing Lukou International Airport
6.6.10 Qingdao Liuting International Airport
7. OUTLOOK OF AIR TRANSPORT & AIRPORT INDUSTRY, 2011-2015
7.1 FACTORS INFLUENCING CHINA AIR TRANSPORT INDUSTRY, 2011-2015
7.1.1 Economic Policies
7.1.2 Oil Prices
7.1.3 Influence of High Speed Rail
7.1.4 Influence of RMB Appreciation
7.2 DEVELOPMENT FORECAST OF CHINA AIR TRANSPORT INDUSTRY, 2011-2015
7.3 DEVELOPMENT FORECAST OF CHINA AIRPORT INDUSTRY, 2011-2015
图:1991-2010年中国民航旅客周转量围绕GDP增速波动
图:1991-2011年民航旅客周转量在交通运输总周转量中的比重
图:1990-2010年国内外航线人均乘机次数
图:2004-2010年中国民航民用飞机架数 (单位:架)
图:2004-2010年中国民航民用航空航线条数 (单位:条)
图:2006-2011年中国民航运输总周转量及同比增长情况
图:2005-2011年三大航空公司净利润情况(单位:百万元)
图:2010年世界主要国家航空公司国内外份额对比
图:2007-2011年中国民航旅客运输量及同比增长情况(单位:百万人)
图:2009-2011年中国民航月度旅客运输量及同比增长(单位:万人)
图:2007-2011年中国民航不同航线旅客运输量增长情况
图:2009-2011年不同航线月度旅客运输量增速对比
图:2006-2011年中国民航货邮运量及增长情况(单位:千吨)
图:2007-2011年中国民航不同航线货运量对比(单位:千吨)
图:2009-2011年中国民航不同航线月度货运量增长走势
图:2009-2011年中国民航国内航线综合票价指数
图:2009-2011年中国民航国内远程航线票价指数
图:2009-2011年中国民航国内中程航线票价指数
图:2009-2011年中国民航国内支线票价指数
图:2009-2011年中国民航国际航线(不含亚洲)票价指数
图:2009-2011年中国民航亚洲及港澳地区航线票价指数
图:2007-2010年中国通航城市与机场数量(单位:个)
图:2010年中国机场区域分布及占比情况
图:2007-2010年中国机场旅客吞吐量及增长情况(单位:百万人次)
图:2010年主要城市旅客吞吐量占比
图:2007-2010年中国机场货邮吞吐量及增长情况(单位:百万吨)
图:2010年货邮吞吐量区域分布
图:2007-2010年中国机场飞机起降次数及同比增长(单位:百万架次)
图:2010年中国三大机场的航空业务收入与非航空业务收入占比
图:2005-2010年北京首都机场航空及非航空业务收入占比情况
图:2008-2010年南方航空飞机拥有量(单位:架)
表:2008-2011年南方航空运力情况
图: 2010南方航空不同航线ATK与ASK运力对比
表:2008-2011年南方航空运载量情况
图:2008-2011年南方航空不同航线RPK(旅客周转量)变化情况(单位:百万人公里)
图:2008-2011年南方航空不同航线RTK(运输总周转量)变化情况(单位:百万吨公里)
图:2008-2011年南方航空载运率变化情况
图:2008-2011年东航财务状况
表:2008-2011年东方航空运力情况
图:2008-2011年东方航空ATK趋势图(单位:百万公里)
表:2008-2011年东方航空载运情况
图:2010年东方航空不同航线运载情况
图:2008-2011年东方航空载运率变化情况
图:2010年东方航空不同航线载运率对比
表:2008-2011年国航财务状况
表:2010年中国国航机队详细情况表(单位:架)
表:2008-2011年中国国航主要运力指标变化情况
表:2008-2011年中国国航运载情况
图:2009-2011年中国国航月度客运量变化情况(单位:百万人)
图:2008-2011年中国国航国内外航线客运量对比(单位:百万人)
图:2009-2011年中国国航月度货邮运量变化情况(单位:千吨)
图:2008-2011年中国国航不同航线货运量情况(单位:千吨)
图:2008-2011年中国国航总载运率、客座及货邮载运率变化情况
图:2008-2011年中国国航国内外航线客座率及货邮载运率对比
图:2011-2012年海南航空飞机引进计划(单位:架)
表:2008-2011年海南航空运力情况
图:2006-2011年海南航空RPK市场份额
图:2008-2010年海南航空季度旅客运输量(单位:人)
图:2008-2011年海南航空客座率季度变化情况
图:2006-2010年海南航空三亚机场和海口机场旅客吞吐量(单位:人)
图:2009-2010年海南航空在海口、三亚和北京的市场份额
表:2007-2011年国泰航空航班数量及增长情况(单位:次)
表:2007-2011年国泰航空运力情况
图:2011年一季度国泰航空主要地区ASK分布情况
表:2007-2011年国泰航空运载量情况
图:2011年国泰航空不同地区RPK占比
图:2007-2011年国泰航空客座率和货邮载运率走势
图:2007-2010年山东航空年度营业收入及净利情况(单位:亿元)
图:2010年中国三类机场旅客吞吐量占比
图:2007-2010年北京首都机场航班次数(单位:次)
图:2007-2010年北京首都机场旅客吞吐量变化情况(单位:百万人)
图:2010年北京首都机场客流量构成及占比
图:2007-2010年北京首都机场货邮吞吐量变化情况(单位:千吨)
图:2009-2010年首都机场月度货邮吞吐量(单位:吨)
图:2009-2011年首都机场飞机起降架次月度数据及增长情况(单位:架次)
图:2008-2011年上海机场三大生产指标同比增长情况
图:2009-2011年白云机场季度主营业务收入及利润总额变化情况(单位:百万元)
图:2009-2011年白云机场旅客吞吐量月度走势(单位:万人)
图:2009-2011年白云机场货邮吞吐量月度走势(单位:千吨)
图:2009-2010年白云机场飞机起降架次月度走势(单位:千架次)
图:2008-2010年深圳机场三大生产指标半年度同比增长情况
表:2007-2010年成都双流国际机场三大生产指标
表:2007-2010年昆明巫家坝国际机场三大生产指标
表:2007-2010年西安咸阳机场国际机场三大生产指标
表:2007-2009年杭州萧山国际机场三大生产指标
表:2007-2010年重庆江北国际机场三大生产指标
表:2007-2010年厦门高崎国际机场三大生产指标
表:2007-2010年武汉天河国际机场三大生产指标
表:2007-2010年长沙黄花国际机场三大生产指标
表:2007-2010年南京禄口国际机场三大生产指标
表:2007-2010年青岛流亭国际机场三大生产指标
图:2005-2010年中国三大航空公司的汇兑净收益(单位:亿元)
图:根据2001年-2010年的民航客运量数据对2011年-2015年的预测(单位:万人次)
图:据2006年-2010年的民航运输总周转量对2011年-2015年的预测(单位:亿吨公里)
图:据2005年-2010年的中国机场旅客吞吐量对2011年-2015年的预测(单位:百万人次)
图:据2005年-2010年的中国机场货邮吞吐量对2011年-2015年的预测(单位:百万吨)
Fluctuation of China Civil Aviation RPK Around GDP Growth Rate, 1991-2010
Percentage of Civil Aviation RPK in RTK, 1991-2011
Average Frequency of Air Travel per Passenger of Domestic & International Airlines, 1990-2010
Number of China Civil Aviation Aircrafts, 2004-2010
Number of China Civil Aviation Airlines, 2004-2010
RTK and YOY Growth of China Civil Aviation, 2006-2011
Net Income of Three Major Airlines, 2005-2011
Market Share of Global Major Airlines at Home and Abroad, 2010
Passenger Traffic and YOY Growth of China Civil Aviation, 2007-2011
Monthly Passenger Traffic and YOY Growth of China Civil Aviation, 2009-2011
Growth in Passenger Traffic of China Civil Aviation by Airline, 2007-2011
Growth in Monthly Passenger Traffic of China Civil Aviation by Airline, 2009-2011
Cargo & Mail Traffic and Growth of China Civil Aviation, 2006-2011
Cargo Traffic of China Civil Aviation by Airline, 2007-2011
Growth Trend of Monthly Cargo Traffic of China Civil Aviation by Airline, 2009-2011
Composite Tickets Index of Domestic Airlines of China Civil Aviation, 2009-2011
Tickets Index of Domestic Long-range Airlines of China Civil Aviation, 2009-2011
Tickets Index of Domestic Medium-range Airlines of China Civil Aviation, 2009-2011
Tickets Index of Domestic Extension Airlines of China Civil Aviation, 2009-2011
Tickets Index of International Airlines (excluding Asia) of China Civil Aviation, 2009-2011
Tickets Index of Asia and Hong Kong, Macau & Taiwan Airlines, 2009-2011
Number of Navigable Cities and Airports in China, 2007-2010
Distribution of Chinese Airports by Region, 2010
Passenger Throughput and Growth of Chinese Airports, 2007-2010
Distribution of Passenger Throughput in Major Cities of China, 2010
Cargo & Mail Throughput and Growth of Chinese Airports, 2007-2010
Distribution of Cargo & Mail Throughput by Region, 2010
Number of Aircraft Movements and YOY Growth of Chinese Airports, 2007-2010
Percentage of Aviation Revenue and non- Aviation Revenue of Top 3 Airports in China, 2010
Percentage of Aviation Revenue and non- Aviation Revenue of BCIA, 2005-2010
Aircraft Ownership of China Southern Airlines, 2008-2010
Capacity of China Southern Airlines, 2008-2011
ATK & ASK Capacity of China Southern Airlines by Airline, 2010
Traffic of China Southern Airlines, 2008-2011
Changes in RPK of China Southern Airlines by Airline, 2008-2011
Changes in RTK of China Southern Airlines by Airline, 2008-2011
Changes in Load Factor of China Southern Airlines, 2008-2011
Financial Situation of China Eastern Airlines, 2008-2011
Capacity of China Eastern Airlines, 2008-2011
Trend of ATK of China Eastern Airlines, 2008-2011
Traffic of China Eastern Airlines, 2008-2011
Traffic of China Eastern Airlines by Airline, 2010
Changes in Load factor of China Eastern Airlines, 2008-2011
Load Factor of China Eastern Airlines by Airline, 2010
Financial Situation of Air China, 2008-2011
Aircraft Fleet of Air China, 2010
Changes in Key Capacity Indicators of Air China, 2008-2011
Traffic of Air China, 2008-2011
Monthly Changes in Passenger Traffic of Air China, 2009-2011
Passenger Traffic of Domestic and International Airlines of Air China, 2008-2011
Monthly Changes in Cargo & Mail Traffic of Air China, 2009-2011
Cargo Traffic of Air China by Airline, 2008-2011
Changes in Total Load Factor, Passenger Load Factor and Cargo & Mail Load Factor of Air China, 2008-2011
Passenger Load Factor and Cargo & Mail Load Factor of Domestic and International Airlines of Air China, 2008-2011
Plan of Hainan Airlines to Introduce Aircrafts, 2011-2012
Capacity of Hainan Airlines, 2008-2011
Market Share of RPK of Hainan Airlines, 2006-2011
Quarterly Passenger Traffic of Hainan Airlines, 2008-2010
Quarterly Changes in Passenger Load Factor of Hainan Airlines, 2008-2011
Passenger Throughput of Sanya Airport and Haikou Airport Attributable to Hainan Airlines, 2006-2010
Market Share of Hainan Airlines in Haikou, Sanya and Beijing, 2009-2010
Number of Air Flights and Growth of Cathay Pacific Airlines, 2007-2011
Capacity of Cathay Pacific Airlines, 2007-2011
Distribution of Cathay Pacific Airlines’ ASK by Region, 2011Q1
Traffic of Cathay Pacific Airlines, 2007-2011
Distribution of Cathay Pacific Airlines’ RPK by Region, 2011
Trend of Passenger and Cargo & Mail Load factor of Cathay Pacific Airlines, 2007-2011
Operating Income and Net Income of Shandong Airlines, 2007-2010
Proportion of Passenger Throughput of Three Types of Airport in China, 2010
Number of Air Flights of Beijing Capital International Airport (BCIA), 2007-2010
Passenger Throughput and Growth of BCIA, 2007-2010
Constitution and Proportion of Passenger Traffic in BCIA, 2010
Changes in Cargo & Mail Throughput of BCIA, 2007-2010
Monthly Cargo & Mail Throughput of BCIA, 2009-2010
Monthly Aircraft Movements and Growth of BCIA, 2009-2011
YOY Growth in Three Major Indicators of Shanghai Airport, 2008-2011
Changes in Quarterly Operating Income and Total Profit of Baiyun Airport, 2009-2011
Monthly Trend of Passenger Throughput of Baiyun Airport, 2009-2011
Monthly Trend of Cargo & Mail Throughput of Baiyun Airport, 2009-2011
Monthly Trend of Aircraft Movements of Baiyun Airport, 2009-2011
Semi-annual YOY Growth in Three Major Indicators of Shenzhen Airport, 2008-2010
Three Major Indicators of Chengdu Shuangliu International Airport, 2007-2010
Three Major Indicators of Kunming Wujiaba International Airport, 2007-2010
Three Major Indicators of Xi’an Xianyang International Airport, 2007-2010
Three Major Indicators of Hangzhou Xiaoshan International Airport, 2007-2010
Three Major Indicators of Chongqing Jiangbei International Airport, 2007-2010
Three Major Indicators of Xiamen Gaoqi International Airport, 2007-2010
Three Major Indicators of Wuhan Tianhe International Airport, 2007-2010
Three Major Indicators of Changsha Huanghua International Airport, 2007-2010
Three Major Indicators of Nanjing Lukou International Airport, 2007-2010
Three Major Indicators of Qingdao Liuting International Airport, 2007-2010
Net Foreign Exchange Gains of Top 3 Airlines in China, 2005-2010
Forecast of Civil Aviation Passenger Traffic in 2011-2015 Based on the Data in 2001-2010
Forecast of Civil Aviation RTK in 2011-2015 Based on the Data in 2006-2010
Forecast of Passenger Throughput of Chinese Airports in 2011-2015 Based on the Data in 2005-2010
Forecast of Cargo & Mail Throughput of Chinese Airports in 2011-2015 Based on the Data in 2005-2010
如果这份报告不能满足您的要求,我们还可以为您定制报告,请 留言说明您的详细需求。
|