|
|
|
报告导航:研究报告—
金融与服务业—零售与日用
|
|
2010-2011年全球及中国玩具行业研究报告 |
 |
字数:1.9万 |
页数:83 |
图表数:100 |
|
中文电子版:7000元 |
中文纸版:3500元 |
中文(电子+纸)版:7500元 |
|
英文电子版:1800美元 |
英文纸版:1900美元 |
英文(电子+纸)版:2100美元 |
|
编号:LM012
|
发布日期:2011-07 |
附件:下载 |
 |
|
|
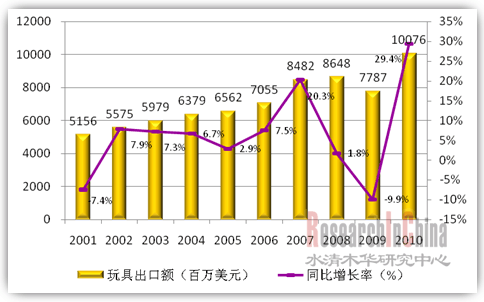
2010年,全球玩具行业销售833亿美元,同比增长4.7%。其中,亚洲玩具市场增长强劲,平均增长9.2%,已攀升至全球第二大玩具市场。受汇率波动等影响,欧洲市场下降至第三位。美国是全球最大的玩具市场,2010年销售额达219亿美元;其次是日本、中国、英国和法国。 图:2001-2010年中国玩具出口额及同比增长  来源: UN Comtrade;整理:水清木华研究中心 2010 年,中国玩具行业出口额达到100.8亿美元,同比增长29.4%。与2009年同比下降9.9%相比,2010年玩具行业出口实现大幅增长,这主要受益于全球经济的缓慢复苏,中国各项经济政策的实施以及国外玩具经销商普遍补库存等有利因素。 2010年,中国11大类玩具出口中,有10类实现快速增长,仅电动火车一项出现同比下降。其中,动物玩具出口16.65亿美元,同比增长22.08%;智力玩具和成套玩具分别出口6.90亿美元和6.45亿美元,分别增长33.40%和28.58%。从出口占比看,普通的毛绒玩具、塑胶玩具等传统玩具市场份额进一步萎缩,益智类、电子电动玩具则持续增长。 随着市场需求的不断上升,中国玩具制造企业对资本的需求也在迅速增长。奥飞、星辉、高乐、骅威和群兴等企业的相继上市融资成功。 2011年4月,群兴玩具公司IP0共募集资金约6.8亿元人民币,超募4.2亿元。募投项目中童车、电动车、电脑学习机等产能将分别计划新增超过250%,70%和120%。 本报告主要对全球及中国玩具行业的发展现状、行业相关政策、各玩具细分行业以及重点公司的经营状况进行了深入研究,旨在揭示玩具行业的发展趋势,把握中国玩具行业未来的发展趋势。
In 2010, the global toy sales achieved USD83.3 billion, up 4.7% YoY,
wherein, the Asian toy market climbed to the world’s second largest toy
market with the strong growth of 9.2% on average. Meanwhile, influenced
by fluctuations in the exchange rate, the European market dropped to the
third place. Being as the largest toy market globally, followed by
Japan, China, UK and France, the American market contributed the sales
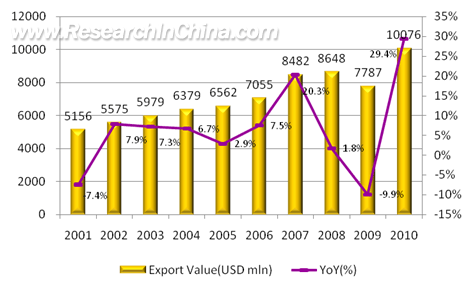
of USD21.9 billion in 2010. Export Value and Growth Rate of Toys Made in China, 2001-2010  Source: UN Comtrade; ResearchInChina In
2010, the export value of Chinese toys reached USD10.08 billion, up
29.4% from a year earlier. Compared to the YoY fall of 9.9% in 2009, the
export value of toy industry witnessed substantial increase in China in
2010, which was beneficial from the gradual recovery of global economy
as well as favorable factors such as implementation of economic policies
in China and the re-stocking of foreign toy dealers, etc. In
2010, ten out of 11 categories of exported China-made toys, except toy
electric train, experienced rapid growth; of which, the export value of
animal toys registered USD1.665 billion, up 22.08% YoY; and that of
intellectual toys and toy sets amounted to USD690 million and USD645
million, respectively, increasing by 33.4% and 28.58% from the previous
year. In terms of the export ratio, the market shares occupied by
traditional toys such as plush toys and plastic toys further shrank,
while that of intellectual and electronic & electric toys constantly
increased. Facing the rising market demand, the capital demand
of Chinese toy manufacturers keeps growing considerably. The enterprises
have successfully sought financing by listing on the stock market in
succession, such as Guangdong Alpha Animation and Culture Co., Ltd.,
Xing Hui Auto Model Co., Ltd., Goldlok Toys Holdings Co., Ltd.,
Guangdong Huawei Toys Craft Co., Ltd., and Guangdong Qunxing Toys
Joint-Stock Co., Ltd. etc. In Apr. 2011, Guangdong Qunxing Toys
Joint-Stock Co., Ltd. raised RMB680 million from the IPO, over collected
RMB420 million. Among the fundraising projects, the growth rates of
newly increased capacity of child vehicle, electric vehicle and computer
learning machine will see over 250%, 70% and 120%, respectively. Aimed
at illustrating the current and future development trend of toy
industry in China, this report probes into the status quo of global and
China’s toy industry, related policies, market segments and operations
of key toy enterprises.
第一章 玩具行业概述
1.1玩具的定义和分类
1.2玩具行业发展历程
第二章 全球玩具行业分析
2.1全球玩具市场发展概况
2.2主要国家分析
2.2.1美国玩具市场
2.2.2日本玩具市场
2.2.3 法国玩具市场
第三章 中国玩具行业发展概况
3.1发展现状
3.1.1 中国玩具行业发展现状
3.1.2 2010年中国玩具市场发展回顾
3.1.3 玩具行业相关标准和认证
3.2 中国玩具行业竞争格局分析
3.3进出口分析
3.3.1中国玩具进口情况分析
3.3.2中国玩具出口情况分析
3.3.3中国玩具行业出口的困境
第四章 玩具行业关联产业分析
4.1塑料行业
4.2动漫行业
4.3游戏行业
第五章 玩具子产业分析
5.1 毛绒玩具
5.1.1毛绒玩具发展概况
5.1.2中国毛绒玩具的发展困境
5.2 木制玩具
5.2.1木制玩具行业现状
5.2.2木制玩具市场供需分析
5.2.3 与木制玩具相关的认证及政策分析
5.3 塑胶玩具
5.3.1中国塑胶玩具行业发展概况
5.3.2中国塑胶玩具市场规模分析
5.3.3中国塑胶玩具行业发展困境
5.4 电子玩具
5.4.1 智能电子玩具受欢迎
5.4.2 中国电子电动玩具供需分析
5.4.3 中国电玩业受相关认证指令影响
5.5 益智玩具
5.5.1 益智玩具成为玩具主流
5.5.2 中国益智玩具出口情况分析
5.5.3 益智玩具行业标准
5.5.4 中国益智玩具市场潜在需求分析
第六章 国内主力玩具厂商分析
6.1奥飞动漫
6.1.1公司介绍
6.1.2经营状况
6.1.3公司策略
6.2星辉车模
6.2.1公司介绍
6.2.2经营状况
6.3高乐股份
6.3.1公司介绍
6.3.2经营状况
6.4 群兴玩具
6.4.1 公司介绍
6.4.2 经营状况
6.5 骅威股份
6.5.1 公司介绍
6.5.2 经营状况
6.6龙昌国际
6.6.1公司介绍
6.6.2经营状况
6.7好孩子国际
6.7.1 公司介绍
6.7.2 经营状况
6.8香港隆成集团
6.8.1公司介绍
6.8.2经营状况
6.9英德玩具
6.7.1公司介绍
6.7.2经营状况
第七章 国外主要玩具厂商分析
7.1美国美泰(Mattel)
7.1.1公司介绍
7.1.2经营状况
7.2美国孩之宝(Hasbro)
7.2.1公司介绍
7.2.2经营状况
7.3日本(Takara Tomy)
7.3.1公司介绍
7.3.2经营状况
7.4丹麦乐高(LEGO)
7.4.1公司介绍
7.4.2经营状况
7.5日本万代(BANDAI NAMCO)
7.5.1公司介绍
7.5.2经营状况
7.5.3 公司战略
1. Overview of Toy Industry
1.1 Definition and Category
1.2 Development History
2. Global Toy Industry
2.1 Development
2.2 Major Countries
2.2.1 USA
2.2.2 Japan
2.2.3 France
3. China Toy Industry
3.1 Current Development
3.1.1 Status Quo
3.1.2 Development in 2010
3.1.3 Related Standards and Authentication
3.2 Competition Pattern
3.3 Export & Import
3.3.1 Import
3.3.2 Export
3.3.3 Export Predicament
4. Related Industries
4.1 Plastic Industry
4.2 Cartoon & Animation Industry
4.3 Game Industry
5. Sub-industries
5.1 Plush Toy
5.1.1 Overview
5.1.2 Development Predicament of China Plush Toy Industry
5.2 Wooden Toy
5.2.1 Status Quo
5.2.2 Supply & Demand
5.2.3 Related Authentication and Policies
5.3 Plastic Toy
5.3.1 Overview of China Plastic Toy Industry
5.3.2 Market Size of China Plastic Toy Industry
5.3.3 Development Predicament of China Plastic Toy Industry
5.4 Electronic Toy
5.4.1 Popular Intelligent Electronic Toy
5.4.2 Supply of & Demand of China Electronic Toy Industry
5.4.3 Influence of Related Directive on China Electronic Toy Industry
5.5 Intellectual Toy
5.5.1 Mainstream Status
5.5.2 Export of Chinese Intellectual Toys
5.5.3 Industry Standard
5.5.4 Potential Market Demand
6. Key Toy Enterprises in China
6.1 Guangdong Alpha Animation and Culture Co., Ltd.
6.1.1 Profile
6.1.2 Operation
6.1.3 Strategy
6.2 Xinghui Auto Model Co., Ltd.
6.2.1 Profile
6.2.2 Operation
6.3 Goldlok Toys Holdings (Guangdong) Co., Ltd.
6.3.1 Profile
6.3.2 Operation
6.4 Guangdong Qunxing Toys Joint-Stock Co., Ltd.
6.4.1 Profile
6.4.2 Operation
6.5 Guangdong Huawei Toys Craft Co., Ltd.
6.5.1 Profile
6.5.2 Operation
6.6 Lung Cheong International Holdings Limited
6.6.1 Profile
6.6.2 Operation
6.7 Goodbaby International Holdings Limited
6.7.1 Profile
6.7.2 Operation
6.8 Lerado Group
6.8.1 Profile
6.8.2 Operation
6.9 Intex Toys
6.9.1 Profile
6.9.2 Operation
7. Key Toy Enterprises Overseas
7.1 Mattel
7.1.1 Profile
7.1.2 Operation
7.2 Hasbro
7.2.1 Profile
7.2.2 Operation
7.3 Takara Tomy
7.3.1 Profile
7.3.2 Operation
7.4 LEGO
7.4.1 Profile
7.4.2 Operation
7.5 NAMCO BANDAI
7.5.1 Profile
7.5.2 Operation
7.5.3 Strategy
图:2006-2011年全球玩具销售额
图:2009年全球玩具市场(分地区)销售额
表:2008-2009年部分主要国家的玩具销售额
图:2007-2009年全球玩具(分地区)销售额构成
图:2003-2010年美国玩具销售额
表:2006-2010年美国玩具(分产品)销售额
图:2004-2010年日本玩具销售额
图:2009-2010年日本玩具(分产品)销售收入构成
图:2005-2010年法国玩具销售额
图:2009年法国玩具分销渠道构成
图:2009年法国玩具出口目的地分布
图:2009年法国玩具进口来源地分布
图:2005-2009年中国玩具制造企业工业总产值及同比增长率
图:2009年中国城市、农村消费者购买玩具倾向
图:2009年部分国家儿童玩具年均消费
图:2007-2009年中国儿童玩具年均消费
图:2007.02-2010.05中国玩具行业毛利率
图:2009-2010年中国玩具分销渠道构成
图:2010.01-2010.12中国玩具出口额
图:与玩具相关的主要认证
表:2011年中国十大玩具品牌
图:2001-2010年中国玩具进口金额
图:2000和2010年中国玩具(分产品)出口对比
图:2001-2010年中国玩具出口额及同比增长率
图:2010年中国玩具出口目的地分布
图:2010.01-2011.05中国玩具出口同比增长率
图:2010年中国玩具出口来源地分布
图:2010年中国玩具(分产品)出口额及同比增长率
图:2001-2011年中国塑料工业总产值
图:2001-2010年中国塑料制品产量及增长率
图:2003-2010年中国塑料制品行业出口量和出口额
图:2000-2010年日本动画DVD销售与租借收益
图:2003-2010年日本电视动画片生产数量
图:2004-2010年中国电视动画片生产数量
图:2009年发达国家动漫玩具占本国玩具市场份额
图:2006-2013年中国网络游戏市场规模
图:2006-2010年中国网络游戏用户数统计
图:2010年中国大型网络游戏运营商用户规模
图:2004-2010年中国网络游戏数量统计
图:2007-2012年中国电视游戏平台硬件销售量及增长率
图:2007-2012年中国掌机游戏平台硬件销售量及增长率
图:2004-2010年中国毛绒玩具出口额
表:2009年1-11月毛绒玩具部分出口地及出口额
图:2010.01-2011.02中国毛绒玩具出口额及累计同比增长率
图:2009年中国毛绒玩具出口目的地分布
图:2010.01-2011.02浙江玩具出口额及累计同比增长率
图:2006-2012全球塑胶玩具市场规模
图:2006-2012中国塑胶玩具市场规模
图:2006-2009年中国电子玩具出口额
图:2010.01-2011.02中国智力玩具出口额及累计同比增长率
表:2009年1-11月中国智力玩具主要出口地及出口额
图:2007年中国消费者对各类玩具的关注度
图:2007-2011Q1奥飞动漫营业收入和净利润
图:2007-2010年奥飞动漫(分产品)营业收入及增长率
图:2006-2010年奥飞动漫(分地区)收入构成
图:2007-2010年奥飞动漫(分业务)毛利率
图:2006-2010年奥飞动漫动漫玩具收入及占比
图:星辉车模获得的授权品牌
图:2007-2011Q1星辉车模营业收入和净利润
图:2006-2010年星辉车模(分产品)收入构成
图:2006-2010年星辉车模车模销售收入占比
图:2006-2010年星辉车模毛利率
图:2006-2010年星辉车模(分地区)收入构成
图:2004-2012F全球车模销售额及增长率
图:2007-2011Q1高乐玩具营业收入和净利润
图:2008-2010年高乐玩具(分产品)营收结构
图:2010年高乐玩具(分地区)营收占比
表:2009年高乐玩具细分市场竞争状况
图:2006-2009高乐玩具主要销售渠道收入构成
图:2008-2011Q1群兴玩具营业收入和净利润
图:2010年群兴玩具(分产品)营收占比
图:2008-2010年群兴玩具(分地区)营收占比
图:2008-2011Q1骅威股份营业收入和净利润
图:2010年骅威股份(分产品)营收占比
图:2007-2010H1骅威股份塑胶玩具产出及销售量
图:2007-2010H1骅威股份智能玩具产出及销售量
图:2010年骅威股份(分地区)营收占比
图:2007-2011财年龙昌国际毛利润
图:2007-2011财年龙昌国际(分地区)收入构成
图:2007-2011财年龙昌国际(分产品)收入构成
图:2006-2009年隆成集团营业收入
图:2008-2009年隆成集团(分业务)收入构成
图:2007-2010年好孩子国际(分地区)收入构成
图:2007-2010年好孩子国际(分业务)收入构成
图:2006-2010年隆成集团营业收入
图:2008-2010年隆成集团(分业务)收入构成
图:2007-2009年英德玩具营业收入
图:2006-2010年美泰营业收入和净利润
图:2007-2010年美泰(分地区)收入构成
图:2007-2010年美泰(分产品)收入构成
图:2005-2010年孩之宝营业收入
图:2007-2010年孩之宝(分产品)营业收入
图:2007-2010年孩之宝(分地区)营业收入
图:2007-2011财年Tomy 营业收入
图:2008-2010财年Tomy(分地区)营业收入
图:2009财年Tomy(分产品)收入构成
图:2005-2010年乐高集团营业收入
图:2005-2010年乐高集团净利润
图:2007-2011财年万代销售额和毛利润
图:2008-2011财年万代(分产品)销售额
图:2006-2010财年万代(分地区)销售额
表:2012财年万代各分部主要发展策略
Global Toy Sales, 2006-2011
Global Toy Sales (by Region), 2009
Toy Sales of Key Countries, 2008-2009
Global Toy Sales Structure (by Region), 2007-2009
Sales of Toys in the USA, 2003-2010
Sales of Toys in the USA (by Product), 2006-2010
Sales of Toys in Japan, 2004-2010
Sales Structure of Toys in Japan (by Product), 2009-2010
Sales of Toys in France, 2005-2010
Distribution Channels of Toys in France, 2009
Export Destinations of French Toys, 2009
Import Origins of French Toys, 2009
Gross Industrial Output Value and Growth Rate of Chinese Toy Manufacturers, 2005-2009
Purchase Inclinations of Urban & Rural Consumers in China, 2009
Annual Average Consumption of Children’s Toys in Some Countries, 2009
Annual Average Consumption of Children’s Toys in China, 2007-2009
Gross Margin of China Toy Industry, Feb.2007- May 2010
Toy Distribution Channels in China, 2009-2010
Export Value of Toys in China, Jan.2010-Dec.2010
Major Toy-related Authentications
Top 10 Toy Brands in China, 2011
Import Value of Toys in China, 2001-2010
Export of Toys in China(by Product), 2000 vs. 2010
Export Value and Growth Rate of Chinese Toys, 2001-2010
Export Destinations of China-made Toys, 2010
YoY Growth Rate of China-made Toy Export, Jan. 2010 –May 2011
Export Sources of Toys in China, 2010
Export Value and Growth Rate of China-made Toys (by Product), 2010
Gross Output Value of China Plastic Industry, 2001-2011
Output and Growth Rate of Chinese Plastic Products, 2001-2010
Export Volume and Value of Chinese Plastic Industry, 2003-2010
Sales and Leasing Profits of Japanese Cartoon DVD, 2000-2010
Output of Japanese TV Animation, 2003-2010
Output of Domestic TV Animation in China, 2004-2010
Market Share of Cartoon & Animation Toys of Developed Countries, 2009
Market Size of Online Games in China, 2006-2013E
Number of Online Game Players in China, 2006-2010
User Numbers of Large-scale Online Game Operators in China, 2010
Quantity of Online Games in China, 2004-2010
Sales Volume and Growth Rate of TV Game Platform Hardware in China, 2007-2012E
Sales Volume and Growth Rate of PSP Platform Hardware in China, 2007-2012E
Export Value of Plush Toys in China, 2004-2010
Partial Export Destinations and Export Value of Plush Toys, Jan. 2009-Nov. 2009
Export Value and Growth Rate of Plush Toys in China,Jan.2010-Feb.2011
Export Destinations of China-made Plush Toys, 2009
Export Value and Growth Rate of Toys Made in Zhejiang Province, Jan.2010-Feb.2011
Global Market Size of Plastic Toys, 2006-2012E
Market Size of Plastic Toys in China, 2006-2012E
Export Value of Electronic Toys in China, 2006-2009
Export Value and Growth Rate of Intellectual Toys in China, Jan.2010-Feb.2011
Major Export Destinations and Export Value of Intellectual Toys in China, Jan. 2009-Nov. 2009
Attention of Chinese Consumers on Various Toys
Operating Income and Net Income of Alpha Animation, 2007-20110Q1
Operating Income and Growth Rate of Alpha Animation (by Product), 2007-2010
Revenue Structure of Alpha Animation (by Region), 2006-2010
Gross Margin of Alpha Animation (by Business), 2007-2010
Revenue from Cartoon Toys and Its Proportion of Alpha Animation, 2006-2010
Authorized Brands Obtained by Xinghui Auto Model
Operating Income and Net Income of Xinghui Auto Model, 2007-2011Q1
Revenue Structure of Xinghui Auto Model (by Product), 2006-2010
Proportion of Revenue from Model Cars of Xinghui Auto Model, 2006-2010
Gross Margin of Xinghui Auto Model, 2006-2010
Revenue Structure of Xinghui Auto Model (by Region), 2006-2010
Global Sales and Growth Rate of Model Car Market , 2004-2012E
Operating Income and Net Income of Goldlok Toys, 2007-2011Q1
Operating Income Structure of Goldlok Toys (by Product), 2008-2010
Operating Income Proportion of Goldlok Toys (by Region), 2010
Competition of Market Segments of Goldlok Toys, 2009
Revenue Structure of Goldlok Toys by Sales Channel, 2006-2009
Operating Income and Net Income of Qunxing Toys, 2008-2011Q1
Operating Income Structure of Qunxing Toys (by Product), 2010
Operating Income Proportion of Qunxing Toys (by Region), 2008-2010
Operating Income and Net Income of Huawei Toys, 2008-2011Q1
Operating Income of Huawei Toys(by Product),2010
Output and Sales Volume of Plastic Toys of Huawei Toys, 2007-2010H1
Output and Sales Volume of Intellectual Toys of Huawei Toys, 2007-2010H1
Operating Income of Huawei Toys(by Region),2010
Gross Margin of Lung Cheong International, FY2007-FY2011
Revenue Structure of Lung Cheong International (by Region), FY2007-FY2011
Operating Income of Lung Cheong International (by Product), FY2007-FY2011
Operating Income of Lerado Group, 2006-2009
Operating Income of Lerado Group (by Business), 2008-2009
Operating Income of Goodbaby (by Region), 2007-2010
Operating Income of Goodbaby (by Business), 2007-2010
Operating Income of Lerado Group, 2006-2010
Revenue Structure of Lerado Group (by Business), 2008-2010
Operating Income of Intex Toys, 2007-2009
Operating Income and Net Income of Mattel, 2006-2010
Revenue Structure of Mattel (by Region), 2007-2010
Revenue Structure of Mattel (by Product), 2007-2010
Operating Income of Hasbro, 2005-2010
Operating Income of Hasbro (by Product), 2007-2010
Operating Income of Hasbro (by Region), 2007-2010
Operating Income of Tomy, FY2007-FY2011
Operating Income of Tomy (by Region), FY2008-FY2010
Revenue Structure of Tomy (by Product), FY2009
Operating Income of LEGO Group, 2005-2010
Net Income of LEGO Group, 2005-2010
Sales and Gross Margin of Bandai, FY2007-FY2011
Sales of Bandai(by Product), FY2008-FY2011
Sales of Bandai (by Region), FY2006-FY2010
Main Strategies of Each Department of Bandai,FY2012
如果这份报告不能满足您的要求,我们还可以为您定制报告,请 留言说明您的详细需求。
|