|
|
|
报告导航:研究报告—
金融与服务业—旅游休闲
|
|
2011年中国旅游行业研究报告 |
 |
字数:2.0万 |
页数:61 |
图表数:79 |
|
中文电子版:6000元 |
中文纸版:3000元 |
中文(电子+纸)版:6500元 |
|
英文电子版:1600美元 |
英文纸版:1700美元 |
英文(电子+纸)版:1900美元 |
|
编号:ZJF27
|
发布日期:2011-08 |
附件:下载 |
 |
|
|
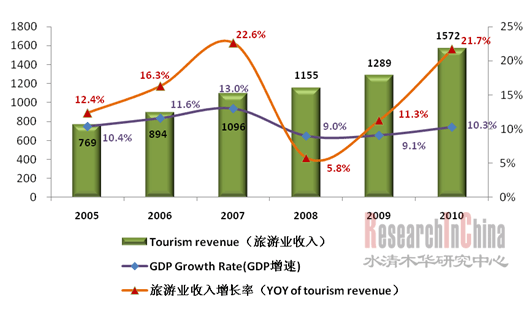
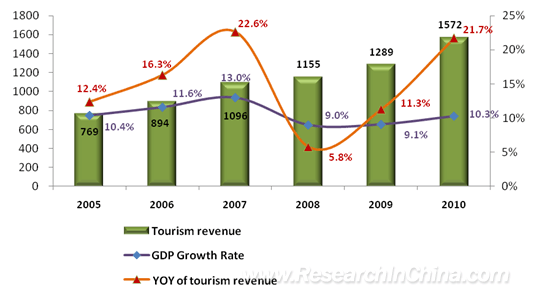
旅游业是第三产业的重要组成部分,中国明确提出要把旅游业培育成为国民经济的战略性支柱产业。 旅游业的发展是与经济的整体走势趋同的,有较强的经济周期性。2009年金融危机期间,旅游行业也受到重创,其增速随着GDP增速的下滑而下滑,2010年又随着全球经济的好转而走出危机, 2010年中国旅游收入总额为1.57万亿人民币,同比增长21.7%。
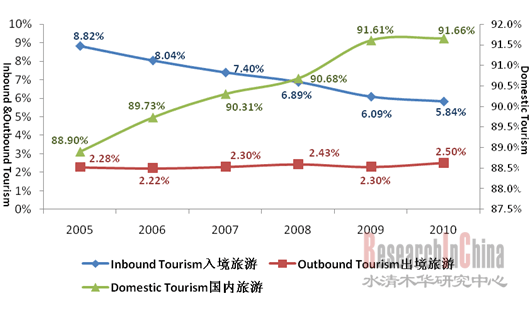
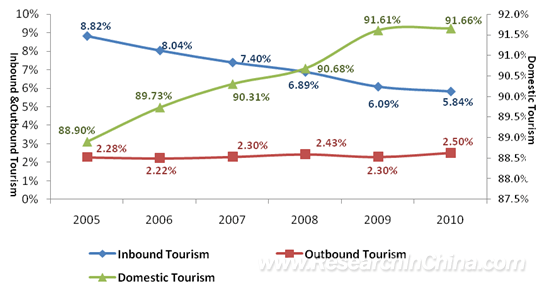
图:2005-2010年中国旅游业收入与GDP增速走势比较图(单位:十亿元)  来源:国家统计局;整理:水清木华研究中心 2010年中国国内旅游收入为1.27万亿元,占总收入约81%,国际旅游收入为3033亿元,占比约19%。中国旅游业主要包括三大市场,即入境旅游、出境旅游与国内旅游。中国入境旅游人数比重从2005年的8.82%下滑至2010年的5.84%,而国内旅游人数比重则从2005年的88.9%上升至2010年的91.66%;出境旅游呈缓慢增长态势,从2005年的2.28%增长至2010年2.5%。
图:2005-2010年中国入境、出境及国内旅游人数占比情况  整理:水清木华研究中心 入境旅游:2010年中国入境旅游外汇收入为458.14亿美元,同比增长15.47%。2010年入境人数为13376.22万人次,同比增长5.76%,人均消费342.5美元。 国内旅游:国内旅游人数从2005年的12.12亿人次上升为2010年的21.04亿人次,2010年国内旅游收入达到1.26万亿人民币,同比增长23.50%。 出境旅游:中国的出境旅游人数从2005年的3,102.6万人次,上升到2010年的5,739万人次,2010年的同比增长速度为20.4%。2010年出境旅游消费480亿美元,同比增长14.3%。中国出境游消费额居世界第四,人均消费836.4美元,是入境旅游人均消费的2.4倍,国内旅游人均消费的9倍。
Tourism is an important part of the tertiary industry. China has made clear its intention to build tourism into a strategic pillar industry of the national economy. The development of tourism and the overall trend of economy are generally in the same direction, both with conspicuous economic periodicity. The financial crisis hit tourism heavily in 2009, and the growth rate of tourism declined with decreasing GDP growth rate. However, in 2010, tourism walked out of the crisis in the wake of the rebounding global economy, and China's tourism revenue amounted to RMB1.57 trillion, up 21.7% year on year.
China's Tourism Revenue and GDP Growth, 2005-2010 (RMB bn)  Source: National Bureau of Statistics of China; ResearchInChina In 2010, China gained RMB1.27 trillion from domestic tourism (accounting for about 81% of the total revenue) and RMB303.3 billion from international tourism (accounting for19%). China's tourism industry includes three major markets, namely, inbound tourism, outbound tourism and domestic tourism. By number of tourists, the proportion of inbound tourism declined from 8.82% in 2005 to 5.84% in 2010, the proportion of domestic tourism increased from 88.9% in 2005 to 91.66% in 2010, and the proportion of outbound tourism increased slowly from 2.28% in 2005 to 2.5% in 2010.
Inbound Tourism, Outbound Tourism and Domestic Tourism of China by Number of Tourists, 2005-2010  Source: ResearchInChina Inbound Tourism: in 2010, foreign exchange earnings reached USD45.814 billion, up 15.47% year on year; the number of tourists was 133.7622 million person-times, up 5.76% year on year; per capita consumption valued USD342.5. Domestic Tourism: the number of tourists rose from 1.212 billion person-times in 2005 to 2.104 billion person-times in 2010; the revenue valued RMB1.26 trillion, up 23.50% year on year. Outbound Tourism: the number of tourists rose from 31.026 million person-times in 2005 to 57.39 million person-times in 2010, and the year-on-year growth rate was 20.4% in 2010. The consumption increased by 14.3% year on year to USD48 billion in 2010, ranking fourth in the world. The per capita consumption reached USD836.4, which was 2.4 times of the per capita consumption of inbound tourism and 9 times of the per capita consumption of domestic tourism.
第一章 中国旅游行业运行情况
1.1中国旅游业的发展特点
1.2中国旅游业市场构成
1.3中国旅游业收入构成
第二章 中国旅游业细分市场分析
2.1入境旅游
2.1.1中国入境旅游市场规模分析
2.1.2中国入境旅游市场(外汇)收入分析
2.1.3中国入境旅游市场人数构成
2.1.4中国各地区入境旅游市场分析
2.1.5外国入境旅游人数分析
2.2国内旅游
2.2.1中国国内旅游市场规模分析
2.2.2中国国内旅游市场收入分析
2.3出境旅游
2.3.1中国出境旅游市场规模分析
2.3.2中国出境旅游人数构成分析
2.3.3中国出境旅游消费情况分析
2.3.4中国出境游的主要目的地分析
第三章 中国旅行社和饭店的发展状况
3.1中国旅行社
3.1.1中国旅行社的规模
3.1.2中国旅行社的整体运营状况
3.2中国星级饭店
3.2.1星级饭店的构成结构及区域分布
3.2.2星级饭店的经营情况
第四章 中国旅游业重点企业
4.1华侨城集团
4.1.1公司简介
4.1.2 2007-2011年公司财务运营情况
4.1.3 2009-2010年公司主营业务收入构成分析
4.1.4公司发展的最新动向 38
4.2中青旅
4.2.1公司简介
4.2.2 2006-2011年公司财务运营情况
4.2.3 2010年公司主营业务收入构成分析
4.2.4公司发展的最新动向
4.3 中国国旅
4.3.1公司简介
4.3.2 2007-2011年公司财务运营情况
4.3.3 2009年和2010年公司主营业务收入构成
4.3.4公司发展的最新动向
4.4首旅股份
4.4.1公司简介
4.4.2 2006-2011年公司财务运营情况
4.4.3 2010年公司主营业务收入构成分析
4.4.4公司发展的最新动向
4.5华天酒店
4.5.1公司简介
4.5.2 2006-2011年公司财务运营情况
4.5.3 2010年公司主营业务收入构成分析
4.5.4公司发展的最新动向
4.6黄山旅游
4.6.1公司简介
4.6.2 2006-2011年公司财务运营情况
4.6.3 2010年公司主营业务收入构成分析
4.6.4公司发展的最新动向
4.7峨眉山
4.7.1公司简介
4.7.2 2006-2011年公司财务运营情况
4.7.3 2010年公司主营业务收入构成分析
4.7.4公司发展的最新动向
4.8 国旅联合
4.8.1公司简介
4.8.2 2006-2011年公司财务运营情况
4.8.3 2010年公司主营业务收入构成分析
4.8.4公司发展的最新动向
4.9 西安旅游
4.9.1公司简介
4.9.2 2007-2011年公司财务运营情况
4.9.3 2010年公司主营业务收入构成分析
4.9.4公司发展的最新动向
4.10三特索道
4.10.1公司简介
4.10.2 2007-2011年公司财务运营情况
4.10.3 2010年公司主营业务收入构成分析
4.10.4公司发展的最新动向
4.11大连圣亚
4.11.1公司简介
4.11.2 2007-2011年公司财务运营情况
4.11.3 2010年公司主营业务收入构成分析
4.11.4公司发展的最新动向
4.12云南旅游
4.12.1公司简介
4.12.2 2007-2011年公司财务运营情况
4.12.3 2010年公司主营业务收入构成分析
4.12.4公司发展的最新动向
4.13 北京旅游
4.13.1公司简介
4.13.2 2007-2011年公司财务运营情况
4.13.3 2010年公司主营业务收入构成分析
4.13.4公司发展的最新动向
第五章 2011-2015年中国旅游业发展展望
5.1 2011-2015年中国旅游业发展的影响因素
5.1.1正面影响因素
5.1.2负面影响因素
5.2 2011-2015年中国旅游市场规模预测
5.2.1 入境旅游人数预测
5.2.2 国内旅游人数预测
5.2.3 出境旅游人数预测
5.3 2011-2015年中国旅游市场收入预测
5.3.1 旅游行业收入预测
5.3.2 国际旅游外汇收入预测
5.3.3 国内旅游收入预测
1.Operation of China’s Tourism Industry
1.1 Development Characteristics
1.2 Market Structure
1.3 Revenue Structure
2. Analysis of China’s Tourism Market Segments
2.1 Inbound Tourism
2.1.1 Market Size
2.1.2 (Foreign Exchange) Revenue
2.1.3 Tourist Structure
2.1.4 Regional Markets
2.1.5 Foreign Tourist Structure
2.2 Domestic Tourism
2.2.1 Market Size
2.2.2 Revenue
2.3 Outbound Tourism
2.3.1 Market Size
2.3.2 Tourist Structure
2.3.3 Consumption
2.3.4 Main Destinations
3. Development of Travel Agencies and Hotels in China
3.1 Travel Agencies
3.1.1 Scale
3.1.2 Operation
3.2 Star-Rated Hotels
3.2.1 Structure and Regional Distribution
3.2.2 Operation
4. Key Enterprises in China Tourism Industry
4.1 Overseas Chinese Town (Group) Co., Ltd
4.1.1 Profile
4.1.2 Financial Operation, 2007-2011
4.1.3 Operating Income Structure, 2009-2010
4.1.4 Latest Development Trend
4.2 China CYTS Tours Holding Co., Ltd
4.2.1 Profile
4.2.2 Financial Operation, 2006-2011
4.2.3 Operating Income Structure, 2010
4.2.4 Latest Development Trend
4.3 China International Travel Service Corporation Limited
4.3.1 Profile
4.3.2 Financial Operation, 2007-2011
4.3.3 Operating Income Structure, 2009-2010
4.3.4 Latest Development Trend
4.4 Beijing Tourism Group Co., Ltd
4.4.1 Profile
4.4.2 Financial Operation, 2006-2011
4.4.3 Operating Income Structure, 2010
4.4.4 Latest Development Trend
4.5 Huatian Hotel Group Co., Ltd
4.5.1 Profile
4.5.2 Financial Operation, 2006-2011
4.5.3 Operating Income Structure, 2010
4.5.4 Latest Development Trend
4.6 Huangshan Tourism Development Co., Ltd.
4.6.1 Profile
4.6.2 Financial Operation, 2006-2011
4.6.3 Operating Income Structure, 2010
4.6.4 Latest Development Trend
4.7 Emei Shan Tourism Company Limited
4.7.1 Profile
4.7.2 Financial Operation, 2006-2011
4.7.3 Operating Income Structure, 2010
4.7.4 Latest Development Trend
4.8 China United Travel Co., Ltd.
4.8.1 Profile
4.8.2 Financial Operation, 2006-2011
4.8.3 Operating Income Structure, 2010
4.8.4 Latest Development Trend
4.9 Xi'an Tourism (Group) Co., Ltd.
4.9.1 Profile
4.9.2 Financial Operation, 2007-2011
4.9.3 Operating Income Structure, 2010
4.9.4 Latest Development Trend
4.10 Wuhan Sante Cableways Group Co., Ltd
4.10.1 Profile
4.10.2 Financial Operation, 2007-2011
4.10.3 Operating Income Structure, 2010
4.10.4 Latest Development Trend
4.11 Dalian Sunasia Tourism Holding Co., Ltd
4.11.1 Profile
4.11.2 Financial Operation, 2007-2011
4.11.3 Operating Income Structure, 2010
4.11.4 Latest Development Trend
4.12 Yunnan Tourism Co., Ltd
4.12.1 Profile
4.12.2 Financial Operation, 2007-2011
4.12.3 Operating Income Structure, 2010
4.12.4 Latest Development Trend
4.13 Beijing Jingxi Tourism Development Co., Ltd
4.13.1 Profile
4.13.2 Financial Operation, 2007-2011
4.13.3 Operating Income Structure, 2010
4.13.4 Latest Development Trend
5. Outlook of China Tourism Industry, 2011-2015
5.1 Influencing Factors
5.1.1 Positive Factors
5.1.2 Negative Factors
5.2 Forecast of Market Size
5.2.1 Number of Inbound Tourists
5.2.2 Number of Domestic Tourists
5.2.3 Number of Outbound Tourists
5.3 Revenue Forecast
5.3.1 Revenue of China Tourism Industry
5.3.2 Foreign Exchange Earnings from International Tourism
5.3.3 Domestic Tourism Revenue
图:2005-2010年中国旅游业收入与GDP增速走势比较图
图:2005-2010年中国入境、出境及国内旅游人数占比情况
图:2005-2010年中国旅游行业收入构成
图:2010年中国旅游收入构成
图:2005-2011年入境旅游人数走势及其占总人数比重情况
图:2005-2011年国际旅游外汇收入情况
图:2010年国际旅游外汇收入按消费种类分类
图:2007-2011年国际旅游收入按国别分类
图:2005-2011年入境旅游人数构成
图:2010年入境旅游地区接待情况(按地区分)
图:2010年按国别分外国入境旅游人数
图:2005-2010年中国国内旅游人数
图:2005-2010年中国国内旅游出游率
图:2005-2010年国内旅游收入及增速
图:2005-2010年中国国内旅游人均消费
图:2005-2010年中国出境旅游人数及增速和所占比重情况
图:2005-2010年中国出境旅游人员构成
图:2005-2010年中国出境旅游消费情况
图:2005-2010年入境旅游收入与出境旅游消费情况及结余
图:2010年中国出境游目的国情况
图:2007-2011Q1中国旅行社数量及同比增长
图:2011年第一季度三大旅游市场人次情况比较
图:2011年第一季度三大旅游市场人天情况比较
图:2008-2010中国星级饭店个数及同比增长率
图:2010年星级饭店营业收入比重
图:2010年星级饭店营业收入来源及比重
表:2011年第一季度全国星级饭店经营情况平均指标
表:2011年第一季度三大区域星级饭店经营状况统计表
图:2007-2011Q1华侨城营业收入及增速
图:2007-2011Q1华侨城净利润及其增速和净利润率情况
图:2009-2010年华侨城主营业务收入构成
图:2006-2011Q1中青旅营业收入及增速
图:2006-2011Q1中青旅净利润及增速和净利润率
图:2010年中青旅主营业务收入构成
图:2007-2011Q1中国国旅营业收入及增速
图:2007-2011Q1中国国旅净利润及增速及净利润率
图:2009-2010年中国国旅主营业务收入构成
图:2006-2011Q1首旅股份营业收入及增速
图:2006-2011Q1首旅股份净利润及增速和净利润率
图:2010年首旅股份主营业务收入构成
图:2006-2011Q1华天酒店营业收入及增速
图:2006-2011Q1华天酒店净利润及增速及净利润率
图:2010年华天酒店主营业务收入构成
图:2006-2011Q1黄山旅游营业收入及增速
图:2006-2011Q1黄山旅游净利润及增速和净利润率
图:2009-2010年黄山旅游主营业务收入构成
图:2006-2011Q1峨眉山A营业收入及增速
图:2006-2011Q峨眉山净利润及增速和净利润率
图:2010年峨眉山A主营业务收入构成
图:2006-2011Q1国旅联合营业收入及增速
图:2006-2011Q1国旅联合净利润及增速和净利润率
图:2009-2010年公司主营业务收入构成
图:2006-2011Q1西安旅游营业收入与增速
图:2007-2011Q1西安旅游净利润和净利润率
图:2009-2010年公司主营业务收入构成
图:2006-2011Q1三特索道营业收入与增速
图:2007-2011Q1三特索道净利润及增速和净利润率
图: 2010年公司主营业务收入构成
图:2007-2011Q1大连圣亚营业收入与增速
图:2007-2011Q1大连圣亚净利润及增速和净利润率
图: 2010年公司主营业务收入构成
图:2006-2011Q1云南旅游营业收入及增速
图:2007-2011Q1云南旅游净利润及增速和净利润率
图: 2010年公司主营业务收入构成
图:2006-2011Q1北京旅游营业收入及增速
图:2007-2011Q1北京旅游净利润及增速和净利润率
图: 2010年公司主营业务收入构成
图:2011-2015年中国入境旅游人数预测
图:2011-2015年中国国内旅游人数预测
图:2011-2015年中国出境旅游人数预测
图:2011-2015年中国旅游行业收入预测
图:2011-2015年中国国际旅游外汇收入预测
图:2011-2015年中国国内旅游收入预测
China's Tourism Revenue and GDP Growth, 2005-2010
Inbound Tourism, Outbound Tourism and Domestic Tourism of China by Number of Tourists, 2005-2010
Structure of China's Tourism Revenue, 2005-2010
Structure of China’s Tourism Revenue, 2010
Number of Inbound Tourists and Proportion in Total Tourists, 2005-2011
Foreign Exchange Earnings from International Tourism, 2005-2011
Foreign Exchange Earnings from International Tourism by Consumption Field, 2010
Foreign Exchange Earnings from International Tourism by Country, 2007-2011
Number of Inbound Tourists, 2005-2011
Destinations of Inbound Tourism by Region, 2010
Number of Inbound Tourists by Country, 2010
Number of Domestic Tourists, 2005-2010
Travel Propensity of Domestic Tourism, 2005-2010
Revenue and Growth Rate of Domestic Tourism, 2005-2010
Per Capita Consumption of Domestic Tourists, 2005-2010
Number and Growth Rate of Outbound Tourists and Proportion in Total Tourists, 2005-2010
Structure of Outbound Tourists, 2005-2010
Consumption of Outbound Tourists, 2005-2010
Inbound Tourism Revenue, Consumption of Outbound Tourists and Balance, 2005-2010
Destinations of Outbound Tourism, 2010
Number and YoY Growth of Travel Agencies in China, 2007-Q1 2011
Comparison among Three Tourism Markets by Person-time, Q1 2011
Comparison among Three Tourism Markets by Person-day, Q1 2011
Number and YoY Growth of Star-rated Hotels in China, 2008-2010
Operating Income of Star-rated Hotels, 2010
Operating Income Structure of Star-rated Hotels by Income Source, 2010
Operating Indicators of Star-rated Hotels, Q1 2011
Operating Status of Star-rated Hotels in Three Major Regions, Q1 2011
Operating Income and YoY Growth Rate of Overseas Chinese Town (Group) Co., Ltd, 2007-2011Q1
Net Income and Its YoY Growth Rate and Net Profit Margin of Overseas Chinese Town (Group) Co., Ltd, 2007-2011Q1
Operating Income Structure of Overseas Chinese Town (Group) Co., Ltd, 2009-2010
Operating Income and YoY Growth Rate of China CYTS Tours Holding Co., Ltd, 2006-2011Q1
Net Income and Its YoY Growth Rate and Net Profit Margin of China CYTS Tours Holding Co., Ltd, 2006-2011Q1
Operating Income Structure of China CYTS Tours Holding Co., Ltd, 2010
Operating Income and YoY Growth Rate of China International Travel Service Co., Ltd, 2007-2011Q1
Net Income and Its YoY Growth Rate and Net Profit Margin of China International Travel Service Co., Ltd, 2007-2011Q1
Operating Income Structure of China International Travel Service Co., Ltd., 2009-2010
Operating Income and YoY Growth Rate of Beijing Tourism Group Co., Ltd, 2006-2011Q1
Net Income and Its YoY Growth Rate and Net Profit Margin of Beijing Tourism Group Co., Ltd, 2006-2011Q1
Operating Income Structure of Beijing Tourism Group Co., Ltd, 2010
Operating Income and YoY Growth Rate of Huatian Hotel Group Co., Ltd, 2006-2011Q1
Net Income & Its YoY Growth Rate and Net Profit Margin of Huatian Hotel Group Co., Ltd, 2006-2011Q1
Operating Income Structure of Huatian Hotel Group Co., Ltd, 2010
Operating Income and YoY Growth Rate of Huangshan Tourism Development Co., Ltd, 2006-2011Q1
Net Income & Its YoY Growth Rate and Net Profit Margin of Huangshan Tourism Development Co., Ltd, 2006-2011Q1
Operating Income Structure of Huangshan Tourism Development Co., Ltd, 2009-2010
Operating Income and YoY Growth Rate of Emei Shan Tourism Company Limited, 2006-2011Q1
Net Income & Its YoY Growth Rate and Net Profit Margin of Emei Shan Tourism Company Limited, 2006-2011Q1
Operating Income Structure of Emei Shan Tourism Company Limited, 2010
Operating Income and YoY Growth Rate of China United Travel Co., Ltd, 2006-2011Q1
Net Income & Its YoY Growth Rate and Net Profit Margin of China United Travel Co., Ltd, 2006-2011Q1
Operating Income Structure of China United Travel Co., Ltd, 2009-2010
Operating Income and YoY Growth Rate of Xi'an Tourism (Group) Co., Ltd, 2006-2011Q1
Net Income and Net Profit Margin of Xi'an Tourism (Group) Co., Ltd, 2007-2011Q1
Operating Income Structure of Xi'an Tourism (Group) Co., Ltd, 2009-2010
Operating Income and YoY Growth Rate of Wuhan Sante Cableways Group Co., Ltd, 2006-2011Q1
Net Income & Its YoY Growth Rate and Net Profit Margin of Wuhan Sante Cableways Group Co., Ltd, 2007-2011Q1
Operating Income Structure of Wuhan Sante Cableways Group Co., Ltd, 2010
Operating Income and YoY Growth Rate of Dalian Sunasia Tourism Holding Co., Ltd, 2007-2011Q1
Net Income & Its YoY Growth Rate and Net Profit Margin of Dalian Sunasia Tourism Holding Co., Ltd, 2007-2011Q1
Operating Income Structure of Dalian Sunasia Tourism Holding Co., Ltd, 2010
Operating Income and YoY Growth Rate of Yunnan Tourism Co., Ltd, 2006-2011Q1
Net Income & Its YoY Growth Rate and Net Profit Margin of Yunnan Tourism Co., Ltd, 2007-2011Q1
Operating Income Structure of Yunnan Tourism Co., Ltd, 2010
Operating Income and YoY Growth Rate of Beijing Jingxi Tourism Development Co., Ltd, 2006-2011Q1
Net Income & Its YoY Growth Rate and Net Profit Margin of Beijing Jingxi Tourism Development Co., Ltd., 2007-2011Q1
Operating Income Structure of Beijing Jingxi Tourism Development Co., Ltd, 2010
Forecast of Number of Inbound Tourists, 2011-2015
Forecast of Number of Domestic Tourists, 2011-2015
Forecast of Number of Outbound Tourists, 2011-2015
Forecast of China’s Tourism Revenue, 2011-2015
Forecast of China’s Foreign Exchange Earnings from International Tourism, 2011-2015
Forecast of China’s Domestic Tourism Revenue, 2011-2015
如果这份报告不能满足您的要求,我们还可以为您定制报告,请 留言说明您的详细需求。
|