留言
报告导航:研究报告TMT产业网络经济
2011年中国网络视频行业研究报告
字数:3.0万 页数:71 图表数:33
中文电子版:7000元 中文纸版:3500元 中文(电子+纸)版:7500元
英文电子版:1700美元 英文纸版:1800美元 英文(电子+纸)版:2000美元
编号:YLY009 发布日期:2011-08 附件:下载
  2010年中国网络视频市场收入为22.75亿元,比2009年增长170.2%。中国视频行业收入来源仍主要来自广告,网络视频用户数量的增加和浏览时长的增长将使网络视频的广告价值不断上升。随着版权保护环境的日益改善,付费收入也将逐步提高。未来五年,网络视频行业的市场规模增速将保持在30%以上。

  中国网络视频厂商酷6、乐视网、优酷、土豆,以及涉足网络视频的凤凰新媒体、迅雷等厂商分别上市。 CNTV、搜狐视频、百度奇艺等厂商凭借其控股公司强大的内容资源、用户资源或资金资源在2010年迅速崛起。2011年,中国网络视频行业竞争更加激烈,网络视频厂商的经营模式差异化更加明显。

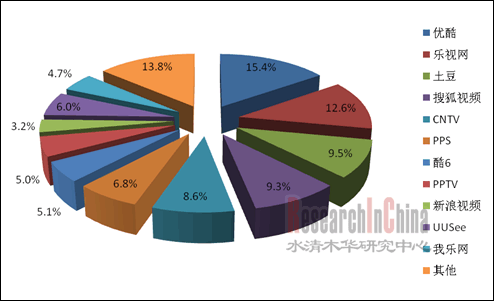
图:2011年Q1中国网络视频厂商市场份额
 201108005.gif
整理:水清木华研究中心

  从营收规模、用户数、内容资源等综合指标评比,视频分享厂商优酷和土豆仍然处于中国网络视频厂商的第一梯队。视频分享厂商酷6网由于亏损严重,将转变以往巨额版权购买及投入过高带宽建设的业务策略,计划发展视频资讯业务。其他视频分享厂商,如我乐网、六间房、爆米花等,业务以短片资讯和社区视频为主,其收入需要和用户及广告商分成,内容成本和带宽成均较低。

  在视频点播/直播领域,乐视网因为版权分销收入的暴涨,2011 Q1营业收入为10475.20万元,比去年同期增长131.99%;净利润为2906.42万元,比去年同期增长83.75%。搜狐视频采取热门影视剧独播策略,2010年税前收入为3300万美元,约为2009年的3倍。奇艺网主打正版长视频业务,带宽和内容成本支出高,处于亏损状态。激动网2010年收入2亿元,会员付费收入约为1.6亿元。

  在P2P流媒体领域,迅雷旗下的视频广告收入超过下载业务,2009年已实现盈利。2011 Q1带宽成本为1493万元,同比增长104.0%;内容成本为914.4万元,同比增长142.9%。PPTV、PPStream和UUSee是P2P流媒体领域三大厂商,2010年收入接近亿元,内容购买成本为几千万至1亿元以上,但带宽成本只有视频分享网站的5%左右。

  传统媒体网络视频厂商包括CNTV、东方宽频、凤凰新媒体等,依靠电视台丰富的内容资源以及品牌优势,发展迅速,主要盈利来源包括广告、版权分销以及与电信运营商的合作。

China online video market revenue in 2010 reached RMB 2.275 billion, up 170.2% over 2009. The main revenue source is still advertising, whose value is promoted steadily by the increasing online video users and browsing time. With the improving environment for copyright protection, the pay revenue will also gradually increase. In the next five years, the market size of online video industry will maintain a growth rate of over 30%.

China online video companies Ku6, Letv, Youku, Tudou and other companies involved in online video industry like Phoenix New Media and Xunlei went public successively. By virtue of powerful content, user and capital resources from their holding companies, CNTV, Sohu Video and Baidu Qiyi rose rapidly in 2010. In 2011, the competition in China’s online video industry is more intense and the differentiation among business models of online video companies becomes more pronounced.

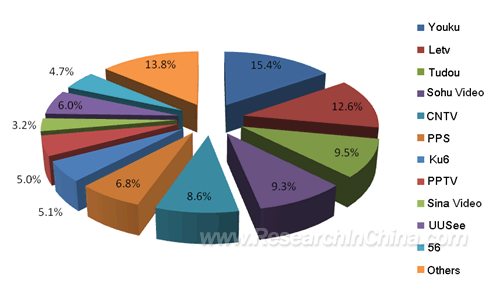
China Online Video Market Share, 2011Q1
 201108008.gif
Source: ResearchInChina

In terms of comprehensive index, such as revenue, number of users and content resources, video sharing companies Youku and Tudou are still in the first echelon of China online video companies. Due to heavy losses, video sharing company Ku6 will change its business strategy from huge copyright investment and high bandwidth construction to the development of video information business. As for other video sharing companies like 56.com, 6.cn and Baomihua.com, whose business is dominated by video information and community video, they need to share revenue with users and advertisers, and their content and bandwidth costs are relatively lower.

In the field of video on demand / live video, by virtue of the soaring revenue from copyright distribution, Letv achieved operating income of RMB 104.752 million in 2011Q1, up 131.99% YoY; and the net income reached RMB 29.0642 million, up 83.75% YoY. Sohu Video adopted the strategy of broadcasting popular movies or TV dramas exclusively resulting in pre-tax income of US$ 33 million in 2010, about three times as much as in 2009. Mainly engaged in genuine long video business with high bandwidth and content costs, Qiyi was at a loss. In 2010, Joy.cn obtained revenue of RMB 200 million, including membership fee income of about RMB 160 million.

In the field of P2P streaming media, Xunlei’s video advertising business exceeded download business in revenue and realized profit in 2009. In 2011Q1, the bandwidth costs were RMB 14.93 million, up 104.0% YoY; the content costs were RMB 9.144 million, up 142.9% YoY. PPTV, PPStream and UUSee are three big companies in this field, and achieved annual revenue of nearly RMB 100 million in 2010, the content purchasing costs were RMB tens of millions or even more than RMB 100 million while the bandwidth costs were only about 5% of those of the video sharing websites.

Traditional media online video companies, including CNTV, SMGBB and Phoenix New Media, develop quickly relying on television stations’ abundant content resources as well as brand advantages, and their main source of profit involves advertising, copyright distribution and the cooperation with telecom operators.
第一章 网络视频行业概述
1.1  网络视频行业特征
1.1.1网络视频行业核心要素
1.1.2 网络视频行业监管
1.2    网络视频产业链分析

第二章  中国网络视频行业发展概况
2.1网络视频用户增长空间巨大
2.2  视频网站营收增长潜力巨大
2.3 中国网络视频行业竞争格局未定
2.4 中国视频行业仍处于摸索阶段

第三章 视频分享网站
3.1优酷
3.1.1 公司简介
3.1.2 公司运营
3.1.3 发展战略
3.2土豆
3.2.1 公司简介
3.2.2 公司运营
3.2.3 公司战略
3.3 酷6
3.3.1 公司简介
3.3.2 公司运营
3.3.3 发展战略
3.4 我乐
3.5 六间房
3.6 爆米花

第四章 视频点播/直播类网站
4.1 乐视
4.1.1 公司简介
4.1.2 公司运营
4.1.3 发展战略
4.2 激动网
4.3 搜狐视频
4.4新浪视频
4.5奇艺

第五章 P2P播放平台
5.1迅雷
5.1.1 公司简介
5.1.2 公司营收
5.1.3 发展战略
5.2 PPTV
5.3 PPStream
5.4 UUSee

第六章 传统媒体网络视频运营商
6.1 东方宽频
6.2 CNTV.CN
6.3芒果TV
6.4凤凰新媒体

1. Overview of Online Video Industry
1.1 Characteristics
1.1.1 Key Elements
1.1.2 Industry Regulation
1.2 Industry Chain

2. Overview of Online Video Industry in China
2.1 Big Increase Potential for Online Video Subscribers
2.2 Great Revenue Growth Potential for Online Video Websites
2.3 Uncertainty of Competitive Pattern for Chinese Online Video Industry
2.4 China Online Video Industry Staying at an Exploratory Stage

3. Video Sharing Websites
3.1 Youku.com
3.1.1 Profile
3.1.2 Operation
3.1.3 Strategies
3.2 Tudou.com
3.2.1 Profile
3.2.2 Operation
3.2.3 Strategies
3.3 Ku6.com
3.3.1 Profile
3.3.2 Operation
3.3.3 Strategies
3.4 56.com
3.5 6.cn
3.6 Baomihua.com

4. Video on Demand (VOD) / Live Websites
4.1 Letv.com
4.1.1 Profile
4.1.2 Operation
4.1.3 Strategies
4.2 Joy.cn
4.3 Tv.sohu.com
4.4 Video.sina.com.cn
4.5 Qiyi.com

5. P2P Broadcast Platforms
5.1 Xunlei
5.1.1 Profile
5.1.2 Operation
5.1.3 Strategies
5.2 PPTV
5.3 PPstream
5.4 UUsee

6. Traditional Media Online Video Operators
6.1 Smgbb.cn
6.2 CNTV.CN
6.3 Imgo.tv
6.4 Ifeng.com (Phoenix New Media Limited)
表:网络视频行业主流技术
表:网络视频运营商内容来源
表:网络视频盈利模式
表:网络视频运营商分类
图:2006-2015年中国网络视频用户数及渗透率
图:2006-2015年中国网络视频市场规模及增长率
图:2010年中国在线视频营收组成
表:2009年9月主要网络视频网站访问次数排名
表:2011年4月主要网络视频网站访问次数排名
图:中国网络视频厂商融资情况
图:2010中国网络视频市场厂商收入份额
图:2011Q1中国网络视频市场厂商收入份额
图:2008-2011年优酷营业收入及净利润
图:2008-2011年优酷营收(分业务)组成
图:2007-2010年优酷前十大客户营收贡献
表:2008-2011年土豆营收及净利润
图:2008-2010年土豆营收(分业务)组成
图:2010年土豆网营收各业务比例
图:2008-2010年土豆网广告客户数量及营收贡献
图:2010Q1-Q4土豆网手机视频点播业务收入
图:2008Q1-2011Q1酷6营收及变化情况
图:2008Q1-2011Q1酷6成本及变化情况
图:2010Q1-2011Q1酷6净亏损
表:公司业务的主要盈利模式
表:2008-2010年通过电信运营商获得的点播服务收入
图:2007-2011年乐视网持续业务产生的收入
表:2010年乐视网拟募投项目
图:2009Q2-2011Q1迅雷净营收及增速
图:2009Q2-2011Q1迅雷付费用户数
图:2008-2011迅雷营收组成(分业务)
图:2008-2011迅雷成本组成
图:2008-2010年迅雷营业利润及净利润
表:迅雷募投资金投资计划

Mainstream technique of Online Video Industry
Content Source of Online Video Operators
Profit Model of Online Video Industry
Classification of Online Video Operators
Subscribers Scale and Penetration of Online Video Industry in China, 2006-2015
Market Scale and Growth Rate of Online Video Industry in China, 2006-2015
Operating Income Structure of Online Video Industry in China, 2010
Ranking of Main Online Video Websites by Visit Times, Sep. 2009
Ranking of Main Online Video Websites by Visit Times, Apr. 2011
Financing of Online Video Enterprises in China, 2005-2010
Revenue of China Online Video Market by Enterprise, 2010
Revenue of China Online Video Market by Enterprise, 2011Q1
Operating Income and Net Income of Youku, 2008-2011
Operating Income of Youku by Business, 2008-2011
Operating Income of Youku from Top 10 Customers, 2007-2010
Operating Income and Net Income of Tudou, 2008-2011
Operating Income of Tudou by Business, 2008-2011
Operating Income Structure of Tudou by Business, 2010
Number of Advertising Customers and Their Contribution to Operating Income of Tudou, 2008-2010
Revenue of Tudou’ Mobile Video on demand Business, Q1-Q4 2010
Operating Income of Ku6, 2008 Q1-2011 Q1
Operating Cost of Ku6, 2008 Q1-2011 Q1
Net Loss of Ku6, 2010 Q1-2011 Q1
Major Profit Model of Letv
VOD Business Revenue of Letv, 2008-2010
Revenue from Continuous Business of Letv, 2007-2011
Financing Project of Letv, 2010
Net Operating Income and Growth Rate of Xunlei, 2009Q2-2011Q1
Number of Paying Subscribers of Xunlei, 2009Q2-2011Q1
Operating Income of Xunlei by Business, 2008-2011
Cost Structure of Xunlei, 2008-2011
Operating Profit and Net Income of Xunlei, 2008-2010
Financing Project of Xunlei
    如果这份报告不能满足您的要求,我们还可以为您定制报告,请留言说明您的详细需求。

2005-2010 www.pday.com.cn 版权所有
在线客服系统