|
|
|
报告导航:研究报告—
制造业—化工
|
|
2011-2015年中国PTA产业链研究报告 |
 |
字数:2.2万 |
页数:73 |
图表数:72 |
|
中文电子版:7500元 |
中文纸版:3750元 |
中文(电子+纸)版:8000元 |
|
英文电子版:1800美元 |
英文纸版:1900美元 |
英文(电子+纸)版:2100美元 |
|
编号:HK006
|
发布日期:2011-10 |
附件:下载 |
 |
|
|
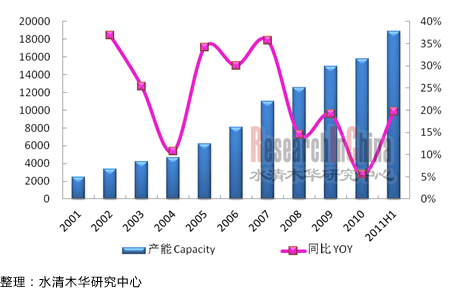
PTA(精对苯二甲酸)是重要的化纤原料。2001-2010年,中国PTA产能增长迅速,年均增长率为23.1%。2010年中国PTA产能达1579万吨,进口依赖率逐步下降到30%左右。预计未来几年中国PTA产能仍将保持15%以上的增长速度,2015年将达3600万吨以上。
图:2001-2011H1中国PTA产能及同比增长(单位:千吨)

从上游来看,PTA的原料主要为PX(对二甲苯),在PTA成本构成中PX约占85%的比例。2010年中国PX产能为986万吨,表观消费量为1100万吨,32%的PX依赖于进口。2011年,由于福佳大化PX溃坝事件,预计未来几年中国PX项目审批将会趋于严格,中国PX产能增长或将受限。但是由于生产1吨PTA约需0.66吨的PX,按目前PTA产能规划推算,2015年中国PX理论需求达近2400万吨,届时产能缺口高达400万吨,中国PTA产业链景气度将向PX行业转移。 从下游来看,PTA主要用于生产PET,约占PTA总量的90%以上。2006-2010年中国PET产能的年均增长率为9.3%,到2010年已达2930万吨。预计未来几年中国PET产能仍将保持9%的增长速度,到2015年将达4600万吨以上。按生产1吨PET需0.85-0.86吨的PTA计算, 2015年中国PTA理论需求约3900万吨以上,届时PTA供需将趋近平衡,利于PTA行业发展。 中国PTA行业生产企业规模大,数量少,产能集中度高。截止2011年6月底,中国PTA生产企业有19家,其中前五家PTA产能占全国总产能的53.4%。浙江逸盛和逸盛大化是中国PTA产能较大的两家生产企业,目前其PTA产能分别为330万吨/年和200万吨/年,分别占中国PTA总产能的17.5%和10.6%。 此外,中国部分PET厂商也纷纷向上游扩张,建设PTA项目,通过PX-PTA-PET一体化,提升公司的抗风险能力和市场竞争力。如三房巷和腾龙集团合资兴建的120万吨/年PTA项目,已于2011年9月进入调试生产阶段;桐昆集团投资建设的80万吨/年PTA项目,预计于2012年上半年建成投产。
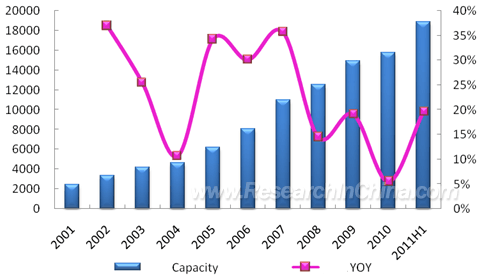
PTA (pure terephthalic acid) is an important chemical fiber raw material. During 2001-2010, the PTA capacity in China increased rapidly with an AAGR of 23.1%. In 2010, PTA capacity reached 15.79 million tons in China, and the import dependency fell to 30% or so. The capacity is predicted to maintain the growth rate of above 15% in next a few years, and it will be up to above 36 million tons in 2015.
Capacity and YoY Change of PTA in China, 2001- H1 2011 (Unit: kiloton)  Source: ResearchInChina From the aspect of upstream industries, the primary raw material of PTA is PX (paraxylene), and the PX makes up around 85% of the total PTA cost. In 2010, the PX capacity was 9.86 million tons and its apparent consumption reached 11 million tons in China; however, 32% of the PX in China was imported. Due to the dike breach accident of Fujia Dahua in 2011, it is predicted that the examination and approval on PX projects in China will tend to be more stringent and the capacity growth of PX in China may be restrained. It needs 0.66 ton of PX to produce one ton of PTA, then the theoretical demand for PX in China will be nearly 24 million tons in 2015 according to the current PTA capacity planning; by then, the capacity insufficiency may reach up to 4 million tons. In Chinese PTA industrial chain, PX industry will be booming. From the aspect of downstream industries, more than 90% of PTA is used to produce PET. During 2006-2010, Chinese PET capacity presented an AAGR of 9.3% and the capacity hit 29.3 million tons in 2010. It is expected that Chinese PET capacity will still grow at a rate of 9% in the future, and will exceed 46 million tons in 2015. To produce one ton of PET needs about 0.85-0.86 ton of PTA, then the theoretical demand for PTA in China in 2015 may be approximately 39 million tons. By then, the demand and supply of PTA will be balanced, which is favorable to the development of PTA industry. The manufacturers in China PTA industry are characterized by large scale, small quantity and high capacity concentration. By the end of June 2011, there had been 19 PTA manufacturers in China; the PTA capacity of top five enterprises had accounted for 53.4% of the total capacity nationwide. As the two larger producers, the PTA capacity of Zhejiang Yisheng and Yisheng Dahua reached 3.3Mt/a and 2.0Mt/a respectively, sharing 17.5% and 10.6% of the total PTA capacity in China separately. Besides, some Chinese PET manufacturers have extended into upstream sectors and built PTA projects to improve their anti-risk ability and market competitiveness through PX-PTA-PET integration. For instance, the 1.2Mt/a PTA Project jointly constructed by Sanfangxiang Group and Tenglong Group entered the commissioning and trial production stage in September 2011. The 800kt/a PTA Project invested and constructed by Tongkun Group will be completed and put into production in H1 2012.
第一章 PTA行业概述
1.1 概述
1.2 产业链
第二章 世界PTA行业发展状况分析
2.1 供需分析
2.2 竞争结构
2.3 发展趋势
第三章 中国PTA行业分析
3.1 运行环境
3.2 发展历程
3.3 行业特征
3.4 市场供给
3.5 市场需求
3.6 竞争格局
3.7 进出口分析
3.8 价格走势
3.9 发展前景
第四章 上游PX行业分析
4.1 概述
4.2 市场供给
4.3 市场需求
4.4 进出口分析
4.5 价格分析
4.6发展前景
第五章 下游PET行业分析
5.1 概述
5.2 发展历程
5.3 市场供给
5.4 市场需求
5.5 竞争结构
5.6 进出口分析
5.7 价格分析
5.8发展前景
第六章 主要生产企业
6.1 荣盛石化
6.1.1 公司简介
6.1.2 经营情况
6.1.3 PTA业务
6.1.4 逸盛大化
6.1.5 2012-2013年发展预测
6.2 恒逸石化
6.2.1 公司简介
6.2.2 经营情况
6.2.3 PTA业务
6.2.4 浙江逸盛
6.2.5 2012-2013年发展预测
6.3 远东石化
6.3.1 公司简介
6.3.2 经营情况
6.3.3 2012年发展预测
6.4 其他民营企业
6.4.1 鹏威石化
6.4.2 佳龙石化
6.4.3 汉邦石化
6.5 仪征化纤
6.5.1 公司简介
6.5.2 经营分析
6.5.3 PTA业务
6.5.4 发展动态
6.6 中石化PTA业务
6.6.1 概述
6.6.2 扬子石化
6.6.3 上海石化
6.6.4 天津石化
6.6.5 洛阳石化
6.6.6 发展前景
6.7 中石油PTA业务
6.7.1 概述
6.7.2 辽阳石化
6.7.3 乌鲁木齐石化
6.7.4 发展前景
6.8 济南正昊
6.9 翔鹭石化
6.9.1 公司简介
6.9.2 经营情况
6.9.3 2012年发展预测
6.10 宁波台化
6.10.1 公司简介
6.10.2 经营情况
6.10.3 发展动态
6.11 亚东石化
6.11.1 公司简介
6.11.2 经营情况
6.11.3 发展动态
6.12 珠海BP
6.12.1 公司简介
6.12.2 经营情况
6.12.3 2012年发展预测
6.13 宁波三菱
6.13.1 公司简介
6.13.2 经营情况
6.13.3 发展动态
6.14 其他公司PTA项目
6.14.1 桐昆集团80万吨/年PTA项目
6.14.2 中国化学100万吨/年PTA项目
6.14.3 海伦化学120万吨/年PTA项目
6.14.4 盛虹集团150万吨/年PTA项目
6.14.5 开氏石化120万吨/年PTA项目
6.14.6 大连恒力240万吨/年PTA项目
第七章 2012-2015年中国PTA产业链发展预测
7.1 产能预测
7.2 供需预测
7.2.1 PX-PTA供需预测
7.2.2 PTA-PET供需预测
7.3 结论
1. Overview of PTA Industry
1.1 Overview
1.2 Industry Chain
2. Global PTA Industry
2.1 Supply & Demand
2.2 Competition Pattern
2.3 Development Trend
3. China PTA Industry
3.1 Environment
3.2 Development
3.3 Characteristics
3.4 Supply
3.5 Demand
3.6 Competition Pattern
3.7 Import & Export
3.8 Price
3.9 Prospect
4. Upstream PX Industry
4.1 Overview
4.2 Supply
4.3 Demand
4.4 Import & Export
4.5 Price
4.6 Prospect
5. Downstream PET Industry
5.1 Overview
5.2 Development
5.3 Supply
5.4 Demand
5.5 Competition Pattern
5.6 Import & Export
5.7 Price
5.8 Prospect
6. Major PTA Manufacturers
6.1 Rongsheng Petrochemical
6.1.1 Profile
6.1.2 Operation
6.1.3 PTA Business
6.1.4 Yisheng Dahua Petrochemicals
6.1.5 Development Forecast for 2012-2013
6.2 Hengyi Petrochemical
6.2.1 Profile
6.2.2 Operation
6.2.3 PTA Business
6.2.4 Zhejiang Yisheng Petrochemicals
6.2.5 Development Forecast for 2012-2013
6.3 Far Eastern Petrochemical
6.3.1 Profile
6.3.2 Operation
6.3.3 Prospect in 2012
6.4 Other Private Enterprise
6.4.1 Chongqing Pengwei Petrochemical
6.4.2 Jialong Petrochemical
6.4.3 Hanbon Petrochemical
6.5 Sinopec Yizheng Chemical Fibre
6.5.1 Profile
6.5.2 Operation
6.5.3 PTA Business
6.5.4 Dynamics
6.6 Sinopec’s PTA Business
6.6.1 Overview
6.6.2 Sinopec Yangzi
6.6.3 Sinopec Shanghai
6.6.4 Sinopec Tianjin
6.6.5 Sinopec Luoyang
6.6.6 Prospect
6.7 CNPC’s PTA Business
6.7.1 Overview
6.7.2 CNPC Liaoyang Petrochemical
6.7.3 CNPC Urumqi Petrochemical
6.7.4 Prospect
6.8 Jinan Zhenghao Chemical Fiber New Material
6.9 Xianglu Petrochemicals (Xiamen)
6.9.1 Profile
6.9.2 Operation
6.9.3 Development Forecast for 2012
6.10 Formosa Chemicals Industries (Ningbo)
6.10.1 Profile
6.10.2 Operation
6.10.3 Dynamics
6.11 Oriental Petrochemical (Shanghai)
6.11.1 Profile
6.11.2 Operation
6.11.3 Dynamics
6.12 BP Zhuhai Chemical Company
6.12.1 Profile
6.12.2 Operation
6.12.3 Development Forecast for 2012
6.13 Ningbo Mitsubishi Chemical
6.13.1 Profile
6.13.2 Operation
6.13.3 Dynamics
6.14 PTA Projects of Other Corporations
6.14.1 800kt/a PTA Project of Tongkun Group
6.14.2 1.0Mt/a PTA Project of China National Chemical Engineering
6.14.3 1.2 Mt/a PTA Project of Jiangsu Sanfangxiang Group
6.14.4 1.5 Mt/a PTA Project of Shenghong Group
6.14.5 1.2 Mt/a PTA Project of Kaishi Petrochemical
6.14.6 2.4 Mt/a PTA Project of Hengli Group
7. Development Forecast for China PTA Industry Chain, 2012-2015
7.1 Capacity
7.2 Supply & Demand
7.2.1 PX-PTA
7.2.2 PTA-PET
7.3 Conclusion
图:PTA产业链
图:2006-2011E全球及中国PTA产能
图:2009年全球PTA产能分布
图:2009年亚洲PTA产能分布
图:2001-2011H1中国PTA产能及同比增长
表:2010-2011H1中国PTA生产企业产能
表:2011-2015年中国PTA新增产能预测
图:2001-2010年中国PTA产量、表观消费量及进口依存度
表:2011H1中国主要PTA生产企业及其产能占比
图:2010-2011H1中国PTA产能地区分布
图:2007-2011H1中国PTA进出口量
图:2007-2011H1中国PTA进出口金额
图:2007-2011H1中国PTA进出口平均价格
图:2010中国PTA进口来源国家和地区分布
图:2010中国PTA出口国家和地区分布
图:2010-2011年中国华东及华北地区PTA市场价格
图:2001-2010年中国PX产能及同比增长
图:2001-2010年中国PX产量、表观消费量及进口依存度
图:2007-2011H1中国PX进出口量
图:2007-2011H1中国PX进出口金额
图:2007-2011H1中国PX进出口单价
图:2010年中国PX进出国家和地区分布
图:2010年中国PX出口国家和地区分布
图:2010-2011年中国PX市场价格
图:2010年纺织纤维分类及占比
图:2006-2011E中国聚酯产能及同比增长
图:2006-2011H1中国涤纶纤维产量和表观消费量
图:2006-2011H1中国涤纶长丝和涤纶短纤产量
图:1998-2010年中国涤纶纤维生产企业数量
图:2010年中国涤纶纤维产量地区分布
图:2010年中国聚酯企业竞争格局
图:2007-2011H1中国涤纶纤维进出口量
图:2007-2011H1中国涤纶纤维进出口金额
图:2007-2011H1中国涤纶纤维进出口单价
图:2006-2011年中国涤纶纤维主要产品价格
图:荣盛石化主要产品及产品间联系
图:2008-2011H1荣盛石化营业收入及营业利润
图:2009-2011H1荣盛石化(分产品)营业收入
图:2009-2011H1荣盛石化(分产品)毛利率
图:2009-2011H1荣盛石化(分地区)营业收入
表:2011H1荣盛石化PTA业务相关公司及持股比例
图:荣盛石化PTA业务营业收入及营业利润
图:2008-2010年逸盛大化营业收入及净利润
表:2010-2013E年荣盛石化PTA权益产能
图:2011E-2013E荣盛石化营业收入及毛利润
图:恒逸石化主要产品及产品间联系
图:2010H1&2011H1恒逸石化营业收入及营业利润
图:2011H1恒逸石化(分产品)营业收入
图:2011H1恒逸石化(分产品)毛利率
表:恒逸石化PTA业务相关公司及持股比例
表:2010-2013E年恒逸石化PTA权益产能
图:2010H1&2011H1恒逸石化PTA业务营业收入及营业利润
图:2007-2010年浙江逸盛营业收入及净利润
图:2007-2010年浙江逸盛产品毛利率
图:2011E-2013E恒逸石化营业收入及毛利润
图:2007-2009年远东石化主营业务收入、营业利润及毛利率
图:2008-2011H1仪征化纤营业收入及营业利润
图:2009-2011H1仪征化纤(分产品)营业收入
图:2009-2011H1仪征化纤(分地区)营业收入
图:2009-2011H1仪征化纤主要产品价格走势
图:2009-2011H1仪征化纤PTA对内、对外销售收入
图:2007-2011H1仪征化纤PTA产量
表:2011H1中石化PTA业务子公司及其产能
表:2011H1中石油PTA业务子公司及其产能
图:2007-2009年翔鹭石化主营业务收入、营业利润及毛利率
图:2008-2009年宁波台化主营业务收入及营业利润
图:2007-2009年亚东台化主营业务收入、营业利润及毛利率
图:2008-2010年珠海BP公司PTA产量及同比增长
图:2007-2009年宁波三菱主营业务收入、营业利润及毛利率
图:2001-2015E中国PX、PTA、PET产能走势及预测
表:2011E-2015E中国PX-PTA供需预测
表:2011E-2015E中国PTA-PET供需预测
PTA Industry Chain
PTA Capacity in China and the World, 2006-2011E
PTA Capacity by Region Worldwide, 2009
PTA Capacity by Region in Asia, 2009
Capacity and YoY Change of PTA in China, 2001- H1 2011
PTA Manufacturers and Their Capacity in China, 2010 - H1 2011
New PTA Capacity in China, 2011E-2015E
PTA Output, Apparent Consumption and Import Dependence in China, 2001-2010
Major PTA Manufacturers and Their Capacity Proportion in China, H1 2011
PTA Capacity by Region in China, 2010- H1 2011
PTA Import and Export Volume in China, 2007- H1 2011
PTA Import and Export Value in China, 2007- H1 2011
PTA Import and Export Average Price in China, 2007- H1 2011
Import Origins of PTA in China, 2010
Export Destinations of Chinese PTA, 2010
PTA Market Price in East and North China, 2010-2011
PX Capacity and YoY Change in China, 2001-2010
PX Output, Apparent Consumption and Import Dependence in China,2001-2010
PX Import and Export Volume in China, 2007- H1 2011
PX Import and Export Value in China, 2007- H1 2011
PX Import and Export Average Price in China, 2007- H1 2011
Import Origins of PX in China, 2010
Export Destinations of Chinese PX, 2010
PX Market Price in China, 2010-2011
Classification and Proportion of Textile Fibre, 2010
Polyster Capacity and YoY Change in China, 2006-2011E
Polyster Output and Apparent Consumption in China, 2006-2011E
Output of Polyester Filament Yarn and Polyester Staple Fiber in China, 2006- H1 2011
Number of Polyster Companies in China, 1998-2010
Polyster Output by Region in China, 2010
Competition among Polyster Manufacturers in China, 2010
Polyster Import and Export Volume in China, 2007- H1 2011
Polyster Import and Export Value in China, 2007- H1 2011
Polyster Import and Export Average Price in China, 2007- H1 2011
Prices of Main Polyster Products in China, 2006-2011
Main Products and Relationship among Them of Rongsheng Petrochemical
Operating Revenue and Operating Income of Rongsheng Petrochemical, 2008- H1 2011
Operating Revenue of Rongsheng Petrochemical by Product, 2009- H1 2011
Gross Margin of Rongsheng Petrochemical by Product, 2009- H1 2011
Operating Revenue of Rongsheng Petrochemical by Region, 2009- H1 2011
PTA Related Companies and Their Shareholding Ratio of Rongsheng Petrochemical, H1 2011
Operating Revenue and Operating Income of Rongsheng Petrochemical in PTA Business, 2009- H1 2011
Operating Revenue and Net Income of Yisheng Dahua Petrochemicals in PTA Business, 2008-2010
PTA Equity Capacity of Rongsheng Petrochemical, 2010-2013E
Operating Revenue and Gross Profit of Rongsheng Petrochemical, 2011E-2013E
Main Products and Relationship among Them of Hengyi Petrochemical
Operating Revenue and Operating Income of Hengyi Petrochemical, H1 2010& H1 2011
Operating Revenue of Hengyi Petrochemical by Product, H1 2011
Gross Margin of Hengyi Petrochemical by Product, H12011
PTA Related Companies and Their Shareholding Ratio of Hengyi Petrochemical, H1 2011
PTA Equity Capacity of Hengyi Petrochemical, 2010-2013E
Operating Revenue and Operating Income of Hengyi Petrochemical PTA Business, H1 2010& H1 2011
Operating Revenue and Net Income of Zhejiang Yisheng Petrochemicals, 2007-2010
Gross Margin of Zhejiang Yisheng Petrochemicals, 2007-2010
Operating Revenue and Gross Profit of Hengyi Petrochemical, 2011E-2013E
Operating Revenue, Operating Income and Gross Margin of Far Eastern Petrochemical, 2007-2009
Operating Revenue and Operating Income of Sinopec Yizheng Chemical Fibre, 2008- H1 2011
Operating Revenue of Sinopec Yizheng Chemical Fibre by Product, 2009- H1 2011
Operating Revenue of Sinopec Yizheng Chemical Fibre by Region, 2009- H1 2011
Prices of Main Products of Sinopec Yizheng Chemical Fibre, 2009- H1 2011
Domestic PTA Sales and Overseas PTA Sales of Sinopec Yizheng Chemical Fibre, 2009- H1 2011
PTA Output of Sinopec Yizheng Chemical Fibre, 2007- H1 2011
Sinopec's Subsidiaries Engaged in PTA Business and Their Capacity, H1 2011
CNPC's Subsidiaries Engaged in PTA Business and Their Capacity, H1 2011
Operating Revenue, Operating Income and Gross Margin of Xianglu Petrochemicals, 2007-2009
Operating Revenue and Operating Income of Formosa Chemicals Industries (Ningbo), 2008-2009
Operating Revenue, Operating Income and Gross Margin of Oriental Petrochemical (Shanghai) Corporation, 2007-2009
PTA Output and YoY Change of BP Zhuhai Chemical Company, 2008-2010
Operating Revenue, Operating Income and Gross Margin of Ningbo Mitsubishi Chemical Company, 2007-2009
Capacity Forecast for PX, PTA and PET in China, 2001-2015E
Forecast for PX-PTA Supply & Demand in China, 2011E-2015E
Forecast for PTA-PET Supply & Demand in China, 2011E-2015E
如果这份报告不能满足您的要求,我们还可以为您定制报告,请 留言说明您的详细需求。
|