|
|
|
报告导航:研究报告—
金融与服务业—零售与日用
|
|
2011年中国医药连锁行业研究报告 |
 |
字数:2.0万 |
页数:72 |
图表数:86 |
|
中文电子版:7000元 |
中文纸版:3500元 |
中文(电子+纸)版:7500元 |
|
英文电子版:1800美元 |
英文纸版:1900美元 |
英文(电子+纸)版:2100美元 |
|
编号:XX010
|
发布日期:2012-01 |
附件:下载 |
 |
|
|
在中国医药流通领域,由于流通环节较多,医药流通企业利润率较低。以销售额来看,目前约有20%的药品通过医药零售企业销售给消费者,其他的80%左右的药品则通过医院(包括综合医院和社区与农村卫生院)销售给消费者。 2010年,中国药店的药品销售额为1408亿元人民币,同比增长10.16%,占比20.98%;而医院的药品销售额则为5310亿元人民币,同比增长16.96%,占比79.02%。中国药店的近三年平均药品销售额增速为12.16%,依然保持平稳较快发展。 图:2007-2010年中国药品销售额(按最终销售终端不同)(单位:十亿元) 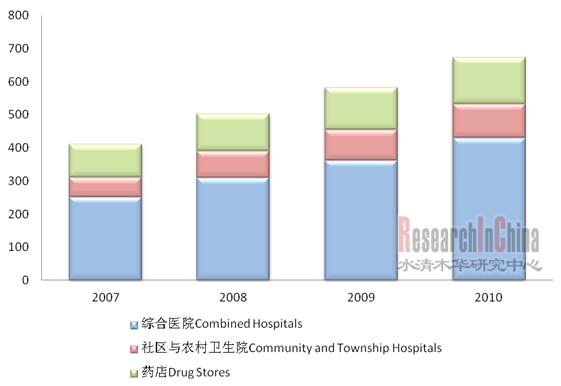 来源:卫生部;整理:水清木华研究中心 本报告除了介绍了中国医药流通行业,中国医药连锁行业的情况外,还详细介绍了中国医药连锁百强企业的发展概况、门店结构、销售结构及经营效率情况,此外,报告还对重点企业进行了较为详尽的分析,并在最后一章给出行业分析及趋势总结。 自2008年以来,中国医药连锁企业数量逐年下降,但单个企业的门店规模则成逐步上升的趋势。2007-2010年,中国药店数量的三年平均增长率为7%左右。这说明医药连锁行业集中度虽然仍处于较低水平,但集中度在逐步提高。 深圳市海王星辰医药有限公司为目前中国大陆直营门店数最多的药店连锁企业,其药店分布在全中国14个省的74个城市。截至2011年9月30日,海王星辰拥有2927家直营连锁药房。2011年前三季度,海王星辰实现营业收入18.33亿元人民币,同比增长6%。2011年前三季度,海王星辰实现净利润1827万元人民币,而2010年前三季度亏损40.1万元。 重庆桐君阁大药房连锁有限责任公司主要采用加盟模式进行发展。截止2011年9月30日,公司拥有直营店1272家,加盟店6438家。2010年公司实现销售额336000万元,同比增长33%。
In China, the pharmaceutical circulation enterprises see relatively low
profit margin due to many circulation links. By sales value, some 20%
drugs are sold to consumers through pharmaceutical retail firms, and the
rest 80% are sold out through hospitals (with general hospitals,
community and township hospitals included). In 2010, the sales of
drug stores in China increased by 10.16% year-on-year to RMB140.8
billion, accounting for 20.98%; while that of hospitals rose 16.96%
year-on-year to RMB531 billion, making up 79.02%. In recent three years,
the average sales value for drug stores has maintained moderate growth
by 12.16%. Drug Sales in China, 2007-2010 (by Sales Terminal) (Unit: RMB bn) 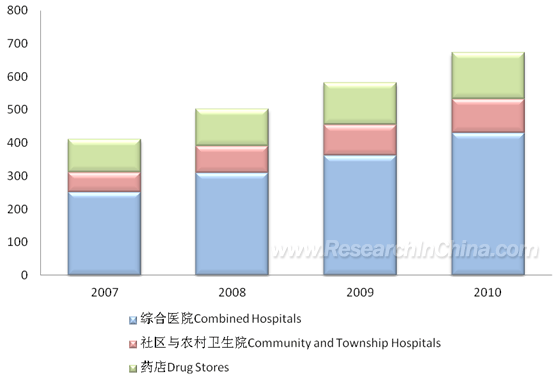 Source: Ministry of Health of the People’s Republic of China; ResearchInChina The
report introduces pharmaceutical circulation industry and
pharmaceutical chain industry of China. Besides, it highlights the
development, outlet distribution, sales structure and operation of the
top 100 China-based pharmaceutical chain enterprises. At length, the
report summarizes the industry and development tendency through
conducting a detailed analysis on key players. Since 2008, the
number of Chinese pharmaceutical chain enterprises has been declining
year after year, but the outlet scale for individual enterprise has
presented a rising trend. In 2007-2010, the number of drug stores in
China showed an average growth rate of roughly 7%, indicating that the
concentration rate is improving although the rate in the overall
industry is at a low level. China Nepstar Chain Drugstore Ltd.
is a drug store chain enterprise with the largest number of retail
outlets in Chinese Mainland, with the drugstore stretching 74 cities in
14 provinces across China. As of September 30, 2011, the company boasted
2,927 regular chain outlets. In Q1-Q3, 2011, the operating revenue of
China Nepstar Chain Drugstore Ltd. surged by 6% year-on-year to RMB1.833
billion, with the net income of RMB18.27 million. By contrast, the loss
in 2010Q1-Q3 hit RMB401, 000. For Chongqing Tongjunge
Pharmacy, it employs franchise business model for further development.
As of September 30, 2011, the company had 1,272 regular chain stores and
6,438 franchised outlets. In 2011, the sales of the company registered
RMB3.36 billion, up 33% from a year earlier.
1 概述
1.1 国际药品市场环境
1.2 中国药品市场环境
1.3 中国医药流通行业概述
1.4 中国医药连锁行业概述
1.4.1 相关政策
1.4.2 中国医药连锁发展特点
1.4.3 连锁药店概述
2 医药流通行业
2.1 概述
2.2 行业发展
2.3 发展结构
2.3.1 区域结构
2.3.2 企业规模结构
2.3.3 销售终端结构
3 医药连锁行业
3.1 企业及药店
3.2 市场发展
3.3 小结
4 连锁100强
4.1 销售规模
4.2 门店规模
4.3 销售分析
4.3.1 处方类药
4.3.2 非处方类药
4.3.3 中药饮片类
4.3.4 医疗器械
4.3.5 食品/保健品
4.3.6 自有品牌或高毛利产品
4.4 运营分析
4.4.1 客单价(年单位顾客购买额)
4.4.2 会员有效率
4.4.3 医保定点
4.4.4 经营效率
4.5 盈利和成本分析
4.5.1 盈利分析
4.5.2 成本分析
4.6 单店百强
4.6.1 规模
4.6.2 单店效率
5 重点企业分析
5.1 深圳市海王星辰医药有限公司
5.1.1 公司介绍
5.1.2 经营状况
5.1.3 连锁店网络
5.1.4 公司战略
5.2 重庆桐君阁大药房连锁有限责任公司
5.3 老百姓大药房连锁股份有限公司
5.4 广东大参林连锁药店有限公司
5.5 重庆和平药房连锁有限责任公司
5.6 湖北同济堂药房有限公司
5.7 云南鸿翔一心堂药业(集团)股份有限公司
5.8 辽宁成大方圆医药连锁投资有限公司
5.9 上海华氏大药房连锁有限公司
5.10 深圳中联大药房有限公司
5.11 江西黄庆仁栈华氏大药房有限公司
5.12 同仁堂
5.13 本章小节
6 趋势
6.1 兼并重组
6.2 物流整合
6.3 网上药店
1 Overview
1.1 International Environment for Drug Market
1.2 Environment for Chinese Drug Market
1.3 China Pharmaceutical Distribution Industry Profile
1.4 China Pharmaceutical Chain Industry Profile
1.4.1 Policy
1.4.2 Development Features of China Pharmaceutical Chain Industry
1.4.3 Overview of Drugstore Chains
2 Pharmaceutical Distribution Industry
2.1 Overview
2.2 Development
2.3 Structure
2.3.1 Regional Structure
2.3.2 Enterprises’ Scale Structure
2.3.3 Sales Terminal Structure
3 Pharmaceutical Chain Industry
3.1 Companies and Drugstores
3.2 Market Evolution
3.3 Summary
4 Top 100 Drugstore Chains
4.1 Sales Scale
4.2 Drugstore Scale
4.3 Analysis on Sales
4.3.1 Prescription
4.3.2 OTC
4.3.3 Traditional Chinese Medicine
4.3.4 Medical Device
4.3.5 Food/Health Care Products
4.3.6 Private Brands/ High Margin Products
4.4 Operation
4.4.1 Annual Sales from per Customer
4.4.2 Members Efficiency
4.4.3 Designated Medical Insurance
4.4.4 Efficiency
4.5 Profit & Cost
4.5.1 Profit
4.5.2 Cost
4.6 Top 100 Single Drugstores
4.6.1 Scale
4.6.2 Efficiency
5 Leading Companies
5.1 China Nepstar Chain Drugstore Ltd.
5.1.1 Profile
5.1.2 Operation
5.1.3 Store Network
5.1.4 Strategy
5.2 Chongqing Tongjunge Pharmacy
5.3 LBX Pharmacy
5.4 Guangdong Da Shen Lin Chain Drugstore Co., Ltd.
5.5 Chongqing Peace Drugstore
5.6 Huibei Ready Medicine Industry Co., Ltd.
5.7 Yunnan Hongxiang Yixintang Pharmacy
5.8 Liaoning Chengda Fangyuan Pharmaceutical Chain
5.9 Shanghai Hua-shi Drugstore Co., Ltd.
5.10 Shenzhen Associate Pharmacy Co., Ltd.
5.11 Huangqingren Pharmacy
5.12 Tongrentang (TRT)
5.13 Summary
6 Trends
6.1 M&A
6.2 Logistics Integration
6.3 Online Services
图:2007-2010年中国药品销售额(按最终销售终端不同)
表:2000-2010年中国医疗卫生费用及占GDP比重变化
图:2000-2009年中国医疗卫生费用构成及占比变化
表:2005-2009年中国城乡居民医疗保健支出及占消费性支出比重
图:1982-2010年中国65岁人口数及总人口占比
表:中国医药连锁行业相关政策
图:连锁药店利润来源
图:中国主要的医药流通渠道
图:2007-2010年中国药品销售额
图:2010年中国药品流通销售结构(分区域)
表:2010年中国药品批发企业主营业务收入前10
图:2007-2010年中国药品销售额(按最终销售终端不同)
图:2008-2010年中国药品不同销售终端销售额增速
图:2007-2010年中国药品终端不同销售终端销售额占比
图:2007-2010年中国医药连锁企业数量及趋势
图:2007-2010年中国药店总数及趋势
图:2007-2010年中国单体药店和连锁药店数量
图:2007-2010年中国直营连锁药店和加盟连锁药店数量
图:2007-2010年中国药店市场规模
图:2007-2010年中国药店销售结构
图:2008-2010年中国药店非药品销售构成
表:2010年中国药店非药品销售增长率(分产品)
表:2007-2010年中国医药连锁行业门店情况
表:2003-2010年中国医药连锁百强销售额
表:2009-2010年中国医药连锁百强集中度
表:2009-2010年中国连锁销售额百强直营店数量
表:2009-2010年中国连锁销售额百强门店总数
图:2009-2010年中国医药连锁行业商品品类总数区间分布
表:2010年中国医药连锁行业商品品类总数十强公司
表:2010年中国医药连锁行业处方药类销售额贡献率五强
图:2009-2010年中国医药连锁行业处方药类销售额贡献率区间分布
表:2010年中国医药连锁行业处方药类利润贡献率五强
图:2009-2010年中国医药连锁行业处方药类利润贡献区间分布
图:2009-2010年中国医药连锁行业非处方药类销售额贡献率区间分布
图:2009-2010年中国医药连锁行业非处方药类利润贡献率区间分布
图:2010年中国医药连锁行业中药饮片类销售额贡献率区间分布
图:2009-2010年中国医药连锁行业医疗器械类销售额贡献率区间分布
图:2009-2010年中国医药连锁行业医疗器械类利润贡献率区间分布
图:2010年中国医药连锁行业食品/保健品类产品销售额贡献率区间分布
图:2010年中国医药连锁行业食品/保健品类产品利润贡献率区间分布
图:2009-2010年中国医药连锁行业自有品牌或高毛利商品总数区间分布
图:2009-2010年中国医药连锁行业自有品牌或高毛利商品占商品品类总数比例区间分布
图:2009-2010年中国医药连锁行业客单价区间分布
图:2010年中国医药连锁行业客单价前三企业
表:2010年中国医药连锁行业有效会员总数前五企业
表:2010年中国医药连锁行业单位面积上有效会员数前五企业
图:2010年中国医药连锁百强医保类品种销售额占比(分区域)
图:2010年中国医药连锁行业日均坪效区间分布
图:2010年中国医药连锁行业日均人效区间分布
图:2010年中国医药连锁行业人均守备率区间分布
图:2010年中国医药连锁企业毛利率区间分布
表:2010年中国医药连锁行业费用构成
图:2010年中国医药连锁行业各个企业薪金总额增幅区间分布
表:2010年中国医药连锁行业员工流失率区间分布
表:2010年中国医药连锁行业员工流失率增速区间分布
图:2010年中国医药连锁行业一线员工占员工总数比例区间分布
图:2010年中国医药连锁行业店长月薪分布
图:2010年中国医药连锁行业普通店员月薪分布
图:2010年中国医药连锁行业执业药师月薪分布
表:2010年中国医药连锁行业单店销售额十强
表:2010年中国连锁药店行业单店销售增速五强
表:2010年中国连锁药店行业单店门店面积增速10强
表:2010年中国连锁药店行业单店门店面积减幅前5
表:2010年中国医药连锁行业单店日均营收坪效十强
表:2010年中国医药连锁行业单店利润坪效十强
图:2007-2011年海王星辰营业收入和净利润
图:2007-2011年海王星辰净利率和毛利率
图:2007-2010年海王星辰分产品营业收入
图:海王星辰分支机构
图:2005-2011年海王星辰连锁药店数量
图:2007-2010年海王星辰分地区连锁药店数量
图:2007-2011年海王星辰平均单店营收及平均单店净利
图:2007-2011年海王星辰平均单店毛利率及平均单店净利率
图:海王星辰公司战略
图:2010年海王星辰自主品牌产品和非自主品牌产品营收占比及毛利占比
图:2007-2010年老百姓大药房销售额及同比增长率
图:2007-2010年广东大参林销售额及同比增长率
图:2007-2010年重庆和平药房销售额及同比增长率
图:2007-2010年湖北同济堂销售额及同比增长率
图:2007-2010年云南鸿翔一心堂药业销售额及同比增长率
图:2007-2010年辽宁成大方圆销售额及同比增长率
图:2007-2010年上海华氏大药房销售额及同比增长率
图:2009-2010年深圳中联大药房销售额
图:2009-2010年江西黄庆仁栈华氏大药房销售额
表:2011年中国医药连锁行业前十(按直营店数量排名)
表:2011年中国医药连锁行业主要并购案例
Medical Care Expenditure and % of GDP in China, 2000-2010
Medical Care Expenditure Makeup and % Change in China, 2000-2009
Urban and Rural Medical Care Expenditures and Ratios in Consumptive Expenditure in China, 2005-2009
Population Aged above 65 and % of Total in China, 1982-2010
Policies concerning Pharmaceutical Chain Industry of China
Profit Sources of Drugstore Chains
Main Distribution Channels in China
Drug Sales in China, 2007-2010
Drug Distribution Structure in China by Region, 2010
Top 10 Drug Wholesale Companies in China by Operating Revenue, 2010
Drug Sales in China by Sales Terminal, 2007-2010
Growth Rate of Drug Sales by Sales Terminal in China, 2008-2010
Drug Sales Breakdown by Terminal, 2007-2010
China Pharmaceutical Chain Company Numbers and Trends, 2007-2010
Number of Drug Stores and Trend in China, 2007-2010
Number of Regular Chain Drugstores and Franchised Drugstores in China, 2007-2010
Drugstore Market Size in China, 2007-2010
Sales Structure of Drugstores in China, 2007-2010
Non-Drug Sales Breakdown of Drugstores in China, 2008-2010
Non-Drug Sales Growth Rate of Drugstores in China by Product, 2010
Stores Situation of China Pharmaceutical Chain Industry, 2007-2010
Sales of Top 100 Pharmaceutical Chain Companies in China, 2003-2010
Concentration of Top 100 Pharmaceutical Chain Companies in China, 2009-2010
Regular Chain Stores of Top 100 Pharmaceutical Chain Companies in China, 2009-2010
Total Stores of Top 100 Pharmaceutical Chain Companies in China, 2009-2010
Commodity Variety Distribution of China Pharmaceutical Chain Industry, 2009-2010
Top 10 Chinese Pharmaceutical Chain Companies by Commodity Number, 2010
Top 5 Pharmaceutical Chain Companies by Prescription Sales in China, 2010
Prescription Sales Contribution Distribution of China Pharmaceutical Chain Industry, 2009-2010
Top 5 Pharmaceutical Chain Companies by Prescription Profit in China, 2010
Prescription Profit Contribution Distribution of China Pharmaceutical Chain Industry, 2009-2010
OTC Sales Contribution Distribution of China Pharmaceutical Chain Industry, 2009-2010
OTC Profit Contribution Distribution of China Pharmaceutical Chain Industry, 2009-2010
Traditional Chinese Medicine Sales Contribution Distribution of China Pharmaceutical Chain Industry, 2009-2010
Medical Device Sales Contribution Distribution of China Pharmaceutical Chain Industry, 2009-2010
Medical Device Profit Contribution Distribution of China Pharmaceutical Chain Industry, 2009-2010
Food/Health Care Products Sales Contribution Distribution of China Pharmaceutical Chain Industry, 2010
Food/Health Care Products Profit Contribution Distribution of China Pharmaceutical Chain Industry, 2010
Private Brands/High Margin Products Number Distribution of China Pharmaceutical Chain Industry, 2009-2010
Proportions of Private Brands/High Margin Products in Total Commodity Varieties, 2009-2010
Annual Sales From per Customer Distribution of China Pharmaceutical Chain Industry, 2009-2010
Top 3 Companies by Annual Sales from per Customer in China Pharmaceutical Chain Industry, 2010
Top 5 Companies by Effective Member in China Pharmaceutical Chain Industry, 2010
Top 5 Companies by Effective Members per Square Meter in China Pharmaceutical Chain Industry, 2010
Medical Insurance Variety Sales Proportions of Top 100 Pharmaceutical Chains by Region in China, 2010
Daily Sales/Sq.m Distribution of China Pharmaceutical Chain Industry, 2010
Daily Sales From per Staff Distribution of China Pharmaceutical Chain Industry, 2010
Fielding Percentage Per Staff of China Pharmaceutical Chain Industry, 2010
Gross Margin Distribution of China Pharmaceutical Chain Industry, 2010
Cost Structure of China Pharmaceutical Chain Industry, 2010
Gross Salary Growth of Every Company in China Pharmaceutical Chain Industry, 2010
Staff Braindrain Distribution of China Pharmaceutical Chain Industry, 2010
Frontline Staff Percentage in Total Staff in China Pharmaceutical Chain Industry, 2010
Store Manager Salary Distribution of China Pharmaceutical Chain Industry, 2010
General Clerk Salary Distribution of China Pharmaceutical Chain Industry, 2010
Licensed Pharmacist Salary Distribution of China Pharmaceutical Chain Industry, 2010
Top 10 Single Drugstore Sales of China Pharmaceutical Chain Industry, 2010
Sales Growth Rates of Top 5 Single Drugstores in China Pharmaceutical Chain Industry, 2010
Area Growth Rates of Top 10 Single Drugstores in China Pharmaceutical Chain Industry, 2010
Area Decrease Rates of Top 5 Single Drugstores in China Pharmaceutical Chain Industry, 2010
Daily Operating Revenue/Sq.m of Top 10 Single Drugstores in China Pharmaceutical Chain Industry, 2010
Profit/Sq.m of Top 10 Single Drugstores in China Pharmaceutical Chain Industry, 2010
Operating Revenue and Net Income of China Nepstar Chain Drugstore Ltd., 2007-2011
Gross Margin and Net Profit Margin of China Nepstar Chain Drugstore Ltd., 2007-2011
Operating Revenue of China Nepstar Chain Drugstore Ltd. by Product, 2007-2011
Branches of Nepstar Chain Drugstore
Drugstore Number of China Nepstar Chain Drugstore Ltd., 2005-2011
Drugstore Number of China Nepstar Chain Drugstore Ltd. by Region, 2007-2011
Average Operating Revenue and Net Income from Single Drugstore of China Nepstar Chain Drugstore Ltd., 2007-2011
Average Gross Margin and Net Profit Margin from Single Drugstore of China Nepstar Chain Drugstore Ltd., 2007-2011
Strategies of China Nepstar Chain Drugstore Ltd.
Operating Revenue and Gross Profit Percentages of Private Brands and Non-private Brands of China
Sales and YoY Growth of LBX Pharmacy, 2007-2010
Sales and YoY Growth of Guangdong Da Shen Lin Chain Drugstore Co., Ltd., 2007-2010
Sales and YoY Growth of Chongqing Peace Drugstore, 2007-2010
Sales and YoY Growth of Huibei Ready Medicine Industry Co., Ltd., 2007-2010
Sales and YoY Growth of Yunnan Hongxiang Yixintang Pharmacy, 2007-2010
Sales and YoY Growth of Liaoning Chengda Fangyuan Pharmaceutical Chain, 2007-2010
Sales and YoY Growth of Shanghai Hua-shi Drugstore Co., Ltd., 2007-2010
Sales of Shenzhen Associate Pharmacy Co., Ltd, 2009-2010
Sales of Huangqingren Pharmacy, 2009-2010
Top 10 Companies of China Pharmaceutical Chain Industry by Regular Chain Number, 2011
Key M&A Cases in China Pharmaceutical Chain Industry, 2011
如果这份报告不能满足您的要求,我们还可以为您定制报告,请 留言说明您的详细需求。
|