|
|
|
报告导航:研究报告—
制造业—能源矿产
|
|
2010-2011年中国氧化铝行业研究报告 |
 |
字数:2.7万 |
页数:63 |
图表数:48 |
|
中文电子版:6000元 |
中文纸版:3000元 |
中文(电子+纸)版:6500元 |
|
英文电子版:1600美元 |
英文纸版:1700美元 |
英文(电子+纸)版:1900美元 |
|
编号:SSX015
|
发布日期:2012-03 |
附件:下载 |
 |
|
|
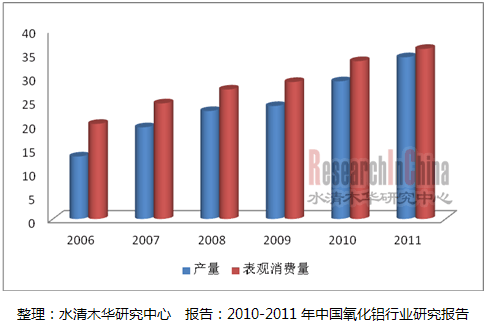
氧化铝作为原铝冶炼的最基本原料,主要通过电解法制金属铝。2011年以来,在盈利状况明显向好的情况下,全球各大铝业公司纷纷加快了产能重启以及新建的步伐。2011年上半年,全球氧化铝产量达到4592万吨,同比增长8.55%。其中,中国氧化铝产量达到1745万吨,同比增长18.1%,是拉动全球氧化铝产量回升的主要动力。 氧化铝消费主要来自下游原铝需求,也就是对冶金级氧化铝的需求。除2009年受金融危机影响有所下滑之外,近年来全球冶金级氧化铝市场需求整体保持平稳增长趋势。2010年,全球冶金级氧化铝表观消费量约为8142万吨,同比增长8.2%。2011年,在全球原铝产能复苏,对冶金级氧化铝需求持续上升的情况下,全年冶金级氧化铝表观消费量约为8445万吨,较2010年小幅增长3.7%。 图:2006-2011年中国氧化铝产量和表观消费量(单位:百万吨)  中国氧化铝行业主要有以下几个运行特点: ◎ 区域和行业集中度较高:中国氧化铝行业的集中度较高,2011年几大主要电解铝生产企业总产能占全国总产能的80%以上。中国氧化铝生产主要集中在山东、河南、广西、山西、贵州、重庆、内蒙古等七省区,其中2011年山东和河南两省分别占到33.9%、25.7%。 ◎ 短期将继续供大于求:目前氧化铝供应处于过剩状态,再加上限电造成电解铝减产,使得氧化铝的需求下滑。相对电解铝,氧化铝生产用电较少,所以同时生产电解铝及氧化铝的厂商选择关停部分电解铝生产线而尽量维持氧化铝生产,因此氧化铝不会出现明显减产,供给减少有限。 ◎ 净进口呈减少趋势:近年来,中国在氧化铝进出口贸易中一直处于净进口国的局面,国内电解铝产能扩张对上游氧化铝原料需求的持续增长是主要的影响因素。而伴随着中国氧化铝产能的持续扩张,目前氧化铝市场自给率的大幅提升,氧化铝进口需求明显转弱,中国氧化铝进出口贸易国逆差已呈持续缩小的趋势。2011年中国共进口氧化铝188万吨,同比下降56.38%。
Alumina, as the basic raw material in primary aluminum smelting, is
chiefly used to produce metallic aluminum through electrolysis. With
bettering profitability since 2011, the large aluminum corporations
around the globe have sped up capacity resumption and expansion
successively. In H1 2011, global output of alumina reached 45.92 million
tons, up 8.55% YoY, among which the alumina output in China registered
17.45 million tons, rising18.1% YoY, and a major engine for the
rebounding of alumina output in the world. The alumina is mainly
consumed by downstream primary aluminum demands, i.e., the demand for
metallurgical alumina. The market demand for metallurgical alumina
globally has maintained steady growth as a whole in recent years except
2009 (a fall affected by financial crisis). In 2010, the apparent
consumption of metallurgical alumina worldwide approximated 81.42
million tons, rising 8.2% from a year earlier, while in 2011, the figure
increased by just 3.7% year-on-year to around 84.45 million tons under
the backdrop of the recovering global capacity of primary aluminum as
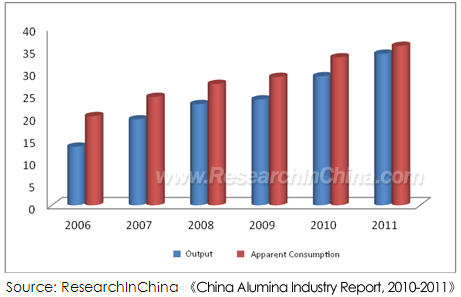
well as the growing demand for metallurgical alumina. Output and Apparent Consumption of Alumina in China, 2006-2011 (Unit: mln ton)
 The alumina industry of characterizes the followings:
 The industry features rather high regional and industrial concentration: The industry features rather high regional and industrial concentration: in
2011, the total capacity of major electrolytic aluminum manufacturers
shared more than 80% of overall capacity nationwide. The production of
alumina in China mainly concentrates in Shandong, Henan, Guangxi,
Shanxi, Guizhou, Chongqing, Inter Mongolia, etc., of which Shandong and
Henan accounted for 33.9% and 25.7% respectively in 2011.  Oversupply will continue in the short term: Oversupply will continue in the short term: the
supply of alumina is still in excess presently, plus the electrolytic
aluminum production reduction caused by power rationing, the demand for
alumina will further decrease. Compared with electrolytic aluminum,
alumina production requires less electricity, so the manufacturers
producing both electrolytic aluminum and alumina prefer to shut down
some electrolytic aluminum production lines but keep the production of
alumina to the greatest extent. In this sense, the sharp fall in output
of alumina is out of the question, and the decrease of supply will be
limited.  The net import presents a downward tendency: The net import presents a downward tendency:
China has been the net importer in the import & export trade of
alumina in recent years, mainly due to the growing demand for alumina
raw materials from electrolytic aluminum capacity expansion at home.
Along with the continuous expansion of alumina capacity in China and
drastic improvement of self-sufficiency in alumina market, the import
demand of alumina has weakened obviously and the alumina import and
export trade deficit in China has taken on a declining trend. In 2011,
the import of alumina in China hit 1.88 million tons, down 56.38% from
the previous year.
第一章 氧化铝简介
1.1 氧化铝的定义及特点
1.2 氧化铝的生产及用途
1.2.1 生产
1.2.2 用途
第二章 全球氧化铝发展现状
2.1 全球铝土矿现状
2.1.1 铝土矿简介
2.1.2 全球铝土矿资源分布
2.1.3 全球铝土矿生产情况
2.1.4 全球铝土矿贸易情况
2.2 全球氧化铝供需现状
2.2.1 生产情况
2.2.2 消费情况
2.3 发展格局
2.3.1 区域格局
2.3.2 企业格局
第三章 中国氧化铝发展环境
3.1 政策环境
3.1.1 准入政策
3.1.2 发展规划
3.1.2 贸易政策
3.2 产业环境
第四章 中国氧化铝供需分析
4.1 供应情况
4.1.1 总体供应情况
4.1.2 地区供应情况
4.1.3 重点企业供应情况
4.2 需求情况
第五章 中国氧化铝进出口分析
5.1 进口
5.1.1 总体进口情况
5.1.2 区域进口情况
5.2 出口
5.2.1 总体出口情况
5.2.2 出口目的地
5.3 贸易平衡分析
第六章 中国氧化铝市场价格
6.1 定价模式
6.2 价格走势
6.2.1 国内价格
6.2.2 中铝价格
第七章 中国氧化铝相关行业分析
7.1 铝土矿
7.1.1 储量及分布
7.1.2 进口情况
7.2 电解铝
7.2.1 供需情况
7.2.2 进出口情况
7.2.3 价格走势
第八章 中国氧化铝重点企业分析
8.1 中国铝业
8.1.1 企业简介
8.1.2 经营情况
8.1.3 重点项目进展
8.1.4 发展战略
8.2 信发集团
8.2.1 企业简介
8.2.2 经营情况
8.2.3 发展动态
8.3 魏桥铝电
8.3.1 企业简介
8.3.2 经营情况
8.3.3 重点工程
8.4 晋北铝业
8.4.1 企业简介
8.4.2 经营情况
8.4.3 发展战略
8.5 开曼铝业
8.5.1 企业简介
8.5.2 经营情况
8.6 南山铝业
8.6.1 企业简介
8.6.2 经营情况
8.6.3 竞争优势
8.7 博赛集团
8.7.1 企业简介
8.7.2 经营情况
8.7.3 最新动态
8.8 中达铝业
8.8.1 企业简介
8.8.2 经营情况
8.9 云铝股份
8.9.1 企业简介
8.9.2 经营情况
8.9.3 发展战略
8.10 其他企业
8.10.1 东方希望(三门峡)铝业有限公司
8.10.2 广西华银铝业有限公司
8.10.3 龙口东海氧化铝有限公司
8.10.4 洛阳香江万基铝业有限公司
8.10.5 三门峡义翔铝业有限公司
1. Overview of Alumina
1.1 Definition & Features
1.2 Production & Application
1.2.1 Production
1.2.2 Application
2. Alumina Development Worldwide
2.1 Status Quo of Bauxite
2.1.1 Profile
2.1.2 Distribution
2.1.3 Production
2.1.4 Trade
2.2 Supply & Demand of Alumina
2.2.1 Production
2.2.2 Consumption
2.3 Development Pattern
2.3.1 Regional Pattern
2.3.2 Enterprise Pattern
3. Development Environment of Alumina in China
3.1 Policy Environment
3.1.1 Entry Policy
3.1.2 Development Plan
3.1.3 Trade Policy
3.2 Industry Environment
4. Supply & Demand of Alumina in China
4.1 Supply
4.1.1 Overall Supply
4.1.2 Regional Supply
4.1.3 Supply of Key Enterprises
4.2 Demand
5. Import & Export of Alumina in China
5.1 Import
5.1.1 Overall Import
5.1.2 Regional Import
5.2 Export
5.2.1 Overall Export
5.2.2 Export Destinations
5.3 Trade Balance
6. Market Price of Alumina in China
6.1 Pricing Model
6.2 Price Trend
6.2.1 Domestic Price
6.2.2 CHINALCO Price
7. Alumina-related Industries in China
7.1 Bauxite
7.1.1 Reserves & Distribution
7.1.2 Import
7.2 Electrolytic Aluminum
7.2.1 Supply & Demand
7.2.2 Import & Export
7.2.3 Price Trend
8. Key Alumina Manufacturers in China
8.1 CHINALCO
8.1.1 Profile
8.1.2 Operation
8.1.3 Progress of Key Projects
8.1.4 Development Strategy
8.2 Xinfa Group
8.2.1 Profile
8.2.2 Operation
8.2.3 Dynamics
8.3 Shandong Weiqiao Aluminium & Electricity
8.3.1 Profile
8.3.2 Operation
8.3.3 Key Projects
8.4 Shanxi Luneng Jinbei Aluminum
8.4.1 Profile
8.4.2 Operation
8.4.3 Development Strategy
8.5 Kaiman Aluminum Co., Ltd
8.5.1 Profile
8.5.2 Operation
8.6 Shandong Nanshan Aluminum Co., Ltd
8.6.1 Profile
8.6.2 Operation
8.6.3 Competitive Edge
8.7 Bosai Minerals Group Co., Ltd
8.7.1 Profile
8.7.2 Operation
8.7.3 Dynamics
8.8 Shanxi ZhongDa Corporation
8.8.1 Profile
8.8.2 Operation
8.9 Yunnan Aluminium Co. Ltd.
8.9.1 Profile
8.9.2 Operation
8.9.3 Development Strategy
8.10 Other Enterprises
8.10.1 East Hope (Sanmenxia)
8.10.2 Guangxi Huayin Aluminium
8.10.3 Nanshan-Donghai Alumina
8.10.4 Luoyang HeungKong Wanji Aluminium
8.10.5 Sanmenxia Yixiang Aluminium
图:碱法生产氧化铝的过程
图:2006-2011年全球氧化铝产量
图:2006-2011年全球冶金级氧化铝产量
图:2006-2010年全球冶金级氧化铝表观消费量
图:2010年全球氧化铝产量区域分布
图:2010年全球氧化铝消费量区域分布
图:2010年全球主要氧化铝企业产量占比
图:2006-2011年中国铝冶炼行业主营业务收入及利润总额
图:2006-2011年中国电解铝和氧化铝产量
表:2010-2011年中国氧化铝进口量
图:2006-2011年中国氧化铝建成产能
图:2006-2011年中国氧化铝产量
表:2010-2011年中国氧化铝产能地区分布
表:2010年中国氧化铝重点企业及产能
图:2006-2011年中国氧化铝表观消费量
图:2006-2011年中国不同等级氧化铝需求量
图:2005-2011年中国氧化铝进口量和进口均价
图:2011年1-11月中国氧化铝进口量(分来源国)构成
图:2005-2011年中国氧化铝出口量和出口均价)
图:2011年1-11月中国氧化铝出口量(分目的地)构成
图:2005-2011年中国氧化铝贸易逆差
图:2004-2011年中国氧化铝现货价格
图:2008-2011年中铝氧化铝现货价格
图:2002-2010年中国铝土矿基础储量
图:2010年中国铝土矿基础储量前10个省市
图:2006-2011年中国铝土矿进口量
图:2006-2011年中国铝土矿进口量(分来源国)构成
表:2010年10月中国铝土矿进口前7家企业
图:2005-2011年中国铝土矿平均进口价格
图:2005-2011年中国电解铝产能及开工率
图:2005-2011年中国电解铝产量及表观消费量
表:2010-2012年中国电解铝落后产能淘汰计划
图:2005-2011年中国电解铝净进口量
图:2009-2011年上海期货交易所(SHFE)铝价走势
图:2007-2011年中国铝业主营业务收入和净利润
表:2007-2011年中国铝业(分产品)产量及产能
图:2005-2011年中国铝业氧化铝市场份额
表:信发集团子公司及主营业务
图:南山铝业产业链
图:2007-2011年南山铝业主营业收入和净利润
表:2009-2010年南山铝业(分产品)销售收入和营业利润率
图:2000-2011年博赛集团销售收入
图:中达铝业销售分布图
表:2010年云铝股份产能
图:2007-2011年云铝股份营业收入和净利润
图:2007-2011年云铝股份主营业务毛利率
Production of Alumina by Alkaline Process
Output of Alumina Worldwide, 2006-2011
Output of Metallurgical Alumina Worldwide, 2006-2011
Apparent Consumption of Metallurgical Alumina Worldwide, 2006-2010
Global Alumina Output by Region, 2010
Global Alumina Consumption by Region, 2010
Output Proportion of Global Major Alumina Enterprises, 2010
Operating Revenue and Total Profit of China Aluminum Smelting Industry, 2006-2011
Output of Electrolytic Aluminum and Alumina in China, 2006-2011
Import Volume of Aluminum in China, 2010-2011
Alumina Capacity in China, 2006-2011
Alumina Output in China, 2006-2011
Alumina Capacity by Region in China, 2010-2011
Key Alumina Enterprises and Capacity in China, 2010
Apparent Consumption of Alumina in China, 2006-2011
Demand of Alumina of Varied Grades in China, 2006-2011
Import Volume and Average Import Price of Alumina in China, 2005-2011
Import Volume Composition of Alumina in China (by Country of Origin), Jan-Nov 2011
Export Volume and Average Export Price of Alumina in China, 2005-2011
Export Volume Composition of Alumina in China (by Destination), Jan-Nov 2011
Alumina Trade Deficit in China, 2005-2011
Spot Price of Alumina in China, 2004-2011
Spot Price of Alumina of CHINALCO, 2008-2011
Basic Reserves of Bauxite in China, 2002-2010
Top 10 Provinces and Cities of Bauxite Basic Reserves in China, 2010
Import Volume of Bauxite in China, 2006-2011
Import Volume Composition of Bauxite in China (by Country of Origin), 2006-2011
Top 7 Importers of Bauxite in China, Oct. 2010
Average Import Price of Bauxite in China, 2005-2011
Capacity and Operating Rate of Electrolytic Aluminum in China, 2005-2011
Output and Apparent Consumption of Electrolytic Aluminum in China, 2005-2011
Backward Capacity Elimination Plan of Electrolytic Aluminum in China,2010-2012
Net Import Volume of Electrolytic Aluminum in China, 2005-2011
Aluminum Price Trends of SHFE, 2009-2011
Operating Revenue and Net Income of CHINALCO, 2007-2011
Output and Capacity of CHINALCO (by Product), 2007-2011
Market Share of Alumina of CHINALCO, 2005-2011
Subsidiaries and Primary Business of Xinfa Group
Industry Chain of Shandong Nanshan Aluminum
Operating Revenue and Net Income of Shandong Nanshan Aluminum, 2007-2011
Revenue and Operating Margin of Shandong Nanshan Aluminum (by Product), 2009-2010
Revenue of Bosai Minerals Group, 2000-2011
Sales Distribution Map of Shanxi ZhongDa Corporation
Capacity of Yunnan Aluminium, 2010
Operating Revenue and Net Income of Yunnan Aluminium, 2007-2011
Gross Margin of Yunnan Aluminium, 2007-2011
如果这份报告不能满足您的要求,我们还可以为您定制报告,请 留言说明您的详细需求。
|