|
|
|
报告导航:研究报告—
生命科学—制药医疗
|
|
2011-2012年中国骨科器械行业研究报告 |
 |
字数:2.4万 |
页数:66 |
图表数:92 |
|
中文电子版:6500元 |
中文纸版:3250元 |
中文(电子+纸)版:7000元 |
|
英文电子版:1800美元 |
英文纸版:1900美元 |
英文(电子+纸)版:2100美元 |
|
编号:XJT016
|
发布日期:2012-07 |
附件:下载 |
 |
|
|
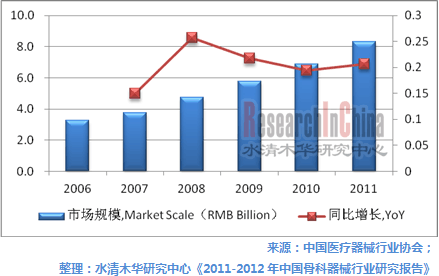
受惠于收入水平的提高、人口老龄化的到来、医疗报销比例的上升等,中国骨科器械行业市场需求得到有效释放。2006-2011年中国骨科器械市场规模年均复合增长率达到20.5%,其中2011年市场规模将达到83.2亿元。创伤产品、脊柱产品和关节产品是中国骨科器械三大细分产品。 图:2006-2011年中国骨科器械行业市场规模及增长率
 目前,中国骨科器械产业集中度较低,本土企业市场份额落后于外资企业,高端市场几乎被国外医疗器械生产商占领。2011年,中国主要骨科器械企业如创生控股、康辉医疗、威高股份市场占有率仅为4.6%、3.9%、2.9%。不过,中国企业正不断加大研发和生产技术的投资力度,并依靠成本和渠道优势逐步抢占市场。而外资企业通过直接投资建厂、合资或收购等方式加快在中国骨科器械市场的本土化进程。 《2011-2012年中国骨科器械行业研究报告》的内容主要包括以下几方面:- 中国骨科器械行业市场规模、进出口情况、利润水平、竞争格局等;
- 中国骨科器械行业监管政策、行业政策、进入壁垒、上下游行业对其影响等。
- 中国骨科器械行业发展现状和预测,包括总体市场以及创伤产品、脊柱产品、人工关节三大细分市;
- 中国13家主要骨科器械企业(包括4家外资企业)的生产经营情况、投资并购、骨科器械业务发展等。
Benefiting from the rise in income level, the advent of the population
aging era, improvement of medical reimbursement ratio, etc., the market
demand of Chinese orthopedic device industry has been effectively
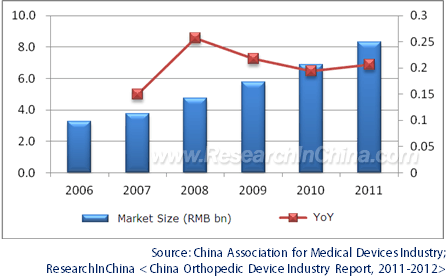
released. In 2006-2011, China’s market size of orthopedic devices grew
at a CAGR of 20.5% to RM8.32 billion. Trauma product, spine product and
joint product are three product segments among Chinese orthopedic
devices Market Size and Growth Rate of China Orthopedic Devices Industry, 2006-2011  At
present, the orthopedic device industry features a low degree of
concentration in China, with market share of local enterprises lagged
behind that of foreign peers, and the high-end market is almost occupied
by foreign manufacturers of medical devices. In 2011, China’s leading
orthopedic devices companies like Trauson Holdings Company Limited,
China Kanghui Holdings, Weigao Group respectively held a market share of
merely 4.6%, 3.9% and 2.9%. Nevertheless, Chinese companies are
constantly increasing investment in R&D and production technology,
as well as relying on cost and channel advantages to seize the market;
while foreign counterparts are accelerating the localization process
there via direct investment in factories, joint ventures, acquisitions
and other ways. China Orthopedic Device Industry Report, 2011-2012 mainly covers the followings:  Market size, import & export, profit level, competitive landscape, etc.; Market size, import & export, profit level, competitive landscape, etc.;
 Regulation policies, industry policies, entry barriers, influence from upstream and downstream sectors, etc.; Regulation policies, industry policies, entry barriers, influence from upstream and downstream sectors, etc.;
 Development
situation and forecast, including the overall market as well as three
main segments, i.e., trauma product, spine product and joint prosthesis; Development
situation and forecast, including the overall market as well as three
main segments, i.e., trauma product, spine product and joint prosthesis;
 Production
& operation, investment, mergers & acquisitions, orthopedic
device business development, etc. of 13 major orthopedic device
companies (involving four foreign ones) in China. Production
& operation, investment, mergers & acquisitions, orthopedic
device business development, etc. of 13 major orthopedic device
companies (involving four foreign ones) in China.
第一章 骨科器械行业概述
1.1 定义
1.2 分类
1.3 产业链
第二章 中国骨科器械行业现状
2.1 总体概况
2.2 市场结构
2.3 进出口分析
2.3.1 进口情况
2.3.2 出口情况
2.4 竞争格局
2.5 利润水平
2.6 进入壁垒
2.6.1 技术工艺壁垒
2.6.2 市场准入壁垒
2.6.3 销售渠道壁垒
2.6.4 人才壁垒
2.7 销售模式
第三章 中国骨科器械行业发展环境
3.1 政策环境
3.1.1 监管政策
3.1.2 行业政策
3.2 上下游行业
3.2.1 上游行业
3.2.2 下游行业
第四章 中国骨科器械行业预测分析
4.1 总体预测
4.2 创伤产品
4.3 脊柱产品
4.4 人工关节
第五章 中国骨科器械行业主要企业
5.1 强生(Johnson & Johnson)
5.1.1 企业简介
5.1.2 经营情况
5.1.3 在华运营
5.2 DePuy Synthes
5.2.1 企业简介
5.2.2 经营情况
5.3 美敦力
5.3.1 企业简介
5.3.2 经营情况
5.3.3 在华运营
5.4 史赛克 Stryker
5.4.1 企业简介
5.4.2 经营情况
5.5创生控股
5.5.1 企业简介
5.5.2 经营情况
5.5.3 营收构成分析
5.5.4 毛利率分析
5.5.5 研发和投资分析
5.5.6 预测与展望
5.6 康辉医疗
5.6.1 企业简介
5.6.2 经营情况
5.6.3 营收构成分析
5.6.4 毛利率分析
5.6.5 研发和投资分析
5.6.6 预测与展望
5.7 威高股份
5.7.1 企业简介
5.7.2 经营情况
5.7.3 营收构成分析
5.7.4 预测与展望
5.8 爱康宜诚
5.8.1 企业简介
5.8.2 经营情况
5.8.3 营收构成分析
5.8.4 毛利率分析
5.8.5 研发和投资分析
5.8.6 客户和供应商分析
5.9 欣荣博尔特(Xinrong Best)
5.9.1 企业简介
5.9.2 经营情况
5.10 天津威曼(Walkman).
5.10.1 企业简介
5.10.2 经营情况
5.11 蒙太因(Montagne)
5.11.1 企业简介
5.11.2 经营情况
5.12 力达康(LDK)
5.12.1 企业简介
5.12.2 经营情况
5.13 人立骨科(Renli Orthopedic)
5.13.1 企业简介
5.13.2 经营情况
1. Overview of Orthopedic Device
1.1 Definition
1.2 Classification
1.3 Industry Chain
2. Status Quo of China Orthopedic Device Industry
2.1 General Situation
2.2 Market Structure
2.3 Import and Export
2.3.1 Import
2.3.2 Export
2.4 Competitive Landscape
2.5 Profit
2.6 Entry Barriers
2.6.1 Technical Process
2.6.2 Market Access
2.6.3 Marketing Channel
2.6.4 Talents
2.7 Sales Model
3. Development Environment of China Orthopedic Device Industry
3.1 Policy Environment
3.1.1 Regulatory Policies
3.1.2 Industry Policies
3.2 Upstream and Downstream Sectors
3.2.1 Upstream
3.2.2 Downstream
4. Predictive Parsing of China Orthopedic Device Industry
4.1 Overall Forecast
4.2 Trauma Product
4.3 Spine Product
4.4 Joint Prosthesis
5. Key Enterprises
5.1 Johnson & Johnson
5.1.1 Profile
5.1.2 Operation
5.1.3 Operation in China
5.2 DePuy Synthes
5.2.1 Profile
5.2.2 Operation
5.3 Medtronic
5.3.1 Profile
5.3.2 Operation
5.3.3 Operation in China
5.4 Stryker
5.4.1 Profile
5.4.2 Operation
5.5 Trauson Holdings
5.5.1 Profile
5.5.2 Operation
5.5.3 Revenue Structure
5.5.4 Gross Margin
5.5.5 R&D and Investment
5.5.6 Forecast and Outlook
5.6 KangHui Medical
5.6.1 Profile
5.6.2 Operation
5.6.3 Revenue Structure
5.6.4 Gross Margin
5.6.5 R&D and Investment
5.6.6 Forecast and Outlook
5.7 Weigao
5.7.1 Profile
5.7.2 Operation
5.7.3 Revenue Structure
5.7.4 Forecast and Outlook
5.8 AKEC
5.8.1 Profile
5.8.2 Operation
5.8.3 Revenue Structure
5.8.4 Gross Margin
5.8.5 R&D and Investment
5.8.6 Clients and Suppliers
5.9 Xinrong Best
5.9.1 Profile
5.9.2 Operation
5.10 Walkman
5.10.1 Profile
5.10.2 Operation
5.11 Montagne
5.11.1 Profile
5.11.2 Operation
5.12 LDK
5.12.1 Profile
5.12.2 Operation
5.13 Renli Orthopedic
5.13.1 Profile
5.13.2 Operation
表:骨科器械行业类别
图:骨科器械行业产业链
图:2006-2011年中国医疗器械行业营业收入及增长率
图:2006-2011年中国骨科器械行业市场规模及增长率
图:2007-2011年中国骨科器械市场规模(分产品)
图:2009-2011年中国骨科器械进口量、进口额
图:2009-2011年中国骨科器械进口平均价格
表:2011年中国骨科器械进口额前10国家(或地区)
图:2009-2011年中国骨科器械出口量、出口额
图:2009-2011年中国骨科器械出口平均价格
表:2011年中国骨科器械出口额前10国家(或地区)
图:2009-2011年中国骨科器械进口规模占市场规模比重
图:2011年中国主要企业骨科器械业务营业收入及市场占有率
表:中国主要骨科器械企业产品及研发情况
表:2008-2011年中国主要骨科器械生产商毛利率
图:骨科器械产品批文申请流程
图:中国骨科器械销售流程
表:2007-2011年中国骨科器械行业政策及主要内容
图:2000-2010年中国医疗卫生总费用及占GDP比重
图:1982-2010年中国65岁人口数及占总人口比例
图:2001-2011年中国城镇居民人均可支配收入和农村居民家庭人均纯收入
表:中国医保覆盖人群及支出水平
表:2011年中国部分省市骨科植入器械医保覆盖额度
图:2008-2013年中国骨科器械行业市场规模
图:2007-2011年中国汽车保有量
图:2011-2013年中国骨科器械行业市场规模(分产品)
图:2007-2013年中国创伤产品市场规模
图:2008-2011年创生控股、康辉医疗创伤产品市场占有率
图:2007-2013年中国脊柱产品市场规模
图:2008-2011年创生控股、康辉医疗脊柱产品市场占有率
图:2007-2013年中国人工关节产品市场规模
图:2009-2011年中国人工关节产品进口额及占市场规模比重
图:2008-2011年强生公司营业收入及净利润
图:2011年强生公司营业收入构成(分产品)
表:强生公司在华企业及主要产品
图:2008-2009年强生苏州营业收入及利润总额
图:2008-2009年强生苏州毛利率
图:2008-2009年强生苏州资产总额及负债总额
图:2008-2011年Synthes营业收入及净利润
图:2011年Synthes营业收入构成(分地区)
图:2008-2011财年美敦力营业收入及净利润
图:2008-2011财年美敦力脊椎产品营业收入及占比
图:2008-2011年史赛克营业收入及净利润
图:2009-2011年史赛克营业收入构成(分产品)
表:2008-2011年创生控股主要产品产量
表:2008-2011年创生控股主要产品产能利用率
图:2008-2011年创生控股营业收入和净利润
图:2008-2011年创生控股营业收入构成(分产品)
图:2008-2011年创生控股营业收入构成(分地区)
图:2009-2011年创生控股代理商及授权医院数量
表:2008-2011年创生中国、常州奥斯迈营业收入结构(分地区)
图:2008-2011年创生控股毛利率
图:2008-2011年创生控股研发支出及占营业收入比例
表:2011-2013年创生控股营业收入和净利润
图:2008-2011年康辉医疗营业收入和净利润
图:2008-2011年康辉医疗营业收入构成(分产品)
图:2008-2011年康辉医疗营业收入构成(分地区)
图:2008-2011年康辉医疗毛利率
图:2008-2011年康辉医疗研发支出及占营业收入比例
表:2011-2013年康辉医疗营业收入和净利润
表:威高股份产品种类及主要产品
图:2008-2011年威高骨科营业收入及净利润
图:2008-2011年威高骨科骨科制品产量
图:2008-2011年威高骨科骨科制品营业收入及占营业收入比重
表:2008-2011年威高骨科营业收入结构(分地区)
表:2011-2013年威高股份营业收入和净利润
表:2009-2011年爱康宜诚产能、产量及产能利用率
表:2009-2011年爱康宜诚疫苗产量、销量及产销率
图:2009-2011年爱康宜诚营业收入和净利润
图:2008-2011年爱康宜诚营业收入构成(分产品)
图:2008-2011年爱康宜诚营业收入构成(分地区)
表:2009-2011年爱康宜诚毛利率(分产品)
表:2009-2011年爱康宜诚主要产品毛利率
图:2009-2011年爱康宜诚研发支出及占营业收入比例
表:2012年爱康宜诚拟在建项目及投资额
表:2009-2011年爱康宜诚前五名客户名单、贡献收入及占比
表:2009-2012年爱康宜诚前五名供应商名单、采购金额及占比
图:2007-2009年欣荣博尔特营业收入及利润总额
图:2007-2009年欣荣博尔特毛利率
图:2007-2009年欣荣博尔特资产总额及负债总额
图:2007-2009年威曼营业收入及利润总额
图:2007-2009年威曼毛利率
图:2007-2009年威曼资产总额及负债总额
图:2007-2009年蒙太因营业收入及利润总额
图:2007-2009年蒙太因毛利率
图:2007-2009年蒙太因资产总额及负债总额
图:2007-2009年力达康营业收入及利润总额
图:2007-2009年力达康毛利率
图:2007-2009年力达康资产总额及负债总额
图:2007-2009年人立骨科营业收入及利润总额
图:2007-2009年人立骨科毛利率
图:2007-2009年人立骨科资产总额及负债总额
Classification of Orthopedic Device Industry
Orthopedic Device Industry Chain
Revenue and Growth Rate of China Medical Device Industry, 2006-2011
Market Size and Growth Rate of China Orthopedic Device Industry, 2006-2011
China Orthopedic Device Market Size (by Product), 2007-2011
Import Volume and Value of Orthopedic Devices in China, 2009-2011
Average Import Price of China’s Orthopedic Devices, 2009-2011
Top 10 Countries (or Regions) by Import Value of China’s Orthopedic Devices, 2011
Export Volume and Value of China’s Orthopedic Devices, 2009-2011
Average Export Price of China’s Orthopedic Devices, 2009-2011
Top 10 Countries (or Regions) by Export Value of China’s Orthopedic Devices, 2011
Proportion of China’s Import of Orthopedic Devices in Market Scale, 2009-2011
Revenue and Market Share of Orthopedic Devices Business of Major Companies in China, 2011
Products and R&D of Major Orthopedic Device Companies in China
Gross Margin of Major Orthopedic Device Manufacturers in China, 2008-2011
Application Approval Process of Orthopedic Devices
Sales Process of Orthopedic Devices in China
Policies and Main Content of China Orthopedic Device Industry, 2007-2011
Total Health Care Costs and % of GDP in China, 2000-2010
Population Aged 65 and % of Total Population in China, 1982-2010
Per Capita Disposable Income of Urban Residents and Per Capita Net Income of Rural Households in China, 2001-2011
Medical Insurance Coverage of the Crowd and the Level of Expenditure in China
Orthopedic Implants Health Insurance Coverage Amount of Some Provinces and Cities in China, 2011
Market Size of China Orthopedic Device Industry, 2008-2013E
Car Ownership in China, 2007-2011
Market Size of China Orthopedic Device Industry (by Product), 2011-2013E
Market Size of Trauma Products in China, 2007-2013E
Market Share of Trauma Products of Trauson Holdings and KangHui Medical, 2008-2011
Market Size of Spine Products in China, 2007-2013E
Market Share of Spine Products of Trauson Holdings and KangHui Medical, 2008-2011
Market Size of Joint Products in China, 2007-2013E
Import Value and Proportion of Joint Products in China, 2009-2011
Revenue and Net Income of Johnson & Johnson, 2008-2011
Revenue Structure of Johnson & Johnson (by Product), 2011
Companies in China and Major Products of Johnson & Johnson
Revenue and Total Profit of Johnson & Johnson Medical (Suzhou) Ltd., 2008-2009
Gross Margin of Johnson & Johnson Medical (Suzhou) Ltd., 2008-2009
Total Assets and Total Liabilities of Johnson & Johnson Medical (Suzhou) Ltd., 2008-2009
Revenue and Net Income of Synthes, 2008-2011
Revenue Structure of Synthes (by Region), 2011
Revenue and Net Income of Medtronic, FY2008-FY2011
Revenue and Proportion of Spine Products of Medtronic, FY2008-FY2011
Revenue and Net Income of Stryker, 2008-2011
Revenue Structure of Stryker (by Product), 2009-2011
Output of Main Products of Trauson Holdings, 2008-2011
Capacity Utilization of Main Products of Trauson Holdings, 2008-2011
Revenue and Net Income of Trauson Holdings, 2008-2011
Revenue Structure of Trauson Holdings (by Product), 2008-2011
Revenue Structure of Trauson Holdings (by Region), 2008-2011
Agents and Authorized Hospitals of Trauson Holdings, 2009-2011
Revenue Structure of Trauson China and Changzhou Orthmed (by Region), 2008-2011
Gross Margin of Trauson Holdings, 2008-2011
R&D Costs and % of Total Revenue of Trauson Holdings, 2008-2011
Revenue and Net Income of Trauson Holdings, 2011-2013E
Revenue and Net Income of KangHui Medical, 2008-2011
Revenue Structure of KangHui Medical (by Product), 2008-2011
Revenue Structure of KangHui Medical (by Region), 2008-2011
Gross Margin of KangHui Medical, 2008-2011
R&D Costs and % of Total Revenue of KangHui Medical, 2008-2011
Revenue and Net Income of KangHui Medical, 2011-2013E
Product Types and Main Products of Weigao
Revenue and Net Income of Weigao, 2008-2011
Output of Orthopedic Products of Weigao, 2008-2011
Revenue and % of Orthopedic Products of Weigao, 2008-2011
Revenue Structure of Weigao (by Region), 2008-2011
Revenue and Net Income of Weigao, 2011-2013E
Capacity, Output and Capacity Utilization of AKEC, 2009-2011
Vaccine Output, Sales Volume and Sales-Output Ratio of AKEC, 2009-2011
Revenue and Net Income of AKEC, 2009-2011
Revenue Structure of AKEC (by Product), 2008-2011
Revenue Structure of AKEC (by Region), 2008-2011
Gross Margin of AKEC (by Product), 2009-2011
Gross Margin of Main Products of AKEC, 2009-2011
R&D Costs and % of Total Revenue of AKEC, 2009-2011
Projects Planned and under Construction and Investment Amount of AKEC, 2012
Name list and Revenue Contribution a of AKEC’s Top 5 Clients, 2009-2011
Name list and Procurement of AKEC’s Top 5 Suppliers, 2009-2012
Revenue and Total Profit of Xinrong Best, 2007-2009
Gross Margin of Xinrong Best, 2007-2009
Total Assets and Total Liabilities of Xinrong Best, 2007-2009
Revenue and Total Profit of Walkman, 2007-2009
Gross Margin of Walkman, 2007-2009
Total Assets and Total Liabilities of Walkman, 2007-2009
Revenue and Total Profit of Montagne, 2007-2009
Gross Margin of Montagne, 2007-2009
Total Assets and Total Liabilities of Montagne, 2007-2009
Revenue and Total Profit of LDK, 2007-2009
Gross Margin of LDK, 2007-2009
Total Assets and Total Liabilities of LDK, 2007-2009
Revenue and Total Profit of Renli Orthopedic, 2007-2009
Gross Margin of Renli Orthopedic, 2007-2009
Total Assets and Total Liabilities of Renli Orthopedic, 2007-2009
如果这份报告不能满足您的要求,我们还可以为您定制报告,请 留言说明您的详细需求。
|