|
|
|
报告导航:研究报告—
制造业—轻工
|
|
2012年全球及中国玩具行业研究报告 |
 |
字数:3.5万 |
页数:125 |
图表数:131 |
|
中文电子版:7500元 |
中文纸版:3750元 |
中文(电子+纸)版:8000元 |
|
英文电子版:2200美元 |
英文纸版:2300美元 |
英文(电子+纸)版:2500美元 |
|
编号:LMX026
|
发布日期:2013-01 |
附件:下载 |
 |
|
|
近年来,受经济危机和玩具市场结构调整的影响,欧美等传统市场的玩具销售额及其占全球玩具销售额的比例趋于稳定甚至下降。新兴市场如东盟、中东、南美、东欧等需求强劲,逐步成为中国玩具出口的重要地区。全球玩具销售额从2007年的781亿美元增长到2011年的833亿美元,年均复合增长率1.62%。
从全球各大玩具厂商的发展情况来看,全球主要玩具公司美泰和孩之宝等都已经进入相对成熟的阶段。而中国本土玩具企业目前正处于成长期,未来发展潜力较大。
表:中国主要玩具厂商对比
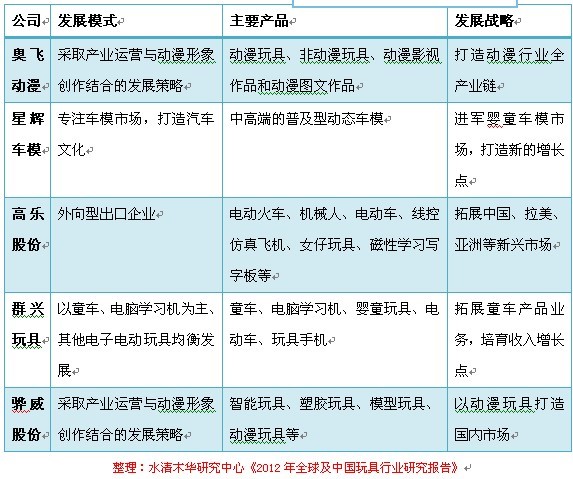
尽管中国玩具企业前景看好,但是在研发和营销实力方面,以及和文化资源的整合方面都有待加强。
《2012年全球及中国玩具行业研究报告》的内容主要包括以下几个方面:
全球玩具市场发展状况、主要国家以及未来发展趋势;
中国玩具行业发展现状、行业运营指标、竞争格局、出口市场及行业发展中存在的问题及建议;
玩具关联产业分析,包括塑料行业、动漫行业及游戏行业;
玩具子行业分析,包括毛绒玩具、木制玩具、塑胶玩具、电子玩具、益智玩具及成人玩具;
全球5家玩具厂商及中国8家玩具厂商的经营状况、营收构成、发展战略等。
In recent years, impacted by the economic crisis and the structural adjustment of the toy market, the traditional markets such as Europe and the United States have witnessed falling sales revenue, and their proportion in the global toy sales has stabilized or even declined. Emerging markets, including ASEAN, the Middle East, Latin America and Eastern Europe, have strong demand, and they have gradually become the important destinations for China to export toys. The global toy sales grew to USD83.3 billion in 2011 from USD78.1 billion in 2007, with a CAGR of 1.62%.
The world's leading toy companies Mattel and Hasbro have already entered a relatively mature stage, while Chinese toy companies are embracing its growth period, with huge potentials.
Contrast between Major Chinese Toy Manufacturers
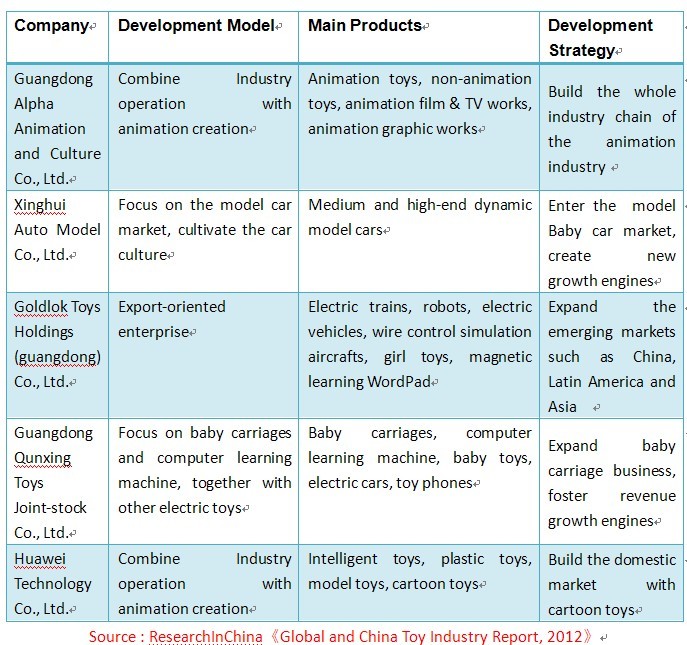
Even with a bright prospect, Chinese toy companies should strengthen their R & D, marketing, and integration of cultural resources.
The report resolves around the followings.
Development of the global toy market, major countries and the future trends;
Status quo, operating indicators, competition pattern and export market of China toy industry, as well as the existing problems in the industry and suggestions;
Toy-related industries, including plastics industry, animation industry and gaming industry;
Toy sub-industries, including plush toys, wooden toys, plastic toys, electronic toys, educational toys and adult toys;
Operation, revenue structure and development strategy of five global toy producers and eight Chinese toy makers.
前言
第一章 玩具行业概述
1.1玩具的定义和分类
1.2玩具行业发展历程
第二章 全球玩具行业分析
2.1全球玩具市场发展概况
2.2主要国家分析
2.2.1美国玩具市场
2.2.2日本玩具市场
2.2.3 法国玩具市场
2.3 未来发展趋势
2.3.1 欧美玩具市场增速将逐渐放缓
2.3.2 新兴国家玩具市场方兴未艾
第三章 中国玩具行业发展概况
3.1发展现状
3.1.1 中国玩具行业发展状况
3.1.2 行业主要运营指标
3.1.3 玩具行业相关标准和认证
3.2 竞争格局分析
3.3 出口分析
3.3.1中国玩具出口情况分析
3.3.3中国玩具行业出口的困境
3.4 存在的问题及建议
3.4.1 存在的问题
3.4.2 发展建议
第四章 玩具行业关联产业分析
4.1塑料行业
4.2动漫行业
4.2.1 产业介绍
4.2.2 政策扶持
4.2.3 市场规模
4.2.4 动画片
4.2.5动漫电影
4.2.6 发展趋势
4.3游戏行业
第五章 玩具子产业分析
5.1 毛绒玩具
5.1.1 行业现状
5.1.2 发展困境
5.2 木制玩具
5.2.1 行业现状
5.2.2 相关的认证及政策分析
5.2.3 内销市场前景广阔
5.2.4 发展趋势
5.3 塑胶玩具
5.3.1行业现状
5.3.2市场规模
5.3.3发展困境
5.4 电子玩具
5.4.1 行业现状
5.4.2 供需分析
5.4.3 中国电玩业受相关认证指令影响
5.5 益智玩具
5.5.1行业现状
5.5.2 出口分析
5.5.3 行业标准
5.5.4 市场潜在需求分析
5.6 成人玩具
第六章 国内主力玩具厂商分析
6.1奥飞动漫
6.1.1 公司简介
6.1.2 发展历程
6.1.3 经营状况
6.1.4 营业构成
6.1.5 玩具业务
6.1.6 牵手孩子宝
6.1.7 发展大动漫全业务
6.2星辉车模
6.2.1 公司简介
6.2.2 品牌授权
6.2.3 发展历程
6.2.4 经营状况
6.2.5 营收构成
6.2.6 毛利率
6.2.7 研发投入
6.2.8 销售模式
6.2.9 延伸上下游产业链
6.3高乐股份
6.3.1 公司简介
6.3.2 经营状况
6.3.3 营收构成
6.3.4 毛利率
6.3.5 销售模式
6.3.6 研发投入
6.3.7 电子电动玩具生产建设项目
6.4 群兴玩具
6.4.1 公司简介
6.4.2 主要产品
6.4.3 经营状况
6.4.4 营收构成
6.4.5 毛利率
6.4.6 电子电动塑料玩具生产基地
6.4.7 研发投入
6.4.8 销售模式
6.5 骅威股份
6.5.1 公司介绍
6.5.2 主要产品
6.5.3 经营状况
6.5.4 营收构成
6.5.5 毛利率
6.5.6 研发投入
6.5.7 “动漫+玩具”商业模式
6.5.8 主要客户
6.5.9 主要项目
6.6好孩子国际
6.6.1 公司介绍
6.6.2 经营状况
6.7香港隆成集团
6.7.1公司介绍
6.7.2经营状况
6.8英德玩具
6.8.1公司介绍
6.8.2经营状况
第七章 国外主要玩具厂商分析
7.1美国美泰
7.1.1公司介绍
7.1.2经营状况
7.1.3 新玩具发布
7.2美国孩之宝
7.2.1公司介绍
7.2.2经营状况
7.2.3 变形金刚业务
7.2.4 发展战略
7.3日本Takara Tomy
7.3.1公司介绍
7.3.2经营状况
7.3.3 在华发展
7.4丹麦乐高
7.4.1公司介绍
7.4.2经营状况
7.4.3 在华发展
7.5日本万代
7.5.1公司介绍
7.5.2 玩具产品
7.5.3 经营状况
7.5.4 营业指标预测
7.5.5 发展战略
Preface
1 Overview of Toy Industry
1.1 Definition and Category
1.2 Development Course
2 Global Toy Industry
2.1 Overview
2.2 Major Countries
2.2.1 USA
2.2.2 Japan
2.2.3 France
2.3 Development Trend
2.3.1 The Growth Rate of European and American Toy Markets Will Slow Down
2.3.2 The Toy Market in Emerging Countries Will Be Booming
3 China Toy Industry
3.1 Status Quo
3.1.1 Development
3.1.2 Major Operating Indicators
3.1.3 Related Standards and Certification
3.2 Competition Pattern
3.3 Export
3.3.1 Analysis
3.3.3 Predicament
3.4 Existing Problems and Suggestions
3.4.1 Existing Problems
3.4.2 Suggestions
4 Related Industries
4.1 Plastic Industry
4.2 Cartoon & Animation Industry
4.2.1 Introduction
4.2.2 Policy
4.2.3 Market Size
4.2.4 Cartoon
4.2.5 Animation Movie
4.2.6 Development Trend
4.3 Game Industry
5 Sub-industries
5.1 Plush Toy
5.1.1 Status Quo
5.1.2 Development Predicament
5.2 Wooden Toy
5.2.1 Status Quo
5.2.2 Related Certification and Policies
5.2.3 Broad Prospect for Domestic Market
5.2.4 Development Trend
5.3 Plastic Toy
5.3.1 Status Quo
5.3.2 Market Scale
5.3.3 Development Predicament
5.4 Electronic Toy
5.4.1 Status Quo
5.4.2 Supply and Demand
5.4.3 Influence of Related Directives on China Electronic Toy Industry
5.5 Intellectual Toy
5.5.1 Status Quo
5.5.2 Export
5.5.3 Industry Standards
5.5.4 Potential Market Demand
5.6 Adult Toy
6 Key Toy Enterprises in China
6.1 Guangdong Alpha Animation and Culture Co., Ltd.
6.1.1 Profile
6.1.2 Development Course
6.1.3 Operation
6.1.4 Revenue Structure
6.1.5 Toy Business
6.1.6 Cooperation with Hasbro
6.1.7 Comprehensive Development
6.2 Xinghui Auto Model Co., Ltd.
6.2.1 Profile
6.2.2 Brand Licensing
6.2.3 Development Course
6.2.4 Operation
6.2.5 Revenue Structure
6.2.6 Gross Margin
6.2.7 R&D Investment
6.2.8 Sales Model
6.2.9 Extension of Upstream and Downstream Industry Chains
6.3 Goldlok Toys Holdings (guangdong) Co., Ltd.
6.3.1 Profile
6.3.2 Operation
6.3.3 Revenue Structure
6.3.4 Gross Margin
6.3.5 Sales Model
6.3.6 R&D Investment
6.3.7 Electronic Toy Projects
6.4 Guangdong Qunxing Toys Joint-stock Co., ltd.
6.4.1 Profile
6.4.2 Main Products
6.4.3 Operation
6.4.4 Revenue Structure
6.4.5 Gross Margin
6.4.6 Electronic and Plastic Toy Production Bases
6.4.7 R&D Investment
6.4.8 Sales Model
6.5 Huawei Technology Co., ltd.
6.5.1 Profile
6.5.2 Main Products
6.5.3 Operation
6.5.4 Revenue Structure
6.5.5 Gross Margin
6.5.6 R&D Investment
6.5.7 "Animation + Toy" Business Model
6.5.8 Major Clients
6.5.9 Major Projects
6.6 Goodbaby International Holdings Limited
6.6.1 Profile
6.6.2 Operation
6.7 Lerado Group
6.7.1 Profile
6.7.2 Operation
6.8 Intex Toys
6.8.1 Profile
6.8.2 Operation
7 Key Toy Enterprises in Foreign Countries
7.1 Mattel
7.1.1 Profile
7.1.2 Operation
7.1.3 Launch of New Toys
7.2 Hasbro
7.2.1 Profile
7.2.2 Operation
7.2.3 Transformers Business
7.2.4 Strategy
7.3 Takara TOMY
7.3.1 Profile
7.3.2 Operation
7.3.3 Development in China
7.4 LEGO
7.4.1 Profile
7.4.2 Operation
7.4.3 Development in China
7.5 BANDAI NAMCO
7.5.1 Profile
7.5.2 Toy Products
7.5.3 Operation
7.5.4 Forecast for Operating Indicators
7.5.5 Strategy
图:2007-2012年全球玩具销售额
图:2010年全球玩具销售额(分地区)构成
图:2011年全球主要国家玩具行业销售额及增长
图:全球主要国家销售额排名第一的玩具
图:2003-2011年美国玩具市场销售额及同比增长
图:2003-2011年美国玩具市场销售额(分玩具类型)
图:2007-2011年日本玩具市场销售
表:2010-2011年日本玩具市场主要产品销售额
图:2005-2010年法国玩具市场销售额
图:2009年法国玩具销售渠道构成
图:2010年全球主要国家儿童人均玩具消费支出
图:1999-2011年中国人均GDP及增长
图:中国人均消费支出水平和儿童玩具零售额
图:1999-2012年中国玩具制造业企业单位数
图:2000-2012年中国玩具制造业主营业务收入及同比增长
图:2000-2012年中国玩具制造业利润总额及同比增长
表:2008-2012年中国玩具制造业工业销售产值及出口交货值
表:玩具行业相关标准认证
表:2012年中国十大玩具品牌排行榜
表:国外主要玩具厂商对比
表:中国主要玩具厂商对比
表:中国主要玩具上市公司上市后主营业务收入、净利润复合增长率
图:2000-2012年中国玩具出口额及同比增长
图:2012年1-11月中国玩具出口额及环比增长
图:玩具产业价值的“微笑曲线”
图:欧盟玩具贸易壁垒
图:2008年欧洲主要国家玩具销售渠道构成
图:2010年中国玩具销售渠道构成
表:2006-2011年美泰、孩子宝、万代研发费投入占主营业务收入比例
图:《芭比时尚》杂志
图:2011年全球主要玩具生产企业广告费用占主营业务收入比例
图:2000-2012年中国塑料制品产量
图:2000-2011年中国塑料制品业工业总产值
图:动漫产业关联效应
表:发达国家动漫产业扶持政策及效果
表:中国动漫产业的扶持政策
图:2007-2012E中国动漫产业市场规模
图:2000-2011年中国国产动画片产量及增长
图:2007-2012年中国国产动画片市场规模及增长
图:2007-2012年中国动漫电影市场规模及增长
图:2007-2011年中国动漫电影占票房比重
图:2008-2011年中国国内票房前五的动漫电影
图:中国动漫全产业链
图:2004-2012年中国游戏市场实际销售收入
图:2006-2016年中国PC网络游戏市场实际销售收入及增长
图:2011-2012年中国网络游戏用户数及网民使用率
图:2004-2011年中国毛绒玩具出口额及同比增长
表:2012年1-10月中国毛绒玩具出口情况(分目的地)
图:2006-2012年全球塑胶玩具市场规模
图:2006-2012年中国塑胶玩具市场规模
图:2006-2009年中国电子玩具出口额
表:2012年1-10月中国智力玩具TOP10出口国家/地区
表:2011-2012年奥飞动漫发展历程
图:2009-2012年奥飞动漫营业收入与净利润
表:2010-2012年奥飞动漫主营业务收入(分业务)构成
图:2012年上半年奥飞动漫主营业务收入构成(分业务)
图:2006-2012年奥飞动漫营业收入(分地区)构成
表:奥飞动漫各类玩具特点及代表作品
图:奥飞动漫卡通形象
图:2009-2012年奥飞动漫玩具业务毛利率
图:奥飞动漫业务
图:奥飞动漫全产业链
图:星辉车模主要授权品牌
图:2000-2011年星辉车模发展历程
图:2009-2012年星辉车模营业收入与净利润
图:星辉车模产品销售价格(元/具)
图:2009-2012年星辉车模营业收入(分业务)构成
图:2009-2012年星辉车模营业收入(分地区)构成
图:2009-2012年星辉车模产品毛利率
表:2009-2012年星辉车模研发费用投入及占营业收入比例
图:星辉车模内外销业务模式
表:2011年星辉车模前五名客户营业收入及占比
图:2009-2012年高乐股份营业收入与净利润
表:2009-2012年高乐股份营业收入(分产品)构成
图:2009-2012年高乐股份营业收入(分地区)构成
表:2009-2012年高乐股份主要产品毛利率
表:2012年上半年高乐股份前五名客户营业收入及占比
表:高乐股份募投项目设计产能
图:群兴玩具主要产品
图:2009-2012年群兴玩具营业收入与净利润
图:2008-2012年群兴玩具营业收入(分产品)构成
图:2008-2012年群兴玩具营业收入(分地区)构成
表:2008-2012年群兴玩具主要产品毛利率
表:电子电动塑料玩具生产基地产能及收入
表:2008-2011年群兴玩具研发费用投入及占营业收入比例
表:骅威股份主要产品
图:2009-2012年骅威股份营业收入与净利润
图:2009-2012年骅威股份营业收入(分产品)构成
图:2010-2012年骅威股份营业收入(分地区)构成
图:2009-2012年骅威股份主要产品毛利率
表:2009-2012年骅威股份研发费用及占营业收入的比例
图:骅威股份“动漫+玩具”商业模式流程
表:2012年上半年骅威股份前五名客户营业收入及占比
表:骅威股份募集资金项目(截止2012年6月)
表:骅威股份动漫制作项目分析
表:骅威股份营销网络建设项目
表:2010-2012年好孩子国际主要财务指标
表:2010-2012年好孩子国际销售额(分产品)构成
图:2010-2012年好孩子国际销售额(分地区)构成
图:2011H1-2012H1隆成集团主要财务指标
图:2012年上半年隆成集团收入与利润(分业务)构成
图:2007-2009年英德玩具营业收入
图:2007-2012年美泰收入
图:2007-2012年美泰收入(分品牌)构成
图:2012年前三季度美泰各品牌表现
图:2011-2012年美泰收入(分地区)构成
图:2012年前三季度美泰各地区收入情况
图:2012年美泰毛利率
图:2009-2012年孩之宝营业收入与净利润
图:2012年Q1-Q3孩之宝营业收入与净利润
图:2011年孩之宝营业收入(分产品)构成
图:2007、2009和2010年变形金刚业务回归对公司业绩的影响
图:2005-2011年孩之宝男孩玩具收入及增速
图:孩之宝产业链
图:1988-2011年孩之宝收入增速与利润增速
图:2005-2011财年日本Takara Tomy公司主要营业指标
图:2011-2012财年日本Takara Tomy公司主要运营指标
图:2011-2012财年日本Takara Tomy公司净销售额(分区域)构成
图:2012财年上半年日本Takara Tomy公司在华业务扩展
图:乐高公司主要玩具产品
图:2007-2011年丹麦乐高主要运营指标
表:乐高中国发展历程
图:日本万代业务模块
图:日本万代集团主要玩具产品
图:2008-2012财年日本万代集团净销售额与净利润
图:2012-2013财年上半年日本万代集团主要营业指标
图:2012-2013财年上半年日本万代集团净销售额(分业务)构成
图:2013财年日本万代集团主要营业指标预测
图:2013财年日本万代集团主要营业指标预测(分业务)
图:2013财年下半年日本万代集团区域发展战略
图:2013财年下半年日本万代集团玩具业务发展战略
Global Toy Sales, 2007-2012
Global Toy Sales (by Region), 2010
Toy Sales and Growth Rate in Major Countries, 2011
Best-selling Toys in Major Countries
Toy Sales and YoY Growth Rate in USA, 2003-2011
Toy Sales in USA (by Toy Type), 2003-2011
Toy Sales in Japan, 2007-2011
Sales of Major Toys in Japan, 2010-2011
Toy Sales in France, 2005-2010
Sales Channels of French Toys, 2009
Per Capita Consumption Expenditure of Children in Major Countries, 2010
Per Capita GDP and Growth Rate in China, 1999-2011
Per Capita Consumption Expenditure and Retail Sales of Children’s Toys in China
Number of Toy Manufacturers in China, 1999-2012
Revenue and YoY Growth Rate of China Toy Manufacturing Industry, 2000-2012
Total Profit and YoY Growth Rate of China Toy Manufacturing Industry, 2000-2012
Industrial Sales Output Value and Export Delivery Value of China Toy Manufacturing Industry, 2008-2012
Standard Certification in Toy Industry
Ranking of TOP 10 Toy Brands in China, 2012
Contrast between Major Overseas Toy Manufacturers
Contrast between Major Chinese Toy Manufacturers
Revenue and Net Income CAGR of Major Listed Chinese Toy Manufacturers after IPO
Export Value and YoY Growth Rate of Chinese Toys, 2000-2012
Export Value and MoM Growth Rate of Chinese Toys, Jan.-Nov. 2012
“Smiling Curve” of Toy Industry Value
Barriers to EU Toy Market
Toy Sales Channels in Major European Countries, 2008
Toy Sales Channels in China, 2010
R&D Costs and % of Revenue of Mattel, Hasbro and BANDAI NAMCO, 2006-2011
Magazine Barbie
Proportion of Advertising Expenses in Revenue of Major Toy Manufacturers in the World, 2011
Output of Plastic Products in China, 2000-2012
Total Industrial Output Value of China Plastic Product Industry, 2000-2011
Correlative Effects of Cartoon & Animation Industry
Policiy Support for Cartoon & Animation Industry and Effects in Developed Countries
Policiy Support for China Cartoon & Animation Industry
Chinese Cartoon & Animation Market Scale, 2007-2012E
Output and Growth Rate of Local Cartoons in China, 2000-2011
Local Cartoon Market Scale and Growth Rate in China, 20007-2012
Chinese Animation Movie Market Scale and Growth Rate, 2007-2012
Contribution of Animation Movies to Total Box Office in China, 2007-2011
TOP 5 Animation Movies in China (by Box Office), 2008-2011
China Animation Industry Chain
Actual Sales of Game Market in China, 2004-2012
Actual Sales and Growth Rate of PC Online Game Market in China, 2006-2016E
User Number and Utilization of Online Games in China, 2011-2012
Export Value and Growth Rate of Chinese Plush Toys, 2004-2011
Export of Chinese Plush Toys (by Destination), Jan.-Oct. 2012
Global Market Size of Plastic Toys, 2006-2012
Plastic Toy Market Size in China, 2006-2012
Export Value of Chinese Electronic Toys, 2006-2009
TOP10 Export Destinations of Chinese Intellectual Toys, Jan.-Oct. 2012
Development Course of Alpha Animation, 2011-2012
Revenue and Net Income of Alpha Animation, 2009-2012
Revenue of Alpha Animation (by Business), 2010-2012
Revenue of Alpha Animation (by Business), 2012H1
Revenue of Alpha Animation (by Region), 2006-2012
Features and Representative Works of Alpha Animation by Toy Type
Cartoon Images of Alpha Animation
Gross Margin of Toy Business of Alpha Animation, 2009-2012
Business of Alpha Animation
Industry Chain of Alpha Animation
Major Authorized Brands of Xinghui Auto Model
Development Course of Xinghui Auto Model, 2000-2011
Revenue and Net Income of Xinghui Auto Model, 2009-2012
Product Sales Prices of Xinghui Auto Model
Revenue of Xinghui Auto Model (by Business), 2009-2012
Revenue of Xinghui Auto Model (by Region), 2009-2012
Product Gross Margin of Xinghui Auto Model, 2009-2012
R&D Costs and % of Total Revenue of Xinghui Auto Model, 2009-2012
Marketing Model of Xinghui Auto Model
Xinghui Auto Model’s Revenue from Top 5 Clients and % of Total Revenue, 2011
Revenue and Net Income of Goldlok Toys, 2009-2012
Revenue of Goldlok Toys (by Product), 2009-2012
Revenue of Goldlok Toys (by Region), 2009-2012
Gross Margin of Major Products of Goldlok Toys, 2009-2012
Goldlok Toys’ Revenue from Top 5 Clients and % of Total Revenue, 2012H1
Designed Capacity of Fund-Raising Projects of Goldlok Toys
Major Products of Qunxing Toys
Revenue and Net Income of Qunxing Toys, 2009-2012
Revenue of Qunxing Toys (by Product), 2008-2012
Revenue of Qunxing Toys (by Region), 2008-2012
Gross Margin of Major Products of Qunxing Toys, 2008-2012
Capacity and Revenue of Production Base for Electronic and Plastic Toys
R&D Costs and % of Total Revenue of Qunxing Toys, 2008-2011
Major Products of Huawei Technology
Revenue and Net Income of Huawei Technology, 2009-2012
Revenue of Huawei Technology (by Product), 2009-2012
Revenue of Huawei Technology (by Region), 2010-2012
Gross Margin of Major Products of Huawei Technology, 2009-2012
R&D Costs and % of Total Revenue of Huawei Technology, 2009-2012
Process of “Animation + Toy” Business Model of Huawei Technology
Huawei Technology’s Revenue from Top 5 Clients and % of Total Revenue, 2012H1
Fund-Raising Projects of Huawei Technology (by Jun 2012)
Animation Production Projects of Huawei Technology
Marketing Network Projects of Huawei Technology
Major Financial Indicators of Goodbaby International, 2010-2012
Sales of Goodbaby International (by Product), 2010-2012
Sales of Goodbaby International (by Region), 2010-2012
Major Financial Indicators of Lerado Group, 2011H1-2012H1
Revenue and Profit of Lerado Group (by Business), 2012H1
Revenue of Intex Toys, 2007-2009
Revenue of Mattel, 2007-2012
Revenue of Mattel (by Brand), 2007-2012
Performance of Mattel by Brand, 2012Q1-Q3
Revenue Structure of Mattel (by Region), 2011-2012
Revenue of Mattel by Region, 2012Q1-Q3
Gross Margin of Mattel, 2012
Revenue and Net Income of Hasbro, 2009-2012
Revenue and Net Income of Hasbro, 2012Q1-Q3
Revenue of Hasbro (by Product), 2011
Impact of Restored Transformer Business on Performance of Hasbro, 2007, 2009 and 2010
Revenue and Growth Rate of Boy Toys of Hasbro, 2005-2011
Industry Chain of Hasbro
Growth Rates of Revenue and Profit of Hasbro, 1988-2011
Major Operating Indicators of Takara TOMY, FY2005-FY2011
Major Operating Indicators of Takara TOMY, FY2011-FY2012
Net Sales of Takara TOMY (by Region), FY2011-FY2012
Business Expansion of Takara TOMY in China, FY2012H1
Major Toy Products of LEGO
Major Operating Indicators of LEGO, 2007-2011
Development Course of LEGO in China
Business Segments of BANDAI NAMCO
Major Toy Products of BANDAI NAMCO
Net Sales and Net Income of BANDAI NAMCO, FY2008-FY2012
Major Operating Indicators of BANDAI NAMCO, FY2012-FY2013H1
Net Sales of BANDAI NAMCO (by Business), FY2012-FY2013H1
Forecast for Major Operating Indicators of BANDAI NAMCO, FY2013
Forecast for Major Operating Indicators of BANDAI NAMCO (by Business), FY2013
Regional Strategy of BANDAI NAMCO in FY2013H2
Toy Business Strategy of BANDAI NAMCO in FY2013H2
如果这份报告不能满足您的要求,我们还可以为您定制报告,请 留言说明您的详细需求。
|